

Summary
Here we demonstrate the protocols for performing single-molecule fluorescence microscopy on living bacterial cells to enable functional molecular complexes to be detected, tracked and quantified.
Abstract
Full insight into the mechanisms of living cells can be achieved only by investigating the key processes that elicit and direct events at a cellular level. To date the shear complexity of biological systems has caused precise single-molecule experimentation to be far too demanding, instead focusing on studies of single systems using relatively crude bulk ensemble-average measurements. However, many important processes occur in the living cell at the level of just one or a few molecules; ensemble measurements generally mask the stochastic and heterogeneous nature of these events. Here, using advanced optical microscopy and analytical image analysis tools we demonstrate how to monitor proteins within a single living bacterial cell to a precision of single molecules and how we can observe dynamics within molecular complexes in functioning biological machines. The techniques are directly relevant physiologically. They are minimally-perturbative and non-invasive to the biological sample under study and are fully attuned for investigations in living material, features not readily available to other single-molecule approaches of biophysics. In addition, the biological specimens studied all produce fluorescently-tagged protein at levels which are almost identical to the unmodified cell strains ("genomic encoding"), as opposed to the more common but less ideal approach for generating significantly more protein than would occur naturally ('plasmid expression'). Thus, the actual biological samples which will be investigated are significantly closer to the natural organisms, and therefore the observations more relevant to real physiological processes.Protocol
- To begin this procedure, 50 μl of frozen stocks of fluorescent protein expressing Escherichia coli bacterial cells are first defrosted and grown aerobically with shaking in 5 ml LB growth media overnight at 37 degrees C. In the morning, 50 μl of this saturated culture is extracted and sub-cultured into minimal M63 glucose culture media, incubating at 30 degrees C for 4 to 6 hours. Here we demonstrate using two different cell strains, one of which expresses an electron-transporting cytochrome fused to GFP, the other which expresses a protein involved in the bacterial flagellar motor fused to GFP.
- Cells may either harvested directly from the growing sub-culture if viewing them as immobilized samples, or they may be sheared to truncate bacterial flagella if viewing under "tethered" conditions.
- Shearing involves placing typically 1-5ml of the sub-culture into a device consisting of two sterile syringes joined by sterile piping. The shearing is done by alternating pushing in each syringe pump to push the culture through the narrow tubing. This is done 50-100 times, depending on the extent of shearing required. The culture is then centrifuged to pellet the cells, which is resuspended in minimal media to remove flagella fragments.
- We then prepare cleaned BK7 glass coverslips by immersing in a saturated solution of KOH in ethanol for 20 min, then rinsing thoroughly in de-ionized water and ethanol and leaving to dry in air for at least 1 h.
- We construct a simple flow-cell to house the cells in the microscope. This involves drawing lines of paraffin grease on a BK7 glass microscope slide and then creating a tunnel-sandwich by placing one of the cleaned coverlips on top, and pressing down gently with a pair of forceps, giving a flow cell volume of 5-10 μl.
- To observe immobilized cells we fill the flow-cell by injection with a 0.1% w/v solution of poly-L-lysine, and allow it to incubate at room temperature for at least 1 min. We then flush out using 100 μl minimal media by injecting the media from one end of the flow-cell and wicking with tissue paper from the other.
- We then wick through 20 μl of a 1:500 dilution of 200 nm diameter latex microspheres (Polysciences) in minimal media to mark the coverslip surface. The flow-cell is inverted such that the coverslip is facing downwards, placed on a platform clear of the surface in a simple humidity chamber, and incubated at room temperature for 5 min. Unbound beads are then washed away by wicking through 100 μl minimal media.
- If we wish to observe tethered cells we omit the poly-L-lysine step and instead fill the flow-cell with 5 mg/ml anti-flagellin antibody. The flow-cell is place in the humidity chamber for 10 min and is then flushed through by wicking.
- 20 μl of the cell culture is then wicked through the flow-cell, either using the sheared sample if observing tethered cells or the unsheared sample in viewing immobilized cells.
- The flow-cell is inverted and placed in the humidity chamber for 20 min. Unbound cells are then washed out by wicking through 100 μl minimal media.
- A drop of immersion oil is placed in the centre of the top surface of the coverslip and the flow-cell is then placed gently on to the sample holder of the custom built fluorescence microscope, making optical contact with the high numerical aperture objective lens.
- The microscope electron-multiplying camera is switched on and the camera set to be cooled to -70 degrees C, The software is set to acquire images at a typical frame rate of 25 Hz in frame-transfer mode, initially disenabling the gain control on the camera.
- The brightfield illumination is switched on and the image is brought into focus, selecting a suitable cell or group of cells to be imaged on the basis of their being stuck with their long axis parallel to the coverslip surface. The focus is finely adjusted to ensure that the 200 nm latex beads stuck to the coverslip surface are just in focus.
- An image sequence is acquired in brightfield to record the outline of the cell body. The brightfield illumination is switched off and the camera gain is enabled to maximum.
- For a standard acquisition using total internal reflection fluorescence (or TIRF) a laser beam over appropriate wavelength (here, for green fluorescent protein excitation, we use a 473 nm laser) is pre-set so as to be focused in the back focal plane of the objective lens but displaced laterally from the optic axis to generate an evanescent field for fluorescence excitation into the cell sample.
- The camera acquisition is started and the laser shutter opened to excite the fluorescent proteins within the bacteria. The parameters for laser intensity and speed of acquisition need to be optimized for the particular biological system under investigation by experimenting with different values, but a typical range relevant to studying mobile protein complexes in the cell membrane are 1-10 mW laser power over a circular excitation area of diameter ~30 μm, with an exposure time per frame of 5-40 ms. Samples are illuminated until photobleached, typically for ~10 s.
- This protocol can be used both for tethered cells in which the body of the cell is rotating about a point of attachment between the coverslip and a flagellar stub, and for immobilized cells which are rigidly fixed to the coverslip surface.
- Some cell strains which have a high copy number of complexes benefit from an initial diffraction-limited focused laser bleach on one pole of the cell prior to TIRF imaging. This bleach is equivalent to that used in fluorescence recovery after photobleaching (or FRAP). Using our custom microscope some of the excitation laser light can be fed off into a second independent path used for FRAP-type bleaching. Typically 1-10mW laser power is used, with a typical bleach time in the range 10-300 ms. This results in much higher imaging contrast in the bleached zone of the cell allowing individual complexes which subsequently diffuse into that area to be more easily visualized.
- For visualizing complexes in the cell cytoplasm which diffuse much faster than those in the cell membrane a different illumination mode called "slimfield" is employed. Here a focused laser is expanded laterally to just encompass a single cell. This produces a very intense field allowing much faster exposures of typically a millisecond to be taken.
- Following data acquisition, the images are fed into custom written software (coded in LabVIEW 8.5). This automatically detects the positions of fluorescent spots in the cells to a precision of a typically few nanometers and extracts their size and brightness. The brightnessof the photobleaching trace with respect to time of a tracked molecular complex is then used to estimate the stoichiometry, i.e. how many individual fluorescent proteins make up a single molecular complex.
Representative Results:
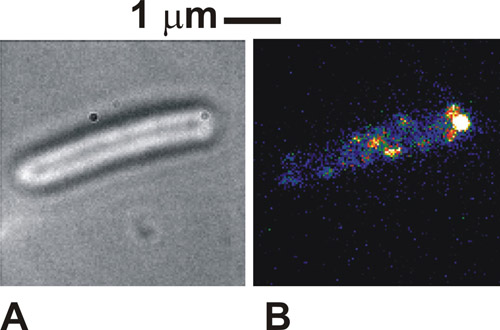
When the protocol is done correctly the images of the cells viewed in brightfield is very distinct, with the perimeters of the cell bodies dark against a white/gray cell body (Figure 1a). In fluorescence using immobilized cells, we can see distinct spots intensity, of typically 250-300 nm in width (Figure 1b). Healthy, tethered cells will be seen to rotate around the point of tether attachment in brightfield images. Under fluorescence excitation some molecular complexes in our case might also be seen at the point of attachment, indicating a localization of the tagged protein with the flagellar motor. These spots are individual molecular complexes and the number of them seen will depend upon the illumination mode used and how many of the complexes are actually present in the cell at any one time. The mobility of the spots depends upon the specific biological system under study. If the density of spots is initially very high, as is the case with the labeled cytochromes used here, then performing an initial FRAP bleach can improve the imaging contrast.

Figure 1. (A) Brightfield and (B) TIRF image (false color) for an immobilized Escherichia coli cell expressing a protein fused to green fluorescent protein (GFP) which is known to be involved in the flagellar motors of bacteria. Please click here to see a larger version of figure 1.
Subscription Required. Please recommend JoVE to your librarian.
Discussion
Care must be taken not to "over shear" cell for looking at tethered bacteria, since this may impair the functionality of the flagellar motors. It is important to use cells for much longer than an hour once on the microscope slide since they may become oxygen depleted. Considerable optimization may be required to find the best microscope imaging conditions catered to your specific biological system under investigation. It may be wise to attempt the imaging using purified GFP alone to ascertain the correct intensity laser excitation required for your particular microscope system.
Subscription Required. Please recommend JoVE to your librarian.
Disclosures
The authors have nothing to disclose.
Acknowledgments
We acknowledge the kind donations of bacterial strains from the groups of Prof. Judith Armitage (University of Oxford, UK) and Prof. Conrad Mullineaux (Queen Mary University of London, UK). IMD is jointly funded by the Dept of Biochemistry (Oxford University) and OCISB; AR is funded by an Engineering and Physical Sciences Research Council (EPSRC) DTC studentship; ND is funded from the Biotechnology and Biological Sciences Research Council (BBSRC); MCL is funded by a Royal Society University Research Fellowship.
References
- Leake, M. C., Chandler, J. H., Wadhams, G. H., Bai, F., Berry, R. M., Armitage, J. P. Stoichiometry and turnover in single, functioning membrane protein complexes. Nature. 443, 355-358 (2006).
- Leake, M. C., Greene, N. P., Godun, R. M., Granjon, T., Buchanan, G., Chen, S., Berry, R. M., Palmer, T., Berks, B. C. Variable stoichiometry of the TatA component of the twin-arginine protein transport system observed by in vivo single-molecule imaging. Proc Natl Acad Sci U S A. 105, 15376-15381 (2008).
- Leake, M. C., Wilson, D., Gautel, M., Simmons, R. M., M, R. The elasticity of single titin molecules using a two-bead optical tweezers assay. Biophys. J. 87, 1112-1135 (2004).
- Leake, M. C., Wilson, D., Bullard, B., Simmons, R. M. The elasticity of single kettin molecules using a two-bead laser-tweezers assay. FEBS Lett. , 535-555 (2003).
- Lenn, T., Leake, M. C., Mullineaux, C. W. In vivo clustering and dynamics of cytochrome bd complexes in the Escherichia coli plasma membrane. Mol. Microbiol. 70, 1397-1407 (2008).
- Lenn, T., Leake, M. C., Mullineaux, C. W. Are Escherichia coli OXPHOS complexes concentrated in specialised zones within the plasma membrane. Biochem. Soc. Trans. 36, 1032-1036 (2008).
- Lo, C. J., Leake, M. C., Pilizota, T., Berry, R. M. Single-cell measurements of Membrane Potential, Sodium-Motive Force and Flagellar Motor Speed in Escherichia coli. Biophys. 93, 294-302 (2007).
- Lo, C. J., Leake, M. C., Berry, R. M. Fluorescence measurement of intracellular sodium concentration in single Escherichia coli cells. Biophys. J. 90, 357-3565 (2006).
