

Summary
Functional studies of the auditory system in mammals have traditionally been conducted using spatially-focused techniques such as electrophysiological recordings. The following protocol describes a method of visualizing large-scale patterns of evoked hemodynamic activity in the cat auditory cortex using functional magnetic resonance imaging.
Abstract
Current knowledge of sensory processing in the mammalian auditory system is mainly derived from electrophysiological studies in a variety of animal models, including monkeys, ferrets, bats, rodents, and cats. In order to draw suitable parallels between human and animal models of auditory function, it is important to establish a bridge between human functional imaging studies and animal electrophysiological studies. Functional magnetic resonance imaging (fMRI) is an established, minimally invasive method of measuring broad patterns of hemodynamic activity across different regions of the cerebral cortex. This technique is widely used to probe sensory function in the human brain, is a useful tool in linking studies of auditory processing in both humans and animals and has been successfully used to investigate auditory function in monkeys and rodents. The following protocol describes an experimental procedure for investigating auditory function in anesthetized adult cats by measuring stimulus-evoked hemodynamic changes in auditory cortex using fMRI. This method facilitates comparison of the hemodynamic responses across different models of auditory function thus leading to a better understanding of species-independent features of the mammalian auditory cortex.
Introduction
Current understanding of auditory processing in mammals is mainly derived from invasive electrophysiological studies in monkeys1-5, ferrets6-10, bats11-14, rodents15-19, and cats20-24. Electrophysiological techniques commonly utilize extracellular microelectrodes to record the activity of single and multiple neurons within a small area of neural tissue surrounding the electrode tip. Established functional imaging methods, such as optical imaging and functional magnetic resonance imaging (fMRI), serve as useful complements to extracellular recordings by providing a macroscopic perspective of simultaneous driven activity across multiple, spatially distinct regions of the brain. Intrinsic signal optical imaging facilitates visualization of evoked activity in the brain by measuring activity-related changes in the reflectance properties of surface tissue while fMRI utilizes the blood-oxygen level-dependent (BOLD) contrast to measure stimulus-evoked hemodynamic changes in brain regions which are active during a particular task. Optical imaging requires direct exposure of the cortical surface to measures changes in surface tissue reflectance that are related to stimulus-evoked activity25. In comparison, fMRI is noninvasive and exploits the paramagnetic properties of deoxygenated blood to measure both cortical surface26-28 and sulcus-based27,29 evoked activity within an intact skull. Strong correlations between the BOLD signal and neuronal activity in nonhuman primate visual cortex30 and in human auditory cortex31 validate fMRI as a useful tool to study sensory function. Since fMRI has been used extensively to study features of the auditory pathway such as tonotopic organization32-36, lateralization of auditory function37, patterns of cortical activation, identification of cortical regions38, effects of sound intensity on auditory response properties39,40, and characteristics of the BOLD response time course29,41 in human, monkey, and rat models, the development of a suitable functional imaging protocol to study auditory function in the cat would provide a useful complement to the functional imaging literature. While fMRI has also been used to explore various functional aspects of the visual cortex in the anesthetized cat26-28,42, few studies have used this technique to examine sensory processing in cat auditory cortex. The purpose of the present protocol is to establish an effective method of using fMRI to quantify function in the auditory cortex of the anesthetized cat. The experimental procedures outlined in this manuscript have been successfully used to describe the features of the BOLD response time course in the adult cat auditory cortex43.
Subscription Required. Please recommend JoVE to your librarian.
Protocol
The following procedure can be applied to any imaging experiment in which anesthetized cats are used. Steps which are specifically required for auditory experiments (steps 1.1-1.7, 2.8, 4.1) can be modified to accommodate other sensory stimulus protocols.
All experimental procedures received approval from the Animal Use Subcommittee of the University Council on Animal Care at the University of Western Ontario and followed the guidelines specified by the Canadian Council on Animal Care (CCAC)44. The outlined experiment requires approximately 150 min from animal preparation to recovery. The time course of the experiment is illustrated in Figure 1.
1. Stimulus Equipment Preparation
Figure 2 shows the electronic components and corresponding connections required for generating an auditory stimulus in the MRI scanner. The requirements are as follows: a computer, an external sound card, a stereo power amplifier and an fMRI-compatible earphone system.
- Connect the computer which will be used to present the auditory stimulus to the external sound card via the Universal Serial Bus (USB) cable.
- Attach the cables connecting the output ports of the external sound card to the input ports of the stereo power amplifier.
- Attach the cables connecting the output ports of the stereo power amplifier to the input ports of the transformer box of the fMRI-compatible earphone system.
- Connect the binaural earphones to the output ports of the transformer box.
- Use shielded coaxial cables with BNC connections to connect the transformer box to the penetration panel outside the scanner room.
- Connect the earphone cable assembly to the corresponding BNC ports on the penetration panel inside the scanner room.
- Connect the foam ear tips to the earphones then connect the earphones to the cable assembly. Run a test auditory stimulus to confirm that sound is being transmitted from the computer to the earphones. Disconnect the earphones and insert the foam ear tips securely into the cat's ears during the animal preparation phase (step 2.7).
2. Animal Preparation
- To premedicate the cat, administer a sedative mixture of atropine sulphate (0.02 mg/kg) and acepromazine (0.02 mg/kg) via a subcutaneous (SC) injection.
- After 20 min, administer ketamine (4 mg/kg) and dexmedetomidine hydrochloride (0.02-0.03 mg/kg) via an intramuscular (IM) injection to induce anesthesia. Ketamine is usually combined with a sedative and muscle relaxant, in this case, dexmedetomidine hydrochloride, to reduce the tremors and muscle rigidity commonly observed when ketamine is used alone45. This anesthetic combination typically induces approximately 150 min of sedation and is frequently used in veterinary practice to induce anesthesia in small animals.
- Once the cat has lost its righting reflex, apply ophthalmic ointment to the eyes to prevent dryness during the procedure. Place an indwelling catheter in the medial saphenous vein for intravenous delivery of ketamine.
- Test for successful anesthetic induction by pinching a toe on the forepaw then observing whether the cat withdraws its paw. Once the pedal reflex disappears, suppress the gag reflex by spraying lidocaine onto the pharyngeal walls then intubate the cat with a 4.0-4.5 endotracheal tube.
- Maintain anesthesia throughout the imaging session with a constant rate infusion of ketamine (0.6-0.75 mg/kg/hr) and inhaled isoflurane (0.4-0.5%) delivered in 100% oxygen at 1-1.5 L/min. Combine 60 ml of saline and 0.07 ml of ketamine in a 60 ml syringe then place the syringe in the syringe pump. This step can be performed before premedicating the cat.
- Place warm wax-filled heating pads on the floor of the MRI-compatible sled (Figures 3a and 3c) then layer the insulating plastic bubble wrap around the interior walls of the sled.
- Place the cat in a sternal position within the insulating bubble wrap in the MRI-compatible sled (Figure 3c).
- Once the cat is positioned, adjust the head to gain access to the ears. Roll the foam ear tips into the smallest diameter possible then insert each ear tip deep into the ear canal. Once inserted, the foam ear tips should expand to fill the space within the ear canals.
- Adjust the cat until its head is properly positioned within the 3-channel radio-frequency (RF) coil (Figure 3b). Stabilize the head with acoustic dampening memory foam (Figure 3d). Place foam around the ears to provide additional attenuation of the scanner noise.
- Wrap the cat in the blanket of insulating plastic bubble wrap then secure and transport the sled to the scanner bed.
- Connect the infusion lines, anesthetic delivery tubes and monitoring equipment to the cat. Connect the earphones to the earphone cable assembly attached to the penetration panel.
- Start the ketamine infusion at the base flow rate of 0.6 mg/kg/hr then increase the flow rate as required based on the depth of anesthesia. Set the initial isoflurane dose to 0.5% then decrease to 0.4% once the anatomical scans have been collected.
- Monitor and record the cat's blood oxygen saturation, end-tidal CO2 levels, heart rate, respiration and rectal temperature (if possible) throughout the experiment using MRI-compatible monitoring equipment positioned at an appropriate distance from the scanner bore. Table 1 lists the mean values and ranges of the physiological measurements for successful execution of this procedure. Steady increases in heart rate and respiration are usually associated with imminent recovery from anesthesia.
- After the session is completed, remove the cat from the sled. Continue to provide supplemental heating with heating pads and towels until the animal fully recovers. Once the gag reflex returns, remove the endotracheal tube. Monitor the cat until the righting reflex is restored then return the animal to the facility. Assess the animal the day after the procedure to ensure no adverse effects from the experiment.
3. Brain Imaging
- Collect anatomical scans of the cat's brain in an axial slice orientation. Use the following imaging parameters for the anatomical reference volume: FLASH imaging sequence with TR = 750 msec, TE = 8 msec, matrix = 256 x 256, acquisition voxel size = 281 μm x 281 μm x 1.0 mm. The duration of the anatomical scan is approximately 6 min. Figure 4 (left panel) provides a sample anatomical image slice obtained using the specified parameters.
- Use the following imaging parameters for the functional volumes: segmented interleaved echo-planar acquisition (EPI) with TR = 1,000 msec, TE = 15 msec, 3 segments/plane, 21 x 1 mm slices; matrix = 96 x 96; field-of-view = 72 mm x 72 mm; acquisition voxel size = 0.75 mm x 0.75 mm x 1.0 mm; acquisition time = 3 sec/volume. Figure 4 (right panel) provides a sample functional image slice obtained using the specified parameters.
4. Stimulus Presentation
- Present a broadband white noise stimulus (0-25 kHz, 100 msec bursts with 5 msec rise/fall time, 1 presentation every 200 msec, 90-100 dB SPL) in a block design in which the auditory stimulus is played for 30 sec and alternated with a 30 sec baseline (no-stimulus) condition (Figure 5). Repeat this step until acoustically-evoked BOLD activity is observed in the auditory cortex. The duration of each functional run using a block design is approximately 4.5 min for 90 volumes.
- Present the stimulus in the appropriate block design configuration for the desired number of functional runs.
5. Data Analysis
- Select appropriate fMRI analysis software (e.g. SPM, FSL) to process the acquired functional volumes.
- Realign each functional volume to the volume acquired closest in time to the reference anatomical scan. Save the resulting motion correction values for use in step 5.6. Exclude any functional runs in which rotational head movements exceed 1° or translational head movements exceed 1 mm.
- Coregister each volume to the reference anatomical scan.
- Smooth each volume with a 2 mm full-width half-maximum (FWHM) Gaussian filter.
- Incorporate a square-wave (boxcar) function which corresponds to the ON-OFF stimulus block design as a regressor to the general linear model (GLM).
- Incorporate motion correction values as regressors of no interest to account for movement-related artifacts. Apply an uncorrected statistical threshold of p = 0.001 to the GLM results to view clusters of BOLD activation. Determine the size of the smallest cluster which meets a corrected (family-wise error: FWE) threshold of p < 0.05 at the cluster level. Set the cluster extent threshold to this value to view statistically significant clusters in regions of interest.
- Define the BOLD percent signal change (PSC) at each voxel as the difference between the mean BOLD signal during the stimulation blocks and the mean BOLD signal during the baseline blocks.
Subscription Required. Please recommend JoVE to your librarian.
Representative Results
Representative functional data were acquired in a 7T horizontal bore scanner and analyzed using the Statistical Parametric Mapping toolbox in MATLAB. Robust cortical hemodynamic responses to auditory stimulation have consistently been observed in cats using the described experimental protocol43. Figure 6 illustrates the BOLD activation in 2 animals in response to a 30 sec broadband noise stimulus presented in a block design. T-statistic maps of the broadband noise vs. baseline (no stimulus) contrast in 2 image slice planes reveal contiguous clusters of bilateral acoustically-evoked activity in the auditory cortex (Figures 6a and 6d; cluster-level FWE-corrected threshold: p < 0.05). Figures 6b and 6e show modulations in the BOLD signal, during a single functional run, at the highlighted voxels in Figures 6a and 6d respectively. With a square-wave general linear model fit, one should expect that the BOLD signal will be modulated relative to the baseline (no-stimulus condition) during each presentation of the auditory stimulus in a manner similar to the ON-OFF pattern of the block design. Figures 6c and 6f illustrate the event-related mean time courses of the BOLD response normalized to the mean BOLD baseline signal. In these examples, the BOLD signal exhibits a significant increase relative to the baseline 3-6 sec after the stimulus onset. This increase in the BOLD signal is typically maintained throughout the auditory stimulus presentation then declines to baseline values 6 sec after stimulus offset.
| Physiological Parameter | Normal Rangea | Mean Value (Experiment)b |
| Heart rate | 110-226 beats/min | 143±4.1 beats/min |
| Respiration rate | 20-40 breaths/min | 21±1.6 breaths/min |
| End-tidal CO2 | 35-45 mm Hg | 30±1.7 mmHg |
| Blood O2 saturation | 90-100%57 | 92±1.2% |
| Rectal temperature | 38.5±0.5 °C | N/A |
Table 1. Normal ranges in awake cats and mean values in anesthetized cats for physiological parameters measured during the fMRI procedure. aNormal ranges obtained from guidelines specified by the Canadian Council on Animal Care. 44 b Mean values (± SEM) obtained from N = 7 cats over 20 imaging sessions.

Figure 1. Time course of the experiment. Each step in the experimental procedure is plotted along the time line (in min) relative to the time at which premedication is administered.

Figure 2. Auditory stimulus production equipment. (a) Electronic components used in the experimental protocol. (b) Diagram of connections between each component. The transformer box and the cable assembly of the MRI-compatible earphone system interface at the penetration panel between the scanner room and the computer room.
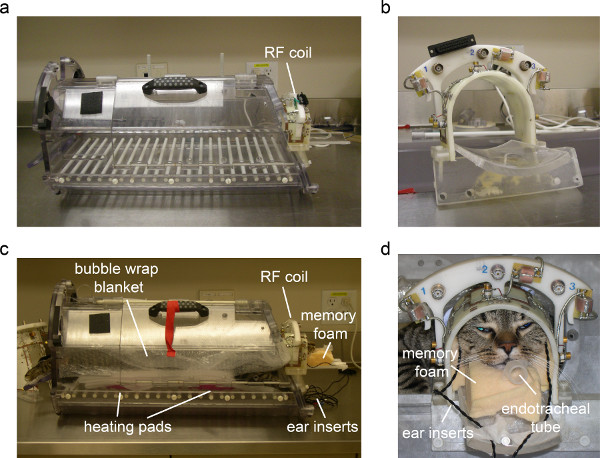
Figure 3. Experimental setup. (a) MRI-compatible sled. (b) 3-channel cat head RF coil. (c) Side view of an anesthetized cat situated in the sled. (d) Front view of the cat in the sled with its head in the 3-channel RF coil (adapted from Brown et al.43).

Figure 4. Examples of anatomical (left) and functional (right) image slices acquired in a 7T horizontal bore scanner using a 3-channel RF coil. Approximate location of the displayed slice is overlaid on a lateral view of the cat right hemisphere. A: anterior, P: posterior, L: left, R: right.

Figure 5. Schematic of a block design stimulus presentation. Baseline (i.e. no stimulus) blocks are alternated with 30 sec blocks of auditory stimulus presentation. Functional volumes are acquired continuously (every 3 sec) during the run. TA: duration of volume acquisition. TS: duration of stimulus block.

Figure 6. Representative examples of the BOLD response to broadband noise stimulation. (a), (d) T-statistic maps of broadband noise (BBN) vs. baseline (no-stimulus) contrast superimposed on axial (horizontal) anatomical image slices. Approximate locations of displayed slices in (a) and (d) are overlaid on a lateral view of the cat right hemisphere. (b), (e) Raw BOLD signal time courses (in volumes) at the highlighted voxels in (a) and (d) respectively for a single functional run (90 volumes). (c), (f) Event-related averaged BOLD response time courses (in seconds) at the highlighted voxels in (a) and (d) respectively before, during and after a stimulus block. Gray bars represent the period of auditory stimulus presentation. A: anterior, P: posterior, L: left, R: right. Click here to view larger figure.
Subscription Required. Please recommend JoVE to your librarian.
Discussion
In designing an fMRI experiment for an anesthetized animal model of auditory function, the following issues should be given careful consideration: (i) the impact of anesthesia on cortical responses, (ii) the effect of background scanner noise, and (iii) the optimization of the data collection phase of the experimental procedure.
While an anesthetized preparation offers the important advantage of producing a prolonged period of sedation and minimizing potential head motion during a functional imaging session, anesthesia is known to impact cortical hemodynamics. The anesthetics described in this protocol are commonly used in electrophysiological (ketamine) and functional imaging (isoflurane) studies of cat auditory46-48 and visual cortex26-28,42 respectively. Although ketamine is known to minimally influence cortical spontaneous activity49, it has been shown to decrease cerebral metabolism and thus the hemodynamic response in the rat auditory cortex at doses of 10 mg/kg50. However, at the doses recommended in this procedure (4 mg/kg), BOLD signal changes of up to 6% have been observed in the cat auditory cortex in response to acoustic stimulation43. Isoflurane is commonly used to explore functional aspects of cat visual cortex; however, it has also been shown to reduce the magnitude of the hemodynamic responses in the cat visual cortex when compared to an awake preparation51. Furthermore, at doses above 1.5%, isoflurane increases cerebral blood flow in the rat45 and heavily impacts neuronal response sensitivity in the cat auditory cortex52. At the doses administered in this protocol (0.4-0.5%), isoflurane serves as a supporting anesthetic agent to the primary anesthetic, ketamine, thus minimizing the negative effects associated with larger dosages. Propofol has also been used in functional imaging studies53, however, it has been shown to reduce somatosensory evoked potentials45 and BOLD responses in auditory cortex53 in a dose-dependent manner. This anesthetic was thus not suitable to provide the required duration of sedation while minimally impacting BOLD responses. The combination of ketamine and isoflurane described in this protocol thus provides several advantages: (i) it produces a period of deep sedation for up to 2.5 hr; (ii) it minimizes head motion such that rotational movements do not typically exceed 0.3° and translational movements do not typically exceed 0.1 mm43; and (iii) it minimally impacts the BOLD response with signal changes of up to 6% being observed.
One of the challenges in executing a functional image study of the auditory system is the impact of the background noise generated by the MRI scanner on the measured BOLD response. In this procedure, the sound stimulus is presented in a block design while functional volumes are continuously acquired during the functional run. The issue of scanner noise is addressed in two ways: (i) by the attenuating properties of the foam ear tips which effectively reduce the background noise by up to 30 dB and (ii) by presenting the sound stimulus at an intensity of about 90 dB SPL. As illustrated in Figure 6, the representative example demonstrates that the BOLD signal is effectively modulated during sound stimulus presentation paired with continuous volume acquisition. While the continuous volume acquisition method has been successfully used to investigate tonotopic organization33,35,36 and spatiotemporal processing54 in the auditory system, this approach limits the investigation of questions such as the effect of stimulus intensity on the BOLD response. The described experimental procedure can be modified to further reduce the impact of scanner noise by increasing the period between volume acquisitions and presenting the sound stimulus in the resulting silent interval. This 'sparse acquisition' approach has been used extensively in auditory studies to describe the properties of the BOLD response time course29,41,43,55, to characterize different regions within the auditory cortex37,38,43,56 and to examine the effect of sound intensity on the BOLD response39,40. During continuous volume acquisition, more volumes are collected in a shorter period of time, thus significantly improving the signal-to-noise ratio. The present protocol can therefore be used in conjunction with sparse acquisition experiments to confirm, localize and clearly delineate acoustically-evoked BOLD activity in auditory functional regions of interest.
Prior to acquiring functional volumes for an auditory experiment, it is important to confirm the presence of acoustically-evoked activity in the auditory cortex. BOLD activation is typically evident in the auditory cortex within 45 min of anesthesia induction (Figure 1). While it is likely that significant BOLD activation can be observed earlier in the experiment, no functional runs were collected prior to this 45 min delay due to the time required for animal preparation and collection of the anatomical scan. To optimize data collection, each functional run can be constructed to maximize the number of volumes collected for each stimulus condition. This can be achieved by modifying the procedure in a few ways. First, the time required to collect each volume can be reduced by decreasing the field of view of the functional image slices. The present procedure describes the acquisition of whole brain images. Instead, the boundaries of the 3-D functional volume can be aligned to the anatomical boundaries of the spatially-localized auditory cortex. Second, the volume acquisition time can also be reduced by decreasing the in-plane resolution. However, an in-plane resolution of at least 0.75 mm2 appears sufficient to resolve regional differences in functionality within the auditory cortex. If an increase in the in-plane resolution is desired, the corresponding increase in volume acquisition time can be balanced by reducing the number of slices within the 3-D functional volume and, instead, focusing on a particular sub-region within the auditory cortex.
Overall, the noninvasive nature of fMRI facilitates repeated functional experiments in a single animal over an extended period of time. This technique is therefore ideal for longitudinal investigations which require data collection at multiple time points and can potentially reduce the number of animals required for a given study.
Subscription Required. Please recommend JoVE to your librarian.
Disclosures
The authors declare no conflicts of interest, financial or otherwise.
Acknowledgments
The authors would like to acknowledge the contributions of Kyle Gilbert, who designed the custom RF coil, and Kevin Barker, who designed the MRI-compatible sled. This work was supported by the Canadian Institutes of Health Research (CIHR), Natural Sciences and Engineering Research Council of Canada (NSERC), and Canada Foundation for Innovation (CFI).
Materials
| Name | Company | Catalog Number | Comments |
| Materials | |||
| Atropine sulphate injection 0.5 mg/ml | Rafter 8 Products | ||
| Acepromazine 5 mg/ml | Vetoquinol Inc. | ||
| Ketamine hydrochloride 100 mg/ml | Bimeda-MTC | ||
| Dexmedetomidine hydrochloride (Dexdomitor 0.5 mg/ml) | Orion Pharma | ||
| Isoflurane 99.9% | Abbott Laboratories | ||
| Lidocaine (Xylocaine endotracheal 10 mg/metered dose) | Astra Zeneca | ||
| Lubricating opthalmic ointment (Refresh Lacri Lube) | Allergan Inc. | ||
| Saline 0.95% | |||
| IV Catheter 22 g (wings) | |||
| IV Extension Set | Codan US Corp. | BC 269 | |
| IV Administration Set 10 drips/ml | |||
| Endotracheal tube 4.0 | |||
| Heating pads (Snuggle Safe) | Lenric C21 Ltd. | ||
| Syringe 60 ml | |||
| Equipment | |||
| External sound card | Roland Corporation | Cakewalk UA-25EX | |
| Stereo power amplifier | Pyle Audio Inc. | Pyle Pro PCAU11 | |
| MRI-compatible insert earphone system | Sensimetric Corporation | Model S14 | |
| Foam ear tips for insert earphones | E-A-R Auditory Systems | Earlink 3B | |
| End-tidal CO2 monitor | Nellcor | N-85 | |
| MRI-compatible pulse oximeter | Nonin Medical Inc. | Model 7500 | |
| Syringe pump | Harvard Apparatus | 70-2208 | |
References
- Kaas, J. H., Hackett, T. A. Subdivisions of auditory cortex and processing streams in primates. Proc. Natl. Acad. Sci. U.S.A. 97, 11793-11799 (2000).
- Kusmierek, P., Rauschecker, J. P. Functional Specialization of Medial Auditory Belt Cortex inthe Alert Rhesus Monkey. J. Neurophysiol. 102, 1606-1622 (2009).
- Recanzone, G. H., Guard, D. C., Phan, M. L. Frequency and Intensity Response Properties of Single Neurons in the Auditory Cortex of the Behaving Macaque Monkey. J. Neurophysiol. 83, 2315-2331 (2000).
- Godey, B., Atencio, C. A., Bonham, B. H., Schreiner, C. E., Cheung, S. W. Functional organization of squirrel monkey primary auditory cortex: Responses to frequency-modulation sweeps. J. Neurophysiol. 94, 1299-1311 (2005).
- Tian, B., Rauschecker, J. P. Processing of frequency-modulated sounds in the lateral auditory belt cortex of the rhesus monkey. J. Neurophysiol. 92, 2993-3013 (2004).
- Mrsic-Flogel, T. D., Versnel, H., King, A. J. Development of contralateral and ipsilateral frequency representations in ferret primary auditory cortex. Eur. J. Neurosci. 23, 780-792 (2006).
- Elhilali, M., Fritz, J. B., Chi, T. -S., Shamma, S. A. Auditory Cortical Receptive Fields: Stable Entities with Plastic Abilities. J. Neurosci. 27, 10372-10382 (2007).
- Shamma, S. A., Fleshman, J. W., Wiser, P. R., Versnel, H. Organization of Response Areas in Ferret Primary Auditory Cortex. J. Neurophysiol. 69, 367-383 (1993).
- Kowalski, N., Versnel, H., Shamma, S. A. Comparison of Responses in the Anterior and Primary Auditory Fields of the Ferret Cortex. J. Neurophysiol. 73, 1513-1523 (1995).
- Nelken, I., Versnel, H. Responses to linear and logarithmic frequency-modulated sweeps in ferret primary auditory cortex. Eur. J. Neurosci. 12, 549-562 (2000).
- Shannon-Hartman, S., Wong, D., Maekawa, M. Processing Of Pure-Tone And FM Stimuli In The Auditory Cortex Of The FM Bat, Myotis lucifugus. Hearing Res. 61, 179-188 (1992).
- Razak, K. A., Fuzessery, Z. M. Neural Mechanisms Underlying Sensitivity for the Rate and Direction of Frequency-Modulated Sweeps in the Auditory Cortex of the Pallid. J. Neurophysiol. 96, 1303-1319 (2006).
- Razak, K. A., Fuzessery, Z. M. GABA Shapes Selectivity for the Rate and Direction of Frequency-Modulated Sweeps in the Auditory Cortex. J. Neurophysiol. 102, 1366-1378 (2009).
- Suga, N. Functional Properties of Auditory Neurones in the Cortex of Echo-Locating Bats. J. Physiol. 181, 671-700 (1965).
- Harrison, R. V., Kakigi, A., Hirakawa, H., Harel, N., Mount, R. J. Tonotopic mapping in auditory cortex of chinchilla. Hearing Res. 100, 157-163 (1996).
- Benson, D. A., Teas, D. C. Single Unit Study of Binaural Interaction in the Auditory Cortex of the Chinchilla. Brain Res. 103, 313-338 (1976).
- Ricketts, C., Mendelson, J. R., Anand, B., English, R. Responses to time-varying stimuli in rat auditory cortex. Hearing Res. 123, 27-30 (1998).
- Gaese, B. H., Ostwald, J. Temporal Coding of Amplitude and Frequency Modulation in the Rat Auditory Cortex. European J. Neurosci. 7, 438-450 (1995).
- Hage, S. R., Ehret, G. Mapping responses to frequency sweeps and tones in the inferior colliculus of house mice. Eur. J. Neurosci. 18, 2301-2312 (2003).
- Merzenich, M. M., Knight, P. L., Roth, G. L. Representation of Cochlea Within Primary Auditory Cortex in the Cat. J. Neurophysiol. 38, 231-249 (1975).
- Knight, P. L. Representation of the Cochlea within the Anterior Auditory Field (AAF) of the Cat. Brain Res. 130, 447-467 (1977).
- Sutter, M. L., Schreiner, C. E., McLean, M., O'Connor, K. N., Loftus, W. C. Organization of Inhibitory Frequency Receptive Fields in Cat Primary Auditory Cortex. J. Neurophysiol. 82, 2358-2371 (1999).
- Whitfield, I. C., Evans, E. F. Responses of Auditory Cortical Neurons to Stimuli of Changing Frequency. J. Neurophysiol. 28, 655-672 (1965).
- Mendelson, J. R., Cynader, M. S. Sensitivity of cat primary auditory cortex (AI) neurons to the direction and rate of frequency modulation. Brain Res. 327, 331-335 (1985).
- Pouratian, N., Toga, A. W. Brain Mapping: The Methods. Toga, A. W., Mazziotta, J. C. , Academic Press. 97-140 (2002).
- Harel, N., Lee, S. P., Nagaoka, T., Kim, D. S., Kim, S. G. Origin of negative blood oxygenation level-dependent fMRI signals. J. Cereb. Blood Flow Metab. 22, 908-917 (2002).
- Olman, C., Ronen, I., Ugurbil, K., Kim, D. S. Retinotopic mapping in cat visual cortex using high-field functional magnetic resonance imaging. J. Neurosci. Methods. 131, 161-170 (2003).
- Kim, D. S., Duong, T. Q., Kim, S. G. High-resolution mapping of iso-orientation columns by fMRI. Nat. Neurosci. 3, 164-169 (2000).
- Belin, P., Zatorre, R. J., Hoge, R., Evans, A. C., Pike, B. Event-related fMRI of the auditory cortex. NeuroImage. 10, 417-429 (1999).
- Logothetis, N. K., Pauls, J., Augath, M., Trinath, T., Oeltermann, A. Neurophysiological investigation of the basis of the fMRI signal. Nature. 412, 150-157 (2001).
- Mukamel, R., et al. Coupling between neuronal firing, field potentials, and fMR1 in human auditory cortex. Science. 309, 951-954 (2005).
- Bilecen, D., Scheffler, K., Schmid, N., Tschopp, K., Seelig, J. Tonotopic organization of the human auditory cortex as detected by BOLD-FMRI. Hearing Res. 126, 19-27 (1998).
- Talavage, T. M., Ledden, P. J., Benson, R. R., Rosen, B. R., Melcher, J. R. Frequency-dependent responses exhibited by multiple regions in human auditory cortex. Hearing Res. 150, 225-244 (2000).
- Talavage, T. M., et al. Tonotopic organization in human auditory cortex revealed by progressions of frequency sensitivity. J. Neurophysiol. 91, 1282-1296 (2004).
- Wessinger, C. M., Buonocore, M. H., Kussmaul, C. L., Mangun, G. R. Tonotopy in human auditory cortex examined with functional magnetic resonance imaging. Human Brain Map. 5, 18-25 (1997).
- Cheung, M. M., et al. BOLD fMRI investigation of the rat auditory pathway and tonotopic organization. NeuroImage. 60, 1205-1211 (2012).
- Langers, D. R. M., van Dijk, P., Backes, W. H. Lateralization connectivity and plasticity in the human central auditory system. NeuroImage. 28, 490-499 (2005).
- Petkov, C. I., Kayser, C., Augath, M., Logothetis, N. K. Functional imaging reveals numerous fields in the monkey auditory cortex. PLoS Biol. 4, 1213-1226 (2006).
- Tanji, K., et al. Effect of sound intensity on tonotopic fMRI maps in the unanesthetized monkey. NeuroImage. 49, 150-157 (2010).
- Zhang, J. W., et al. Functional magnetic resonance imaging of sound pressure level encoding in the rat central auditory system. NeuroImage. 65, 119-126 (2013).
- Baumann, S., et al. Characterisation of the BOLD response time course at different levels of the auditory pathway in non-human primates. NeuroImage. 50, 1099-1108 (2010).
- Jezzard, P., Rauschecker, J. P., Malonek, D. An in vivo model for functional MRI in cat visual cortex. Magn. Reson. Med. 38, 699-705 (1997).
- Brown, T. A., et al. Characterisation of the blood-oxygen level-dependent (BOLD) response in cat auditory cortex using high-field fMRI. NeuroImage. 64, 458-465 (2013).
- Olfert, E. D., Cross, B. M., McWilliam, A. A. Canadian Council on Animal Care. 1, Ottawa, Ontario. (1993).
- Franceschini, M. A., et al. The effect of different anesthetics on neurovascular coupling. NeuroImage. 51, 1367-1377 (2010).
- Heil, P., Irvine, D. R. F. Functional specialization in auditory cortex: Responses to frequency-modulated stimuli in the cat's posterior auditory field. J. Neurophysiol. 79, 3041-3059 (1998).
- Norena, A. J., Gourevitch, B., Pienkowski, M., Shaw, G., Eggermont, J. J. Increasing spectrotemporal sound density reveals an octave-based organization in cat primary auditory cortex. J. Neurosci. 28, 8885-8896 (2008).
- Pienkowski, M., Eggermont, J. J. Long-term, partially-reversible reorganization of frequency tuning in mature cat primary auditory cortex can be induced by passive exposure to moderate-level sounds. Hearing Res. 257, 24-40 (2009).
- Zurita, P., Villa, A. E. P., de Ribaupierre, Y., de Ribaupierre, F., Rouiller, E. M. Changes of single unit activity in the cat auditory thalamus and cortex associated with different anesthetic conditions. Neurosci. Res. 19, 303-316 (1994).
- Crosby, G., Crane, A. M., Sokoloff, L. Local changes in cerebral glucose-utilization during ketamine anesthesia. Anesthesiology. 56, 437-443 (1982).
- Zhao, F., Jin, T., Wang, P., Kim, S. -G. Isoflurane anesthesia effect in functional imaging studies. NeuroImage. 38, 3-4 (2007).
- Cheung, S. W., et al. Auditory cortical neuron response differences under isoflurane versus pentobarbital anesthesia. Hearing Res. 156, 115-127 (2001).
- Dueck, M. H., et al. Propofol attenuates responses of the auditory cortex to acoustic stimulation in a dose-dependent manner: A FMRI study. Acta Anaesthesiol. Scand. 49, 784-791 (2005).
- Seifritz, E., et al. Spatiotemporal pattern of neural processing in the human auditory cortex. Science. 297, 1706-1708 (2002).
- Hall, D. A., et al. 34;Sparse" temporal sampling in auditory fMRI. Human Brain Map. 7, 213-223 (1999).
- Backes, W. H., van Dijk, P. Simultaneous sampling of event-related BOLD responses in auditory cortex and brainstem. Magn. Reson. Med. 47, 90-96 (2002).
- Greene, S. A. In Veterinary Anesthesia and Pain Management Secrets. , Hanley & Belfus, Inc. 121-126 (2002).
