This protocol describes the modified hole board, which is a behavioral test set-up that comprises the characteristics of an open field and a traditional hole board. This set-up enables the differential analysis of unconditioned behavior of small laboratory mammals as well as the analysis of cognitive abilities.
Method Article
The Modified Hole Board - Measuring Behavior, Cognition and Social Interaction in Mice and Rats
In This Article
Summary
Abstract
This protocol describes the modified hole board (mHB), which combines features from a traditional hole board and open field and is designed to measure multiple dimensions of unconditioned behavior in small laboratory mammals (e.g., mice, rats, tree shrews and small primates). This paradigm is a valuable alternative for the use of a behavioral test battery, since a broad behavioral spectrum of an animal’s behavioral profile can be investigated in one single test.
The apparatus consists of a box, representing the ‘protected’ area, separated from a group compartment. A board, on which small cylinders are staggered in three lines, is placed in the center of the box, representing the ‘unprotected’ area of the set-up. The cognitive abilities of the animals can be measured by baiting some cylinders on the board and measuring the working and reference memory. Other unconditioned behavior, such as activity-related-, anxiety-related- and social behavior, can be observed using this paradigm. Behavioral flexibility and the ability to habituate to a novel environment can additionally be observed by subjecting the animals to multiple trials in the mHB, revealing insight into the animals’ adaptive capacities.
Due to testing order effects in a behavioral test battery, naïve animals should be used for each individual experiment. By testing multiple behavioral dimensions in a single paradigm and thereby circumventing this issue, the number of experimental animals used is reduced. Furthermore, by avoiding social isolation during testing and without the need to food deprive the animals, the mHB represents a behavioral test system, inducing if any, very low amount of stress.
Introduction
The modified hole board (mHB) is used to assess multiple dimensions of unconditioned behavior, mainly in mice and rats1. A number of widely used tests measure a single behavioral parameter which does not completely cover the entire phenotype of a behavioral dimension. The mHB was developed based on the concept that rodents can show their rich behavioral repertoire only in a rich testing environment2 and thus allows for complex ethological observations.
The set-up comprises the characteristics of the traditional hole board and the open field test, resulting in a single complex paradigm which overcomes the disadvantages of a test battery (i.e., in reducing the number of animals used1,3,4, circumventing the possible effects of test order5, and reducing time-effect and costs6). In contrast to most behavioral tests (e.g., Hånell & Marklund, 2014)7, an advantage of the mHB is that animals do not need to be food deprived in order to increase the motivation to solve the task. Additionally, social isolation can be circumvented during testing by placing group mates of the experimental animal in a (group-) compartment separated from the test compartment by a transparent perforated partition, allowing for visual, auditory and olfactory contact8,9.
The mHB has been (pharmacologically) validated for both mice and rats1,6. A wide range of behaviors can be measured, such as avoidance behavior, risk assessment, arousal, exploration, locomotor activity, habituation, social affinity and cognition2,8-10. Additionally, the mHB can be combined with a food intake inhibition test, as well as novel object recognition test10,11. Finally, the mHB can also be used to perform social stress experiments by testing socially defeated animals while placing a dominant individual in the group compartment12,13. This protocol for mice and rats will give an overview of the multiple applications of the mHB.
Protocol
NOTE: The experiments have been approved by the Animal Experiments Committee of the University Medical Center Utrecht and Utrecht University, The Netherlands. Furthermore, the animal experiments followed the Principles of laboratory animal care and refer to the Guidelines for the Care and Use of Mammals in Neuroscience and Behavioural Research.25
1. Experimental Set-up
NOTE: The standard mHB apparatus consists of a grey PVC experimental box (100 x 50 x 50 cm) separated from an additional compartment (50 x 50 x 50 cm) in which the group mates of the experimental animal can be placed during the testing period by a transparent, perforated partition1. If the presence of group mates is unwanted or if individually housed animals are tested, replace the transparent partition by a partition made of grey PVC (Figure 1; see also Ohl et al. (2001)1). The mHB (with different measurements) used for cognitive testing is described in section 5 of the protocol.
- Place the board (60 x 20 x 0.5 cm; made of grey PVC) in the middle of the box.
NOTE: The board can contain 20 cylinders (ᴓ 1.5 cm)14 staggered in two lines or 23 cylinders (ᴓ 3 cm)8 staggered in three lines. - Divide the area around the board by black lines into 10 rectangles (20 x 15 cm) and 2 squares (20 x 20 cm).
- Position a stage light above the board to create a larger contrast in light intensity between the board (representing an unprotected area comparable with the center of an open field or the light compartment of a light-dark transition test) and the box (protected area) in order to increase the aversive character of the board4,8.
- House the animals under a 12 hr reversed day-night cycle (e.g., lights off at 7:00 AM and lights on at 7:00 PM).
NOTE: However, the mHB can also be used under the conventional light schedule (see discussion on potential shortcomings)1,6. - Perform the behavioral testing in the most active phase of the animals (e.g., between 10:00 AM and 2:00 PM)4,15.
- Maintain a habituation period of 2 weeks after arrival of the animals in the facilities. During this period have the same person performing the behavioral experiment handle the animals four times a week and include all handling procedures to be performed during actual testing. Handle the animals exclusively during the time of the day when the animals will be exposed to testing later on.
- Record the experiments for data storage on video and in order to optimize the results and to reduce the inter observer variability, practice the behavioral scoring using a video recording of previous experiments2. Make sure to standardize all actions and procedures executed by the observer.
2. Behavioral Testing – Without the Presence of Group Mates
- Perform behavioral testing in the room the animals are regularly housed in (to avoid possible effects of transportation to a testing location) and install all testing equipment before arrival of the animals in the facilities (to habituate the animals to the presence of the equipment).
- Pick up the animal by the base of the tail from its home cage and directly place it in the mHB.
- Place each animal in the apparatus in the same corner facing the wall (as indicated in Figure 1).
- Allow the animal to freely explore the mHB for a period of time (often 5 min1,6,16-18).
- Have an experienced observer live score the behavioral parameters using behavioral scoring software. Use the parameters listed in Table 1.
NOTE: Some behavioral parameters (e.g., motor- and exploratory behavior) might be scored automatically as e.g., discussed by Henry et al. (2010)19 after necessary adjustment of the mHB. - Clean the apparatus with tap water and a paper towel after every trial in order to avoid a bias based on olfactory cues.
NOTE: Possible testing-order effects when testing socially housed animals should be kept in mind17,20.
3. Behavioral Testing – in the Presence of Group Mates
- In the case of group housing, measure the interaction with the experimental animal and its cage mates during testing.
- Place the group mates in the group compartment before testing of the experimental animal to allow for habituation (mainly 10-30 min1,12).
NOTE: Testing under social-stress conditions is possible by placing a dominant cage-mate in the group compartment when testing a socially defeated individual13. - Place the experimental animal in the test compartment and allow it to freely explore the mHB as described in section 2.
NOTE: Possible testing-order effects when testing socially housed animals should be kept in mind17,20. - Have an experienced observer live score the behavioral parameters using behavioral scoring software. Use the parameters listed in Table 1.
- Clean the apparatus with tap water and a paper towel after every trial in order to avoid a bias based on olfactory cues.
- Place the group mates in the group compartment before testing of the experimental animal to allow for habituation (mainly 10-30 min1,12).
4. Novel Object Recognition and Food Intake Inhibition
- Familiarize the animals with an object (for instance a dice or a food pellet) in their home cage 2 days before the experiment.
- Place the familiarized object in the apparatus 2 cm apart from a novel object (for instance a bolt or unfamiliar food) in the corner across from the starting point.
- Measure the time the animal takes to approach the novel and familiar object/food. Use the parameters in Table 1.
- Clean the apparatus with tap water and a paper towel after every trial in order to avoid a bias based on olfactory cues.
5. Cognitive Testing
- Place a smaller board (35 x 22 x 1 cm) with 10 cylinders in the middle of the box (Figure 1) for testing rats3,22. Reduce the box in size to 50 x 50 cm for testing mice21 by inserting a partition made of grey PVC.
- Scent all cylinders with a flavor animals are attracted to (e.g., vanilla) and bait all with a reward (e.g., a piece of almond, a highly palatable reward for mice and rats) beneath a grid so the animals cannot remove it.
- Cue cylinders (often three) with a colored ring (contrasting with the grey PVC) and bait them with a removable reward (e.g., 0.05 g piece of almond).
- Familiarize the animals with the reward daily in the 2 days before the experiment in their home cage by offering it with tweezers and making sure that the animals eat it.
- Have an experienced observer live score the behavioral parameters using behavioral scoring software. Measure the parameters listed in Table 2 in addition to the behavioral parameters mentioned in section 2 (Table 1) with the exception of the parameters related to object recognition or food intake inhibition.
- Stage 1: With each animal, perform four trials daily with a constant inter-trial interval (e.g., 30-60 min) until a constant time to finish a trial is reached (i.e., when all three almond pieces have been collected).
- Stage 2: Cue and bait three different cylinders and place the animals in the setup for four trials to test the reversal learning ability.
- Clean the apparatus with tap water and a paper towel after every trial in order to avoid a bias based on olfactory cues.
Results
The large amount of parameters that can be measured in the mHB make this setup especially suitable to measure numerous behavioral dimensions. One example is the identification of behavioral adaptation to a novel environment by repeated exposure to the test. Salomons et al. (2010) studied the habituation of two inbred strains of mice (BALB/cJ and 129P3/J) to the mHB under two different light conditions (red light: contrast between box and board: 45 lux vs. white light: contrast between box and board: 115 lux (see also protocol section 1.3))4. BALC/cJ mice show a decreasing (habituating) latency until the first board entry (see Table 1) under red light conditions as shown in Figure 2A. Contrastingly, 129P3/J mice show no sign of habituation over trials. Figure 2B shows the experiment under white light conditions. BALB/cJ mice show again a decreasing latency to the first board entry over trials albeit that the animals show a slower habituation pattern compared to the red light condition. 129P3/J mice not only show again impaired habituation, but also a trend towards sensitization under the white light condition. Similarly, in a study by Salomons (2012) 129P2/OlaHsd mice showed an impaired behavioral flexibility in response to novelty compared to BALB/cOlaHsd mice23. The difference in habituation ability thus becomes apparent between two inbred strains of mice when tested in the mHB4.
The cognitive version of the mHB can for instance be used to measure cognitive impairments in mice. Van der Kooij et al. (2010) used this set-up to measure the cognitive functioning of C57BL/6J mice with mild cerebral hypoxia-ischemia (45 min of hypoxia; HI-45), severe HI (75 min of hypoxia; HI-75) and sham-control mice9. The ability to complete the trials (i.e., find the baited holes within 5 min) is shown in Figure 3A. The number of short-term memory mistakes (revisits to a baited hole), long-term memory mistakes (visits to a non-baited hole) and omission errors (no visit to a baited hole) are shown in Figure 3B-D respectively.
In order to confirm that the HI-45 group had no cognitive impairment, this group was tested against the sham-controls in a reversal task. The three baited holes were appointed to three different cylinders and the animals were tested for 4 trials. The reversal effect becomes apparent when comparing the last trial of the first stage with the first trial of the reversal stage. The duration to complete the four reversal trials gives an indication on the overall performance. Figure 4 shows the latency to complete the trial for both groups and a clear overall treatment effect is evident. This means that in the reversal task there is indeed an impairment in cognitive flexibility (re-learning) in the HI-45 group which became detectable using the mHB9.
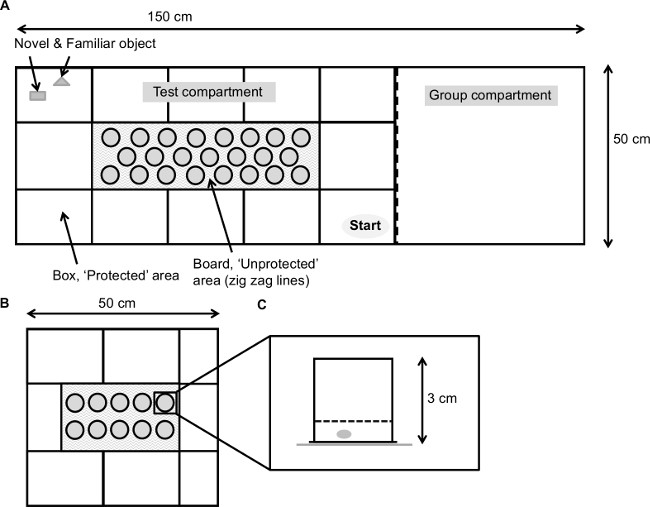
Figure 1. Schematic overview of the modified hole board. (A) The set-up consists of a test compartment (box) with in the middle the (unprotected) board indicated with zigzag lines and the group compartment.  = novel object,
  = familiar object,
  = starting point. (B) Schematic overview of the cognitive version of the modified hole board for mice. (C) Side view of a cylinder as used in the cognitive version of the modified hole board. A piece of almond is placed beneath the grid of all cylinders. Please click here to view a larger version of this figure.
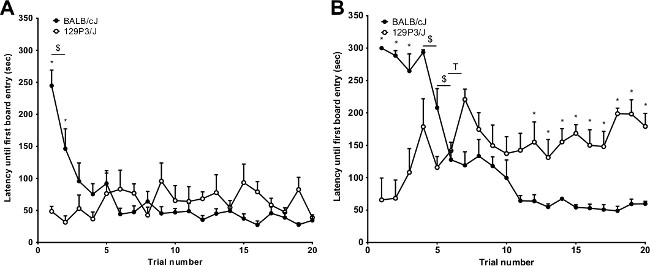
Figure 2. Red light or white light conditions. (A) Latency until first board entry (mean + SEM) of BALB/cJ and 123P3/J mice measured under red light conditions (box 0-5 lux and board 45 lux). A repeated measures ANOVA with Huyn-Feldt adjustment revealed a strain (P = 0.025), trial (P <0.001) and trial x strain interaction (P <0.001) effect. Post hoc analyses: between strains: * = P <0.0026, between two consecutive trials: $ = P <0.0026 (BALB/cJ). (B) The latency of the first board entry (mean + SEM) under white light conditions (box 0-5 lux and board 120 lux). A repeated measures ANOVA with Huyn-Feldt adjustment revealed a strain (P = 0.031), trial (P <0.001) and trial x strain interaction (P <0.001) effect. Post hoc analyses: between strains: * = P <0.0026, between two consecutive trials: $ = P <0.0026 (BALB/cJ) and T = P <0.0026 (123P3/J). This figure has been modified from Salomons et al. 20104. Please click here to view a larger version of this figure.
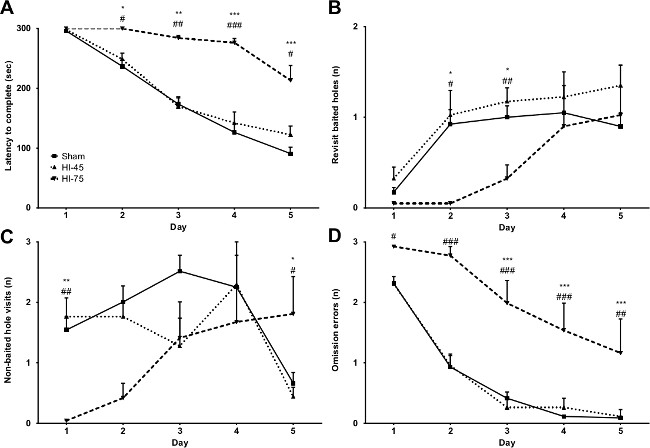
Figure 3. Cognitive testing in the mHB (stage 1). All figures show mean + SEM. (A) The latency to complete the trial (sec) of the sham-control mice, HI-45 and HI-75. (B) Number of omission errors, (C) Non-baited hole visits and (D) Revisits for baited holes. * = P <0.05, ** = P <0.01, *** = P <0.001 sham vs. HI-75, # = P <0.05, ## = P <0.01, ### = P <0.001 HI-45 vs. HI-75. This figure has been modified from Van der Kooij et al. 20109. Please click here to view a larger version of this figure.

Figure 4. Reversal learning task (stage 2). Latency to complete a trial (sec) in the reversal learning task (mean + SEM). Trial effects: # = P <0.05, ## = P <0.01 (first trial reversal task vs. previous trial). Treatment effect: * = P <0.05, ** = P <0.01 (HI-45 vs. sham). This figure has been modified from Van der Kooij et al. 20109.
| System | Activity | Measured parameter |
| Avoidance | Board entry | Frequency, latency (s), duration (%) and average duration (s) on the board |
| Risk assessment | Stretched attends | Frequency and latency (s) of stretched body postures (including hind limbs) |
| Arousal | Grooming | Frequency, latency (s), duration (%) and average duration (s) self-grooming |
| Defecation | Frequency and latency (s) of boli produced | |
| Urination | Frequency and latency (s) of urinations | |
| Directed exploration | Hole visits | Frequency and latency (s) of cylinder visits |
| Novel object exploration | Frequency, latency (s), duration (%) and average duration (s) exploring the novel object | |
| Undirected exploration | Rearing box | Frequency and latency (s) of rearings in the box (front paws not touching the wall) |
| Rearing board | Frequency and latency (s) of rearings on the board | |
| Hole exploration | Frequency and latency (s) of cylinder explorations | |
| Memory | Familiar object exploration | Frequency, latency (s), duration (%) and average duration (s) exploring the familiar object |
| Social affinity | Group interaction | Frequency, latency (s), duration (%) and average duration (s) interacting with the group compartment |
| Locomotor activity | Line crossing | Frequency and latency (s) of line crossings |
Table 1: List of behavioral parameters
| Memory system | Parameter | Description |
| Long-term memory | Wrong choice | Visit to non-baited cylinder; nose below the rim |
| Omission error | Omission of a baited cylinder | No visit to a baited cylinder |
| Short-term memory | Repeated choice | Revisit to baited cylinder; nose below the rim |
| Overall performance | Total trial time | Time until all baited cylinders have been visited |
Table 2: List of cognitive parameters
Discussion
The mHB paradigm can be used to measure multiple dimensions of unconditioned behavior. The protocol can be slightly altered depending on the purpose of the experiment. In this protocol we discuss the settings, times and measurements usually used in our lab. However, slight deviations to the measurements of the apparatus have been used in the past and also the amount of cylinders on the board may vary3. Often studies employ a testing time of 5 min per trial, but other testing times can also be appropriate, i.e., ending the test as soon as a cognitive trial has been completed successfully or in extending testing time if animals are extremely anxious or physically impaired. The time of day of testing was selected to be under red light condition since rodents are nocturnal animals and are most active in the early dark phase. Roedel et al. (2006) shows the effects of light or dark phase testing on behavioral and cognitive performance in DBA mice in the mHB16. Other studies have performed mHB experiments under white light conditions1,6, however, it should be noted that testing under white light conditions can induce behavioral inhibition and cognitive disruption (as shown in DBA mice)16.
Tables 1 and 2 contain a large amount of behavioral parameters to be measured. During data analysis this can lead to some parameters indicating a significant increase of for instance ‘latency to first entry board’, but not in other parameters of the same motivational system (in this case ‘Avoidance’). In some cases this may lead to inconclusive results. Guilloux et al. (2011) introduced integrated behavioral z-scores to the behavioral phenotyping in mice24. With the use of integrated behavioral z-scores the multiple parameters can be combined to a single z-score describing a particular motivational system. The subsequent z-scores can in their turn be more easily compared across behavioral tests and experiments.
Besides the described features of this paradigm, a more profound use became apparent in the study of Salomons et al. (2012). The habituation to novelty of two mouse strains (BALC/cJ and 129P3/J) in the mHB was compared, exhibiting a difference in behavioral flexibility indicating a non-adaptive behavioral profile of the 129P3/J mice4, mirroring impaired adaptive capacities and probably even pathological anxiety.
Concluding, the mHB allows measurement of multiple behavioral dimensions in a single experiment. By combining features from a traditional hole board and open field test, unconditioned behavior, social interaction, cognition and adaptive capacities, i.e., welfare can be investigated. This test can for example be used to evaluate behavioral changes due to pharmacological- and/or genetic manipulations, selective breeding and adaptive capacities. In comparison to classical test batteries, the number of animals needed is clearly reduced and stress experienced by the animals during testing is extremely low.
Disclosures
The authors have nothing to disclose.
Acknowledgements
The authors would like to acknowledge the work of Annemarie Baars and José Lozeman-van ‘t Klooster in performing, assisting and teaching experiments using the mHB set-up.
Materials
| Name | Company | Catalog Number | Comments |
|---|---|---|---|
| Cognitive mHB apparatus | The box for cognitive testing is 50x50 cm by inserting a partition made of grey PVC in the standard mHB. A smaller board (35x22x1 cm) with 10 cylinders is placed in the middle of the box. All cylinders are scented with a flavor animals are attracted to (e.g. vanilla) and all are baited with a reward (e.g. a piece of almond) beneath a grid so the animals cannot remove it. Cylinders (often three) are cued with a colored ring (contrasting with the grey PVC) and are baited with a removable reward (e.g. 0.05 g piece of almond). | ||
| Vanilla flavor | Vanilla flavor dissolved in water (0.02%) | ||
| Camera | Camera that generates sufficient quality output to rescore the behavior from video. | ||
| Stage light | A theather light that allows to adjust the light intensity and the dimensions of the surface that is lit. | ||
| Behavioral scoring software | Behavioral scoring software. |
References
- Ohl, F., Holsboer, F., Landgraf, R. The modified hole board as a differential screen for behavior in rodents. Behav. Res. Methods Instrum. Comput. 33 (3), 392-397 (2001).
- Ohl, F. Anxiety and Anxiolytic Drugs. Holsboer, F., Ströhle, A. 169, Springer. 35-69 (2005).
- Staay, F. J., Gieling, E. T., Pinzon, N. E., Nordquist, R. E., Ohl, F. The appetitively motivated 'cognitive' holeboard: A family of complex spatial discrimination tasks for assessing learning and memory. Neurosci. Biobehav. Rev. 36 (1), 379-403 (2012).
- Salomons, A. R., van Luijk, J. A., Reinders, N. R., Kirchhoff, S., Arndt, S. S., Ohl, F. Identifying emotional adaptation: Behavioural habituation to novelty and immediate early gene expression in two inbred mouse strains. Genes Brain Behav. 9 (1), 1-10 (2010).
- McIlwain, K. L., Merriweather, M. Y., Yuva-Paylor, L. A., Paylor, R. The use of behavioral test batteries: Effects of training history. Physiol. Behav. 73 (5), 705-717 (2001).
- Ohl, F., Sillaber, I., Binder, E., Keck, M. E., Holsboer, F. Differential analysis of behavior and diazepam-induced alterations in C57BL/6N and BALB/c mice using the modified hole board test. J. Psychiatr. Res. 35 (3), 147-154 (2001).
- Hanell, A., Marklund, N. Structured evaluation of rodent behavioral tests used in drug discovery research. Front Behav Neurosci. 8 (252), (2014).
- Laarakker, M. C., van Lith, H. A., Ohl, F. Behavioral characterization of A/J and C57BL/6J mice using a multidimensional test: Association between blood plasma and brain magnesium-ion concentration with anxiety. Physiol. Behav. 102 (2), 205-219 (2011).
- Kooij, M. A., Ohl, F., Arndt, S. S., Kavelaars, A., van Bel, F., Heijnen, C. J. Mild neonatal hypoxia-ischemia induces long-term motor- and cognitive impairments in mice. Brain. Behav. Immun. 24 (5), 850-856 (2010).
- Boleij, H., Salomons, A. R., van Sprundel, M., Arndt, S. S., Ohl, F. Not all mice are equal: Welfare implications of behavioural habituation profiles in four 129 mouse substrains. PLoS One. 7 (8), e42544(2012).
- Enard, W., et al. A humanized version of Foxp2 affects cortico-basal ganglia circuits in mice. Cell. 137 (5), 961-971 (2009).
- Bartolomucci, A., Fuchs, E., Koolhaas, J. M., Ohl, F. Acute and chronic social defeat: Stress protocols and behavioral testing. Mood and anxiety related phenotypes in mice. Gould, T. D. 42, Humana Press. 261-275 (2010).
- Erhardt, A., et al. Consequences of chronic social stress on behaviour and vasopressin gene expression in the PVN of DBA/2OlaHsd mice-influence of treatment with the CRHR1-antagonist R121919/NBI 30775. J. Psychopharmacol. 23 (1), 31-39 (2009).
- Salomons, A. R., Kortleve, T., Reinders, N. R., Kirchhoff, S., Arndt, S. S., Ohl, F. Susceptibility of a potential animal model for pathological anxiety to chronic mild stress. Behav. Brain Res. 209 (2), 241-248 (2010).
- Kooij, M. A., et al. NF-κB inhibition after neonatal cerebral hypoxia–ischemia improves long-term motor and cognitive outcome in rats. Neurobiol. Dis. 38 (2), 266-272 (2010).
- Roedel, A., Storch, C., Holsboer, F., Ohl, F. Effects of light or dark phase testing on behavioural and cognitive performance in DBA mice. Lab. Anim. 40 (4), 371-381 (2006).
- Arndt, S. S., et al. Individual housing of mice--impact on behaviour and stress responses. Physiol. Behav. 97 (3-4), 385-393 (2009).
- Salomons, A. R., Arndt, S. S., Lavrijsen, M., Kirchhoff, S., Ohl, F. Expression of CRFR1 and Glu5R mRNA in different brain areas following repeated testing in mice that differ in habituation behaviour. Behav. Brain Res. 246, 1-9 (2013).
- Henry, B. L., Minassian, A., Young, J. W., Paulus, M. P., Geyer, M. A., Perry, W. Cross-species assessments of motor and exploratory behavior related to bipolar disorder. Neurosci. Biobehav. Rev. 34 (8), 1296-1306 (2010).
- Chesler, E. J., Wilson, S. G., Lariviere, W. R., Rodriguez-Zas, S. L., Mogil, J. S. Identification and ranking of genetic and laboratory environment factors influencing a behavioral trait, thermal nociception, via computational analysis of a large data archive. Neurosci. Biobehav. Rev. 26 (8), 907-923 (2002).
- Ohl, F., Roedel, A., Binder, E., Holsboer, F. Impact of high and low anxiety on cognitive performance in a modified hole board test in C57BL/6 and DBA/2 mice. Eur. J. Neurosci. 17 (1), 128-136 (2003).
- Gordan, M. L., Jungwirth, B., Ohl, F., Kellermann, K., Kochs, E. F., Blobner, M. Evaluation of neurobehavioral deficits following different severities of cerebral ischemia in rats: A comparison between the modified hole board test and the morris water maze test. Behav. Brain Res. 235 (1), 7-20 (2012).
- Salomons, A. R., Arndt, S. S., Ohl, F. Impact of anxiety profiles on cognitive performance in BALB/c and 129P2 mice. Cogn. Affect. Behav. Neurosci. 12 (4), 794-803 (2012).
- Guilloux, J., Seney, M., Edgar, N., Sibille, E. Integrated behavioral z-scoring increases the sensitivity and reliability of behavioral phenotyping in mice: Relevance to emotionality and sex. J. Neurosci. Methods. 197 (1), 21-31 (2011).
- Guide for the Care and Use of Laboratory Animals. , Eighth edition, National Research Council. Washington, D.C.. (2010).
Reprints and Permissions
