A novel methodology is presented to synthesize and program main-chain liquid-crystalline elastomers using commercially available starting monomers. A wide range of thermomechanical properties was tailored by adjusting the amount of crosslinker, while the actuation performance was dependent on the amount of applied strain during programming.
Method Article
Synthesis of Programmable Main-chain Liquid-crystalline Elastomers Using a Two-stage Thiol-acrylate Reaction
In This Article
Summary
Abstract
This study presents a novel two-stage thiol-acrylate Michael addition-photopolymerization (TAMAP) reaction to prepare main-chain liquid-crystalline elastomers (LCEs) with facile control over network structure and programming of an aligned monodomain. Tailored LCE networks were synthesized using routine mixing of commercially available starting materials and pouring monomer solutions into molds to cure. An initial polydomain LCE network is formed via a self-limiting thiol-acrylate Michael-addition reaction. Strain-to-failure and glass transition behavior were investigated as a function of crosslinking monomer, pentaerythritol tetrakis(3-mercaptopropionate) (PETMP). An example non-stoichiometric system of 15 mol% PETMP thiol groups and an excess of 15 mol% acrylate groups was used to demonstrate the robust nature of the material. The LCE formed an aligned and transparent monodomain when stretched, with a maximum failure strain over 600%. Stretched LCE samples were able to demonstrate both stress-driven thermal actuation when held under a constant bias stress or the shape-memory effect when stretched and unloaded. A permanently programmed monodomain was achieved via a second-stage photopolymerization reaction of the excess acrylate groups when the sample was in the stretched state. LCE samples were photo-cured and programmed at 100%, 200%, 300%, and 400% strain, with all samples demonstrating over 90% shape fixity when unloaded. The magnitude of total stress-free actuation increased from 35% to 115% with increased programming strain. Overall, the two-stage TAMAP methodology is presented as a powerful tool to prepare main-chain LCE systems and explore structure-property-performance relationships in these fascinating stimuli-sensitive materials.
Introduction
LCEs are a class of stimuli-responsive polymers that are capable of exhibiting mechanical and optical functionalities due the combination of liquid-crystalline (LC) order and rubber elasticity. These materials can demonstrate extraordinary changes in shape, soft-elasticity behavior, and tunable optical properties in response to a stimulus such as heat or light,1-3 which makes them suitable for many for potential technological applications such as artificial muscles,4,5 sensors,6 and actuators.6,7 LCEs have already been demonstrated in many applications such as micro-grippers for robotics,8 micro-electromechanical systems (MEMS),6,9 optical grating devices,10 tunable apertures,6,11 and microfluidic systems.12
The structural components that give rise to the ordered LC phases are called mesogens. Mesogens are the basis of the LC domains and are typically composed of two or three linearly connected aromatic rings with flexible ends. These moieties can be directly placed within the polymer backbone to create main-chain LCEs or as a side group (i.e., side-on or end-on LCEs).1,13 Main-chain LCEs have generated a lot of interest due to their direct coupling between mesogenic order and polymer backbone conformations.4,14-17 This direct coupling allows main-chain LCEs to exhibit higher degrees of mesogen orientation, mechanical anisotropy, and strain actuation.17
Thermal actuation of LCEs relies on a reversible anisotropic-isotropic transition associated with LC order.2 To program an LCE for actuation, the mesogens must first be oriented along a director to form a monodomain (i.e., anisotropic mesophase) and is often referred to as a liquid single-crystal elastomer. Actuation occurs as an aligned LCE is heated above an isotropic clearing temperature (Ti), which disrupts the order of the mesogens into an isotropic state and drives shape change. A monodomain can be formed temporarily by applying an external stress (i.e., hanging a weight) to a sample, which will align the polymer chains and orient the mesogens in the direction of the stress. Permanent programming of the monodomain can be achieved via a multi-step process, which involves producing a lightly cross-linked gel followed by immediate application of mechanical stress to induce orientation of the mesogens. Once aligned, the reaction is continued to established covalent crosslinks and stabilize the monodomain.18 Other "one pot" alignment techniques can be performed in the presence of electric fields or by surface alignment (i.e., rubbing polyimide on a glass slide) during polymerization; however, these methods are generally limited to thin film samples.1,16
Finkelmann and Bergmann introduced the first synthetic route for the preparation main-chain LCEs using one-step platinum-catalyzed hydrosilylation reaction of a divinyl mesogen and a tetra-functional siloxane crosslinker.15 This method has been widely adapted by many research groups to synthesize main-chain LCEs.17,19,20 Polyesterification and epoxy-based reactions have also been used to make main-chain LCEs.21 All of these methods require high purity starting materials and careful experimental conditions to prevent side reactions.1 Furthermore, these methods rely on random cross-linking of the monomers, resulting in poorly defined network structure. Therefore, it is more difficult to correlate the structure to the properties of LCEs. Recent studies have used click chemistry as a tool to prepare more uniform LCE networks; however, these reactions require custom-synthesized starting mesogenic and thiol monomers, which can be challenging to produce, and have been limited to prepare micron-sized actuators rather than bulk samples.22-24
Current challenges in the LCEs focus on how to develop synthetic methods that are facile, reproducible, and scalable to design tailored LCE networks with programmable monodomains. Recently, our group introduced a two-stage thiol-acrylate Michael addition-photopolymerization (TAMAP) methodology for the first time in mesomorphic systems to prepare nematic main-chain LCEs.25 Two-stage TAMAP reactions form dual-cure polymer networks, where the staging of the polymerization process allows modification of the polymer structure at two distinct time points. This strategy has been adapted in the past few years to design and fabricate other advanced materials, other than mesomorphic systems, such as micro-actuators,26 shape-memory polymers,27,28 and surface wrinkles.29,30 The TAMAP methodology utilizes a non-stoichiometric composition with an excess of acrylate functional groups. The first stage reaction is used to create a polydomain LCEs via the thiol Michael-addition reaction, which is self-limited by the thiol groups. This is an intermediate LCE network that would be capable of mesogenic domain orientation by applying mechanical stress. The polydomain resulting from the first-stage Michael-addition reaction is indefinitely stable and the alignment of the monodomain does not need to occur immediately after the reaction has completed. The second-stage photopolymerization reaction between excess acrylate groups is used to permanently fix an aligned monodomain and program the LCE for reversible and stress-free (i.e., "hands free") actuation. The purpose of this study is to explore and demonstrate the robust nature of the TAMAP reaction to prepare main-chain LCEs by investigating the influence of crosslinking density and programed strain on the thermomechanics of the LCE systems. We demonstrate a wide range of thermomechanical properties and actuation performance that are achievable using this reaction.
Protocol
1. Preparation of Liquid Crystalline Elastomers LCEs
- Add 4 g of 4-bis-[4-(3-acryloyloxypropypropyloxy) benzoyloxy]-2-methylbenzene (RM257) into a 30 ml vial. RM257 is a di-acrylate mesogen and is received as a powder. Dissolve RM257 by adding 40 wt% (i.e., 1.6 g) of toluene and heat to 80 °C on a hot plate. This process typically takes less than 5 min to dissolve the RM257 into a solution.
Note: Other solvents can be used to dissolve the RM257, such as dichloromethane (DCM), chloroform, and dimethylformamide; however, toluene was chosen because it allows the monomers to cure at RT without having the solvent evaporate quickly during reaction, while DCM and chloroform could evaporate quickly at RT before the Michael-addition reaction is completed. Dimethylformamide can dissolve RM257 immediately without heating, but requires very high temperatures to remove the solvent (~ 150 °C). Kamal and Park used a combination of DCM and a liquid crystal, CB5, to dissolve RM257.31 - Cool the solution to RT. Add 0.217 g of pentaerythritol tetrakis(3-mercaptopropionate) (PETMP), a tetra-functional thiol crosslinking monomer, and 0.9157 g of 2,2-(ethylenedioxy) diethanethiol (EDDET), a di-thiol monomer. The molar ratio of thiol functional groups between PETMP and EDDET is 15:85. This ratio will be referred to as 15 mol% PETMP throughout the study.
Note: If the RM257 recrystallizes during this process, temporarily place the vial back onto the 80 °C hot plate until the monomer returns to solution. Cool the solution to RT before proceeding to the next steps. - Dissolve 0.0257 g of (2-hydroxyethoxy)-2-methylpropiophenone (HHMP) into the solution. HHMP is a photoinitiator used to enable the second-stage photopolymerization reaction. This step can be skipped if the second-stage reaction will not be utilized.
- Prepare a separate solution of a catalyst by diluting dipropylamine (DPA) with toluene at a ratio of 1:50. Add 0.568 g of diluted catalyst solution to the monomer solution and mix vigorously on a Vortex mixer. This corresponds to 1 mol% of catalyst with respect to the thiol functional groups.
Note: Adding undiluted catalyst, such as DPA, to the solution will likely result in extremely rapid localized polymerization and will prevent manipulation of the polymer solution into the desired mold detailed in the next steps. - Place the monomer solution in a vacuum chamber for 1 min at 508 mmHg to remove any air bubbles caused by mixing. Perform this step immediately after mixing.
- Immediately transfer the solution into the desired mold or inject the solution between two glass slides. Molds should be manufactured from HDPE. The molds do not need to be covered, as the Michael-addition reaction is relatively insensitive to oxygen inhibition.
- Allow the reaction to proceed for at least 12 hr at RT. The solution will begin to gel within the first 30 min.
- Place samples in a vacuum chamber at 80 °C and 508 mmHg for 24 hr to evaporate the toluene. Once completed, the samples should have a glossy white and opaque appearance at RT.
- Repeat the procedure to tailor the ratio of tetra-functional to di-functional thiol monomers in step 1.2 with ratios of 25:75 50:50, and 100:0, respectively. A detailed table of the chemical formulations used for this study is shown in Table 1.
2. Kinetics Study of Two-stage Reaction with Real-time Fourier Transform Infrared
- Equip a spectrometer with a MCT/B detector and XT-KBr beam splitter.
- Prepare a mixture using the protocol outlined above in the Preparation of LCE section using 0.5 mol% of catalyst with respect to thiol functional groups and 0.5 wt% of photoinitiator. Two initiators were tested separately, 2-2-dimethoxy-2-phenylacetophenone (DMPA) and HHMP. DMPA is a more commonly used initiator, while HHMP is more stable at elevated temperatures.
- Place one drop of LCE mixture between NaCl crystals immediately after mixing using a glass pipette.
- Record spectra at a 2.92 sec sampling interval rate.
- Monitor the conversion of the thiol groups using a peak height profile with the S-H absorption peak at 2,571 cm-1 with a baseline of 2,614 - 2,527 cm-1.
- Monitor the conversion of the acrylate groups using a peak height profile with the C=C absorption peak at 810 cm-1 with a baseline of 829 - 781 cm-1.
- Allow the reaction to proceed under FTIR at RT until the thiol peak height plateaus, showing 100% conversion of thiol groups.
- Upon complete conversion of thiol group, turn on a 365-nm light source equipped with a light guide for 10 min to complete the polymerization of excess acrylates at 350 mW/cm2 intensity, which can be measured by a radiometer photometer.
- Monitor the conversion of the acrylate groups as described in 2.6.
3. Dynamic Mechanical Analysis (DMA)
- Prepare two glass slides by spraying the surfaces of the slides with a hydrophobic surface agent and rubbing the surfaces with a paper towel until dry.
- Stack slides together such that they are separated with a 1 mm spacer. Spacers can be cut by scoring and breaking a separate glass slide to measure approximately 25.4 mm x 5 mm x 1 mm. Clamp slides together using a binder clip at each end.
- Inject monomer solution between the slides using a glass pipette. This requires approximately 1.5 g of the prepared monomer solution.
- Allow the sample to cure for at least 12 hr according to step 1.7. Separate the glass slides and dry the sample according to Step 1.8.
- Using a razor blade or scissors, cut a rectangular test specimens with dimensions of 30 x 10 x 1 mm3.
- Load the sample properly into a DMA machine. Test the sample in tensile mode, with active length measuring 10 to 15 mm. Take care not to over-tighten the grips on the test sample, as 0.1 N-m is often too much torque when tightening the grips.
- Cycle the sample at 0.2% strain at 1 Hz from -50 to 120 °C at a heating rate of 3 °C/min. Set the force track to 125%.
- Measure the glass transition temperature (Tg) at the peak of the tan ∂ curve.
- Measure the isotropic transition temperature (Ti) and the lowest point of the storage modulus curve.
- Measure the rubbery modulus, E'r, at Ti+30 °C.
4. Strain-to-failure Tests
- Prepare an HDPE mold by milling ASTM Type V dog-bone cavities at a depth of 1 mm.
- Using a glass pipette, fill each dog bone cavity until the monomer solution is flush with the top of the mold. Allow the samples to cure and dry according to Steps 1.7 and 1.8.
- Prepare 5 tensile specimens from LCE samples formulated with varying PETMP crosslinker concentrations of 15, 25, 50, and 100 mol%.
- Set two pieces of reflective laser tape 5 to 7 mm apart within the gage length of the specimen.
- Load the specimen into a mechanical tester equipped with a laser extensometer, thermal chamber, and 500 N load cell. Use self-tightening grips to secure the specimens, as specimens will dislodge from wedge grips at high strain values. Align the laser extensometer properly to track the accurate change in length as a function of applied strain.
- Strain the specimens at RT with a displacement rate of 0.2 mm/sec until failure. Define failure by the fracture of the specimen.
- Test additional specimens of 15 mol% PETMP crosslinking agent for strain-to-failure testing as a function of temperature. Test specimens at -40, -30, -20, -10, 0, 10, 22, 40, 60, and 80 °C. Hold all specimens isothermally at the desired test temperature for 10 min prior to testing.
5. Shape Fixity and Actuation Tests
- Prepare an HDPE custom dog-bone mold with gage length of 25 mm and cross-sectional area of 1 mm x 5 mm.
- Prepare a 15 mol% PETMP monomer solution according to Steps 1.1 to 1.5.
- Using a glass pipette, fill each mold cavity until the monomer solution is flush with the top of the mold.
- Allow the samples to cure and dry according to Steps 1.7 and 1.8.
- Set two pieces of reflective laser tape 5-7 mm apart within the gage length of the specimen. Load the sample according step 4.5. Using a permanent marker, mark a dot in the other side of each piece of reflective tape. Record the length between the dots.
- Strain the specimens at RT with a displacement rate of 0.2 mm/sec to 100%, 200%, 300%, or 400% strain.
- While maintaining the desired strain level, expose the sample to a 365 nm UV light source at an intensity of ~10 mW/cm2 for 10 min by holding a UV Lamp approximately 150 mm from the sample.
- Unload the sample and then heat it above Ti to induce actuation. Allow the sample to cool back to RT and record the length between the dots.
- Calculate fixity using the following equation:

where εapplied is programming strain before photo-crosslinking (measured by the laser extensometer) and εfixed is the amount of permanent strain after photo-crosslinking (measured by the change in dot displacement). - Cut a 30 mm length sample from the center portion of the programmed specimen.
- Load the sample properly into a DMA tester. Test the sample in tensile mode, with active length measuring 13 to 15 mm. Make sure not to over-tighten the grips on the test coupon.
- Equilibrate the sample at 120 °C under a preload of 0 N. Cool the sample from 120 to -25 °C at a rate of 3 °C/min. Maintain the pre-force at 0 N for the entire test.
Results
In this study, the two-stage TAMAP reaction cure kinetics were investigated using real-time FTIR. An FTIR series study on the conversion of the thiol and acrylate groups as a function of time to capture both the stages of the reaction was implemented and the normalized results are shown in Figure 2A. The first-stage thiol-acrylate Michael-addition reaction was initiated via base catalysis using DPA as the catalyst and results in the formation of a crosslinked polymer network. At the end of this initial reaction, the thiol functional groups achieve close to 100% conversion within 5 hr of under ambient conditions (~22 °C), while the acrylate groups attained between 70% to 78% conversion under the same conditions. The thiol-acrylate Michael addition 'click' reaction is self-limiting in nature and can generate a step-growth, crosslinked, stable network in a facile manner based on the relative ratios of functional groups present. Subsequently, the second-stage photopolymerization reaction was initiated via exposure to UV irradiation and the remaining unreacted acrylate groups present within the network were further crosslinked to achieve a final acrylate functional group conversion near 100%. Two photoinitiators, HHMP and DMPA and their reaction kinetics were studied within the polymer networks and both were seen to efficiently create crosslinked acrylate networks at the end of second stage polymerization. The conversion of the acrylate groups as a function of the intensity of exposure was also studied and seen to correlate. Overall, it was observed that though a number of variables such as photoinitiators and exposure times could be varied, it was possible to efficiently attain high final conversion of the acrylates at the end of the second stage within 10 min even with relatively low levels of UV intensity (~10-25 mW/cm2 compared to 350 mW/cm2). Figure 2B shows the FTIR absorbance spectra of the two-stage reaction at 3 different time points, 0, 300, and 320 min. At time 0, the initial spectra captures the presence of both thiol and acrylate functional groups in their unreacted state. At the 300 min time point, by the end of the first-stage thiol-Michael addition reaction, the thiol and acrylate peak heights are seen to reduce considerably, thereby implying the reaction between the thiol and acrylate functional groups has progressed to completion. The thiol peak is measured to be close to 100% conversion at this point, whereas the acrylates are seen to be consumed up to 78%. The complete disappearance of the thiol peak is not observed, most likely as the presence of the thiol-Michael adduct from the first-stage reaction is seen to appear and overlap with the thiol peak at 2,571 cm-1. At the end of the second-stage photopolymerization reaction initiated via UV exposure, at the 320 min point, the acrylate conversion is seen to proceed to completion, implying 100% conversion of remaining acrylic double bonds within the network.32
The two-stage TAMAP methodology provides facile control to explore structure-property relationships in LCEs. The influence of crosslinking density on stress-strain behavior is shown in Figure 3A. Modulus and fracture stress were shown to increase with increasing PETMP content, while failure strain increased with decreasing PETMP content (Figure 3B). LCE samples with 50 and 100 mol% PETMP demonstrated initial elastic loading followed by a stress plateau and sharp increase in stress due to chain alignment. In comparison, samples with 15 and 25 mol% PETMP appeared to demonstrate more traditional elastomeric loading followed by an increase of stress due to chain alignment. All specimens tested showed a transition from white opacity to clear transparency when stretched (Figure 3E). It should be noted that all specimens maintained a large degree of permanent strain after fracture and did not recover to their original shape at RT; however, all specimens visually recovered to their original shape upon heating above Ti. The influence of temperature on failure strain was then investigated for the 15 mol% PETMP composition (Figure 3C). In the glassy state, LCE specimens exhibited brittle failure with no appreciable deformation. At the onset of the glass transition, the failure strain increased significantly and followed the general shape of the tan δ function measure by DMA. The failure strain reached a maximum of 650% strain at 10 °C. Representative glass transition behavior for the four LCE network systems is shown in Figure 3D. All of the LCE networks displayed non-traditional behavior in both the storage modulus and tan δ curves. The storage modulus of all LCE networks displayed a distinct minimum that was roughly associated with Ti. The tan δ functions were represented by an initial peak followed by an elevated region that diminished as the sample was heated into the isotropic state (a representative curve can be seen in Figure 3C). For the four LCE systems tested, both Tg and rubbery modulus increased with increasing crosslinking density. A summary of thermo-mechanical properties of the four LCE systems can be seen in Table 2.
LCEs offer the ability to demonstrate both the shape-memory effect and reversible actuation (Figure 4). An unaligned polydomain specimen of 15 mol% PETMP was used to illustrate the different shape-switching pathways that can be programmed into the material (Figure 4A). Reversible stress-driven actuation is demonstrated by the pathway in Figure 4A-B-C. The polydomain specimen is stretched by hanging a 60.6 mN weight to apply a constant stress. This bias stress mechanically orients the mesogens into a transparent monodomain. The specimen contracts when heated to the isotropic state and elongates when cooled below Ti. This process can be repeated indefinitely. The shape-memory effect was exhibited when the bias stress was removed from the specimen when cooled below Ti to 22 °C, which is still 18 °C above Tg. While some elastic recoil was observed, a majority of the strain remained programmed into the material. It should be noted that the mesogens remained in a stable monodomain orientation, and there is a noticeable difference in optical properties within the free end of the sample where the clamp was attached (i.e., the gripped portion remained glossy white). Heating the sample above Ti activated full shape recovery, indicating the shape-memory cycle follows the pathway of Figure 4A-B-D-E. The second-stage photopolymerization reaction can be used to achieve stress-free actuation without the need for a constant bias-stress or programming step between cycles. The temporarily aligned specimen was photo-cured using 365 nm light at ~10 mW/cm2 for 10 min (Figure 4F). The sample experienced minimal elastic recoil when unloaded due to the establishment of covalent crosslinks between the excess of unreacted acrylate groups (Figure 4G). Stress-free actuation was then activated by controlling the temperature about Ti using the reversible pathway in Figure 4G-H; however, it should be noted that the sample does not experience full recovery back to the initial shape of the specimen.
The influence of applied programming strain (i.e., strain during photopolymerization) as function of fixity and actuation for the 15 mol% PETMP system is shown in Figure 5A. All specimens demonstrated fixity values higher than 90%. The amount of programming strain did not noticeably influence the fixity values for the strain range tested in this study. Conversely, actuation strain increased linearly with the amount of programming strain. On average, the actuation strain corresponded to approximately 30% of the programming strain value. Representative curves showing actuation as a function of temperature can be seen in Figure 5B. It should be noted that the actuation strain values in Figure 5A correspond to measurements between RT, 22 °C, and 90 °C, while the behavior shown in Figure 4B was monitored between -25 and 120 °C. This expanded temperature range caused additional actuation strain to be realized: 80%, 102%, 125%, and 207% actuation strain for samples programmed at 100%, 200%, 300%, and 400% strain, respectively.
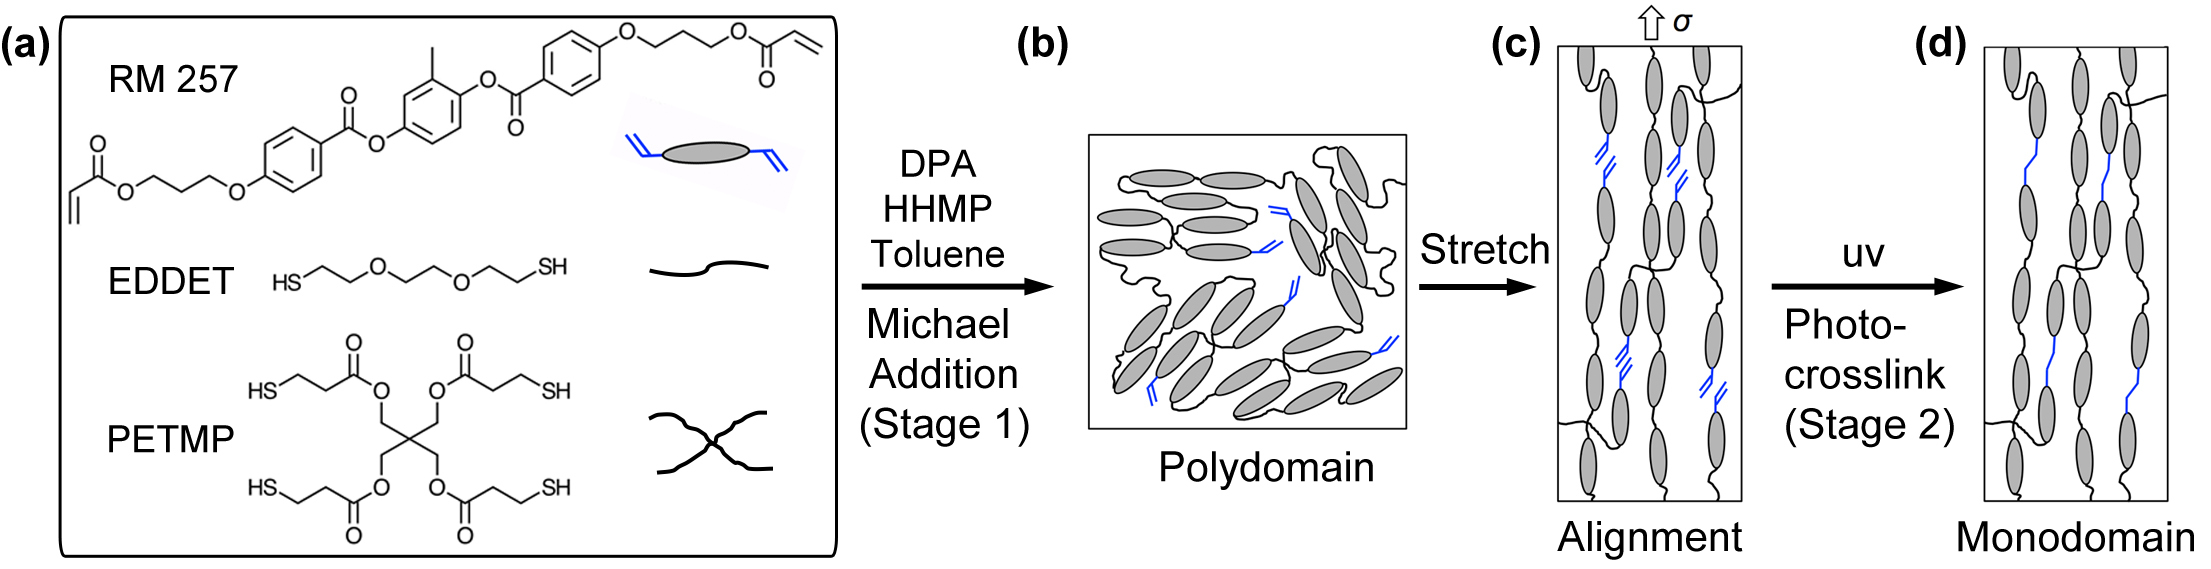
Figure 1. Schematic of Monodomain Programing via a Two-Stage Thiol-Acrylate Reaction. (A) A diacrylate mesogen (1,4-bis-[4-(3-acryloyloxypropyloxy)benzoyloxy]-2-methylbenzene — RM 257), dithiol flexible spacer (2,20-(ethylenedioxy) diethanethiol — EDDET), and tetra-functional thiol crosslinker (pentaerythritol tetrakis(3-mercaptopropionate) — PETMP) were selected as commercially available monomers. Non-equimolar monomer solutions were prepared with an excess of 15 mol% acrylate functional groups and allowed to react via a Michael addition reaction. Dipropyl amine (DPA) and (2-hydroxyethoxy)-2-methylpropiophenone (HHMP) were added as the respective catalyst and photo-initiator to the solutions. (B) Representative polydomain structure forms via Michael addition (first stage) with a uniform cross-link density and latent excess acrylate functional groups. (C) A mechanical stress is applied to the polydomain samples to orient the mesogens into a temporary monodomain. (D) A photopolymerization reaction (second stage) is used to establish crosslinks between the excess acrylate groups, stabilizing the monodomain of the sample. Please click here to view a larger version of this figure.
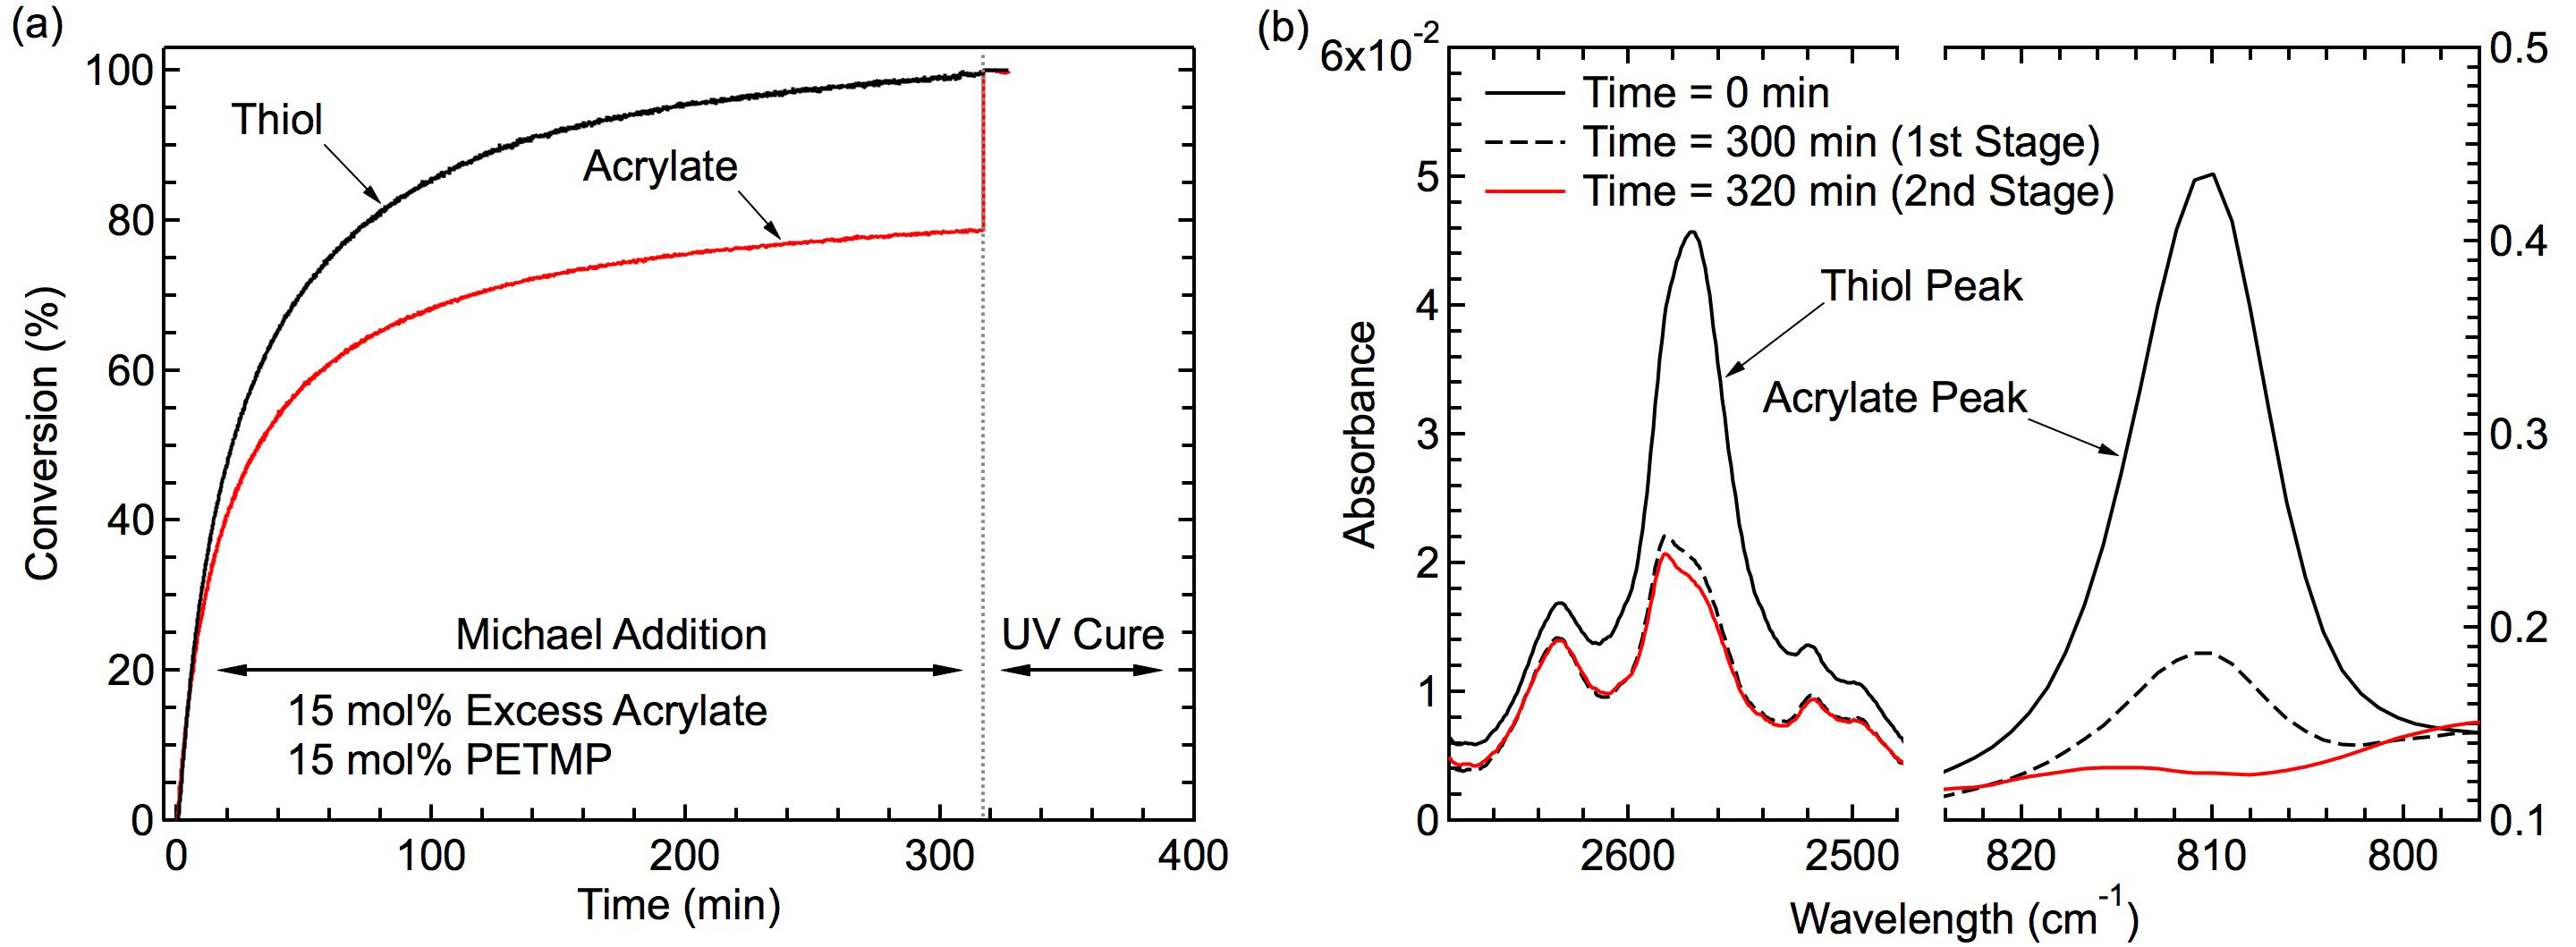
Figure 2. Kinetics Study of Michael Addition Reaction with Real-Time FTIR. (A) Representative two-stage thiol-acrylate reaction kinetics showing conversion as a function of time using DMPA photoinitiator. At the end of first stage, the thiol groups reached near 100% conversion while 22% of acrylate groups were unreacted. At the end of the second stage, unreacted acrylates reached 100% conversion. (B) FTIR absorbance spectra showing the thiol and acrylate conversion before curing at time 0, upon completion of the first stage at 300 min, and upon completion of the second stage at 320 min. Please click here to view a larger version of this figure.
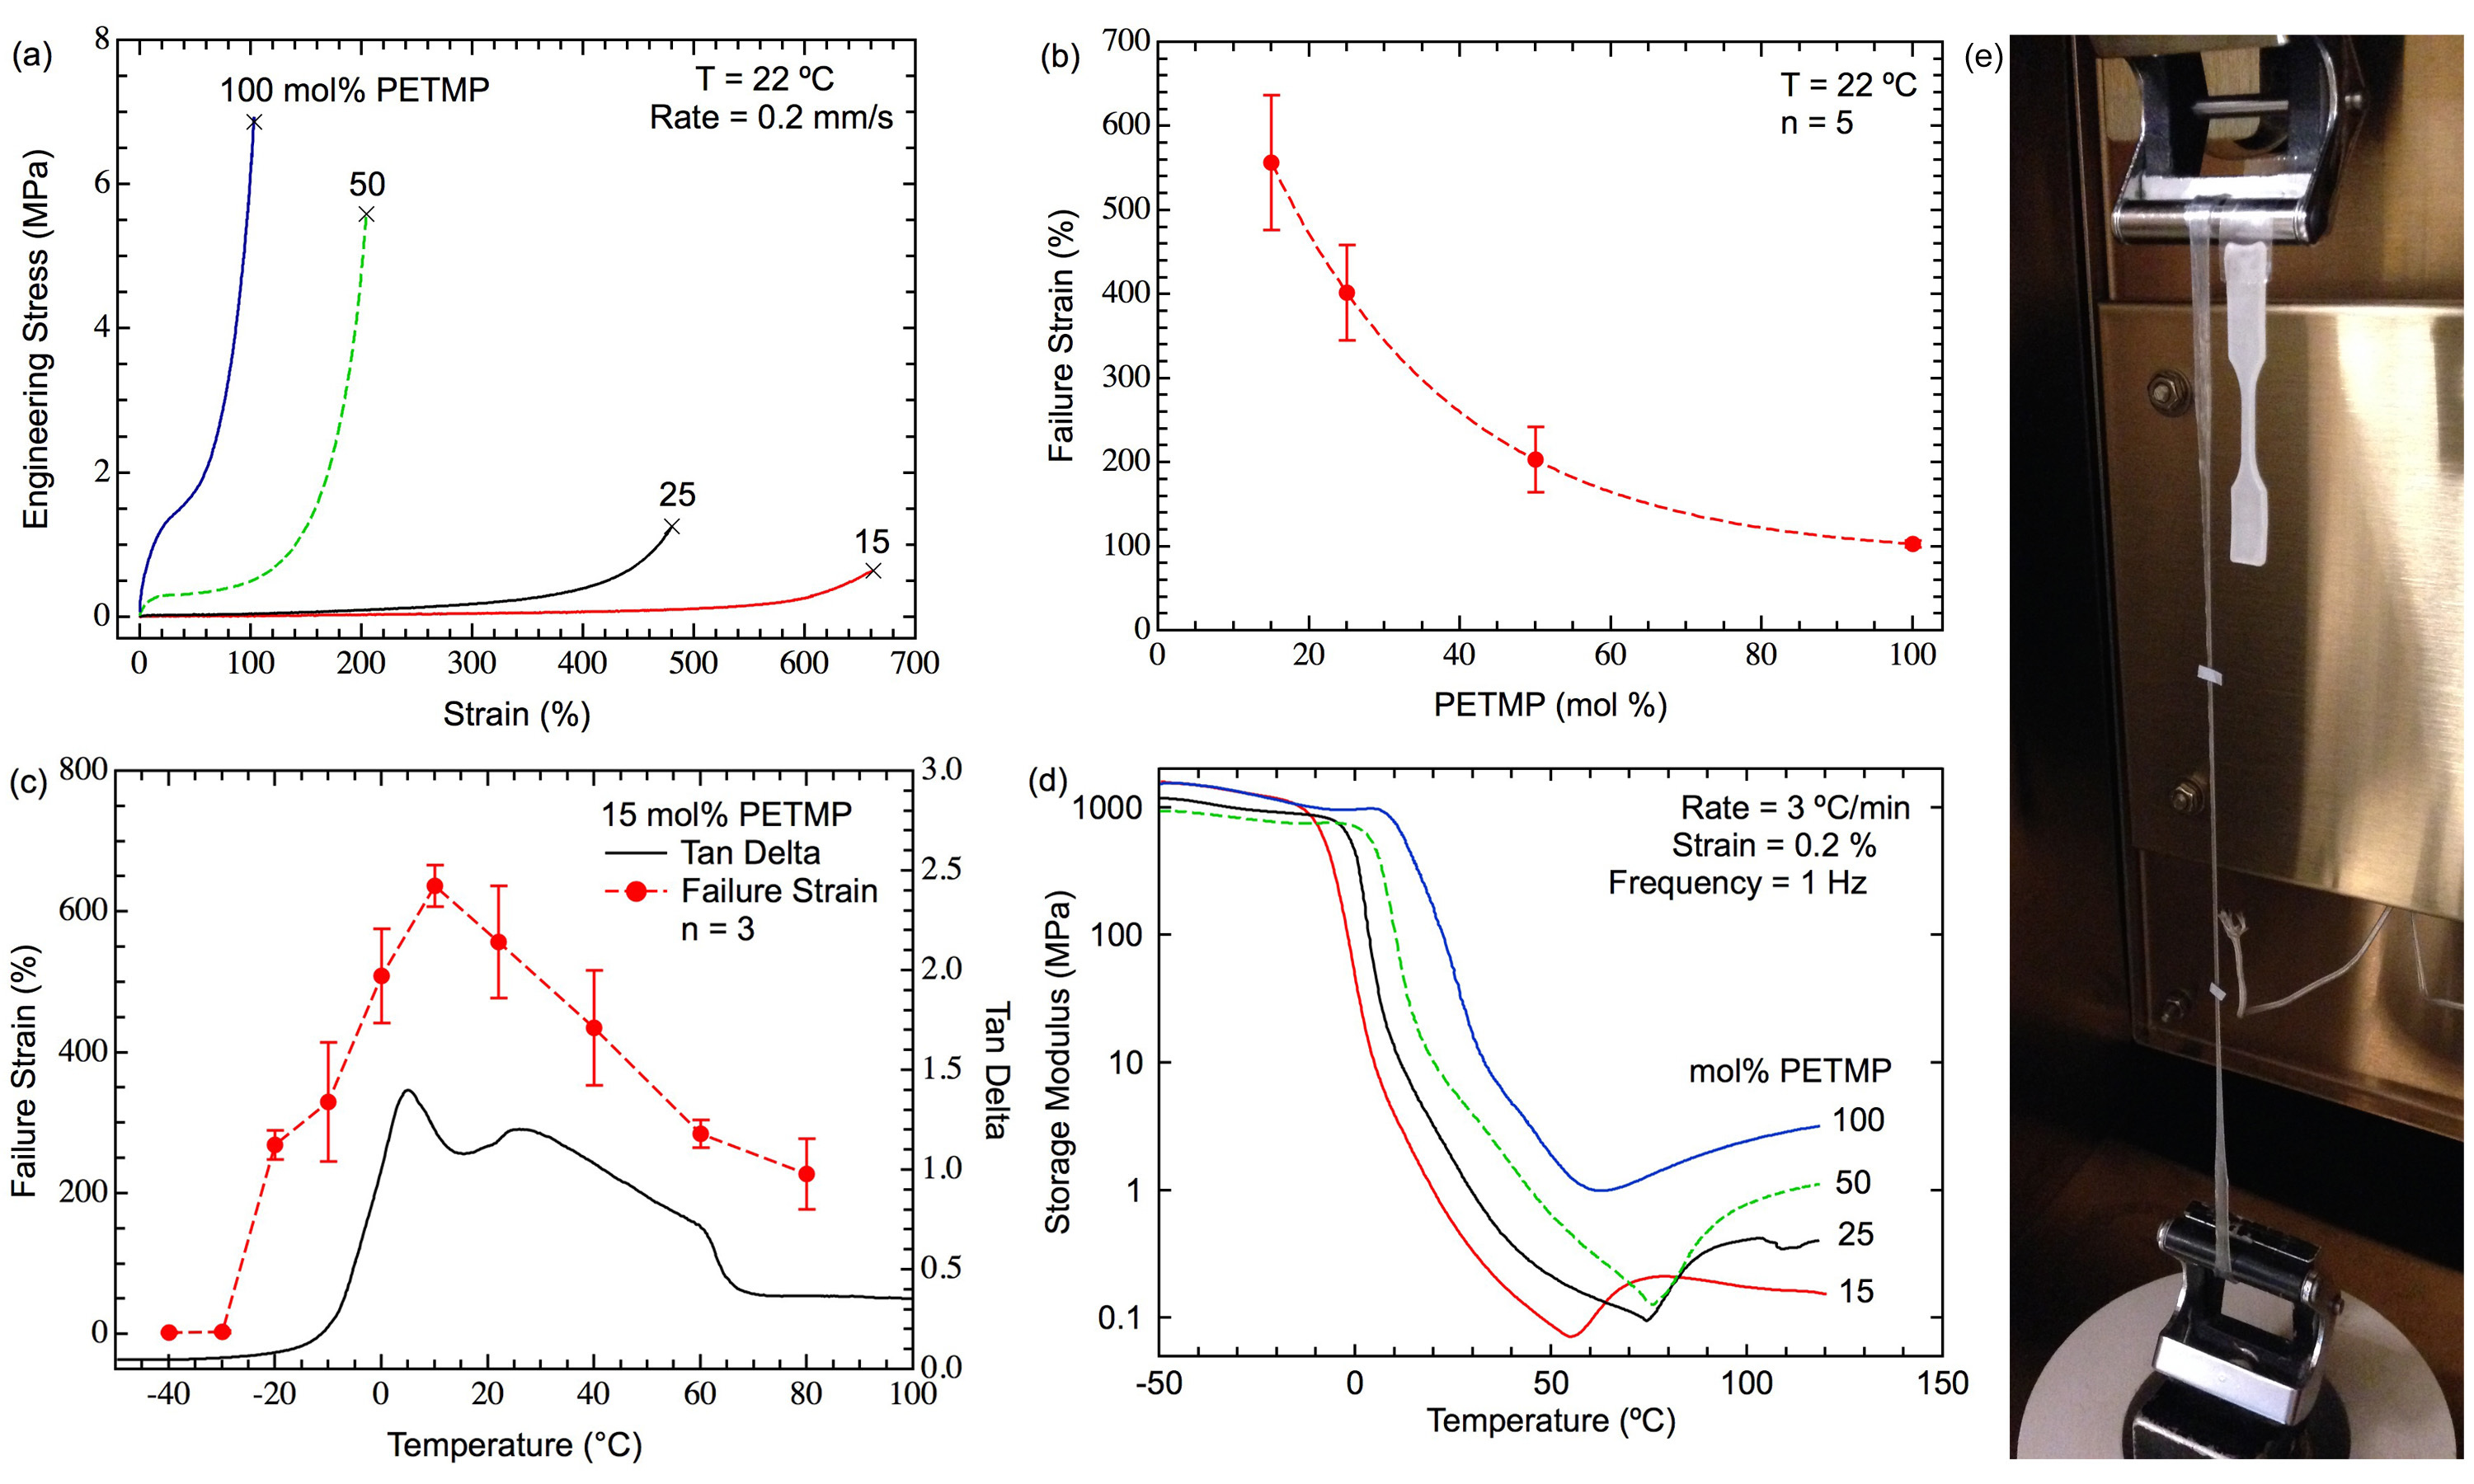
Figure 3. Thermomechanics of TAMAP LCE Systems. (A) Representative strain-to-failure curves of four LCE systems with 15 mol% excess acrylate and varying amount of PETMP crosslinker. (B) Failure strain as a function of PETMP crosslinker. (C) The influence of temperature on failure strain for an LCE system with 15 mol% PETMP. The failure strain is compared alongside the tan ∂ function of the material measured by DMA. (D) Representative glass transition behavior of four LCE systems tested. (E) Image of a stretched LCE specimen with 15 mol% PETMP compared to an untested specimen. Error bars in (B) and (C) represent standard deviation. Please click here to view a larger version of this figure.
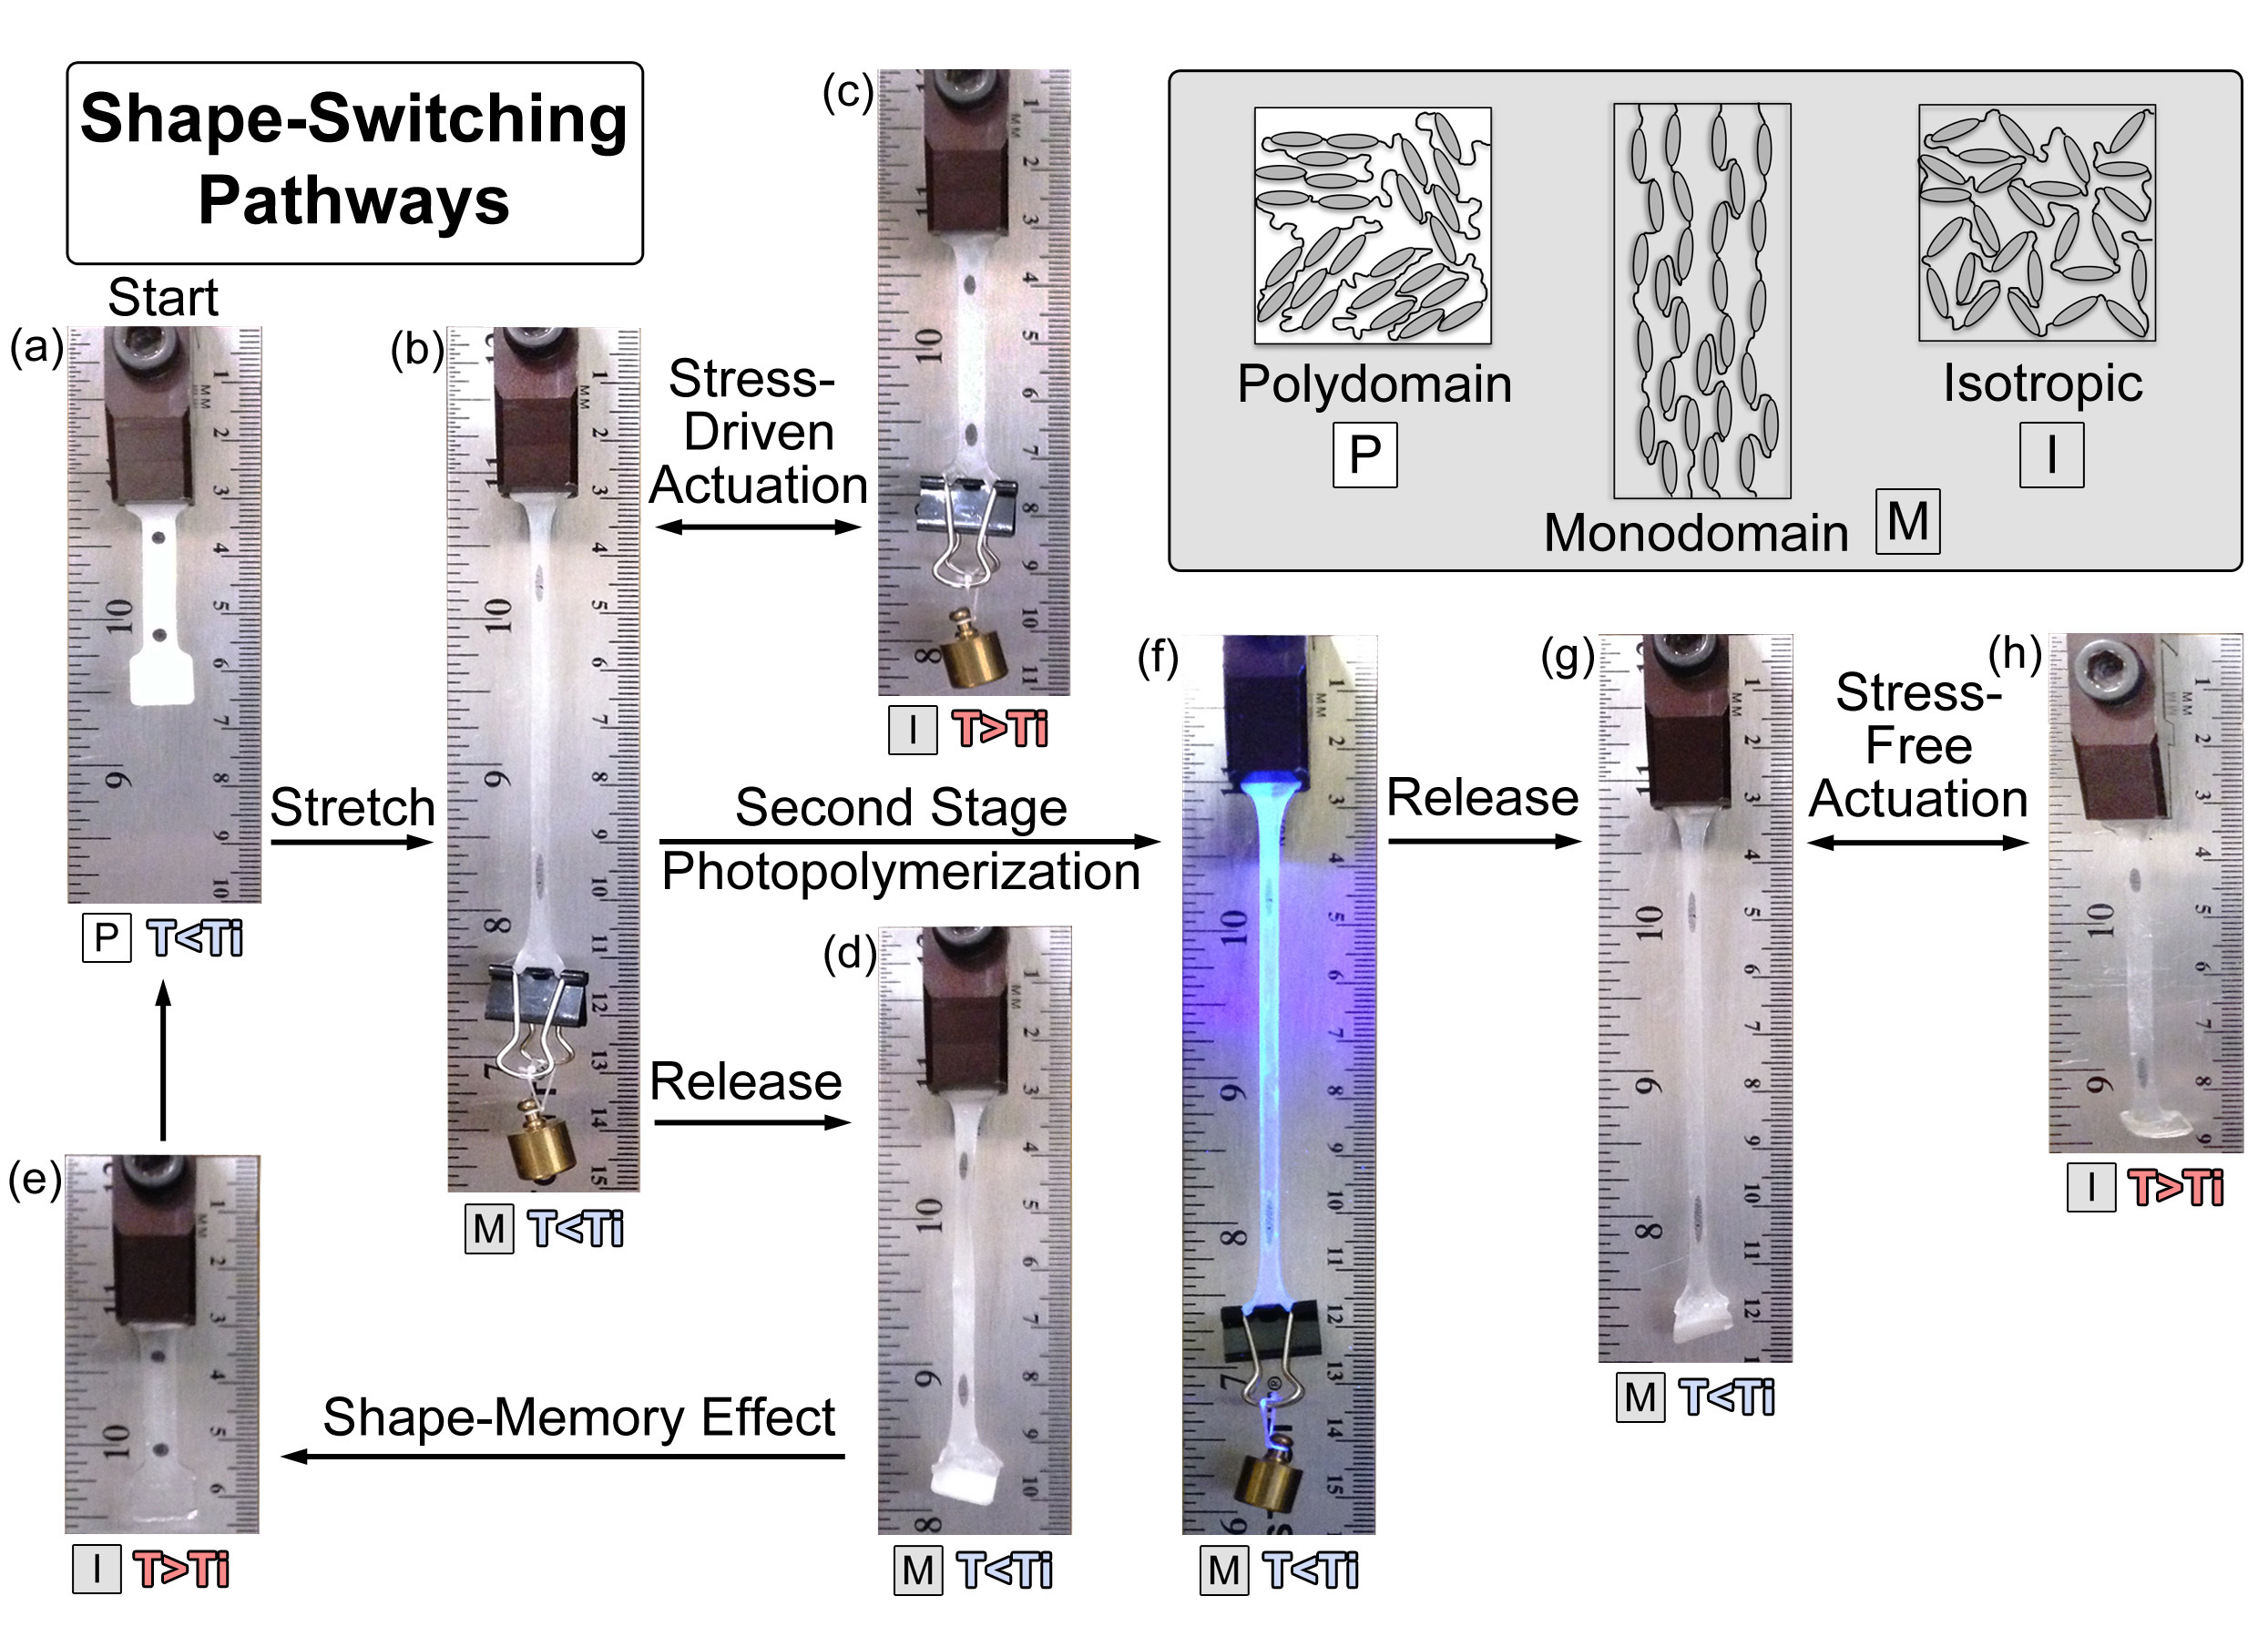
Figure 4. Shape-Switching Pathways in an LCE. This schematic represents several different pathways available to achieve shape switching in LCEs. A custom dog-bone sample of 15 mol% PETMP is used in this demonstration with an initial shape of (A). Reversible stress-driven actuation is realized between (B-C) by adjusting the temperature about Ti while under a constant bias force (60.6 mN); the shape-memory effect is achieved by following the programming and recovery cycle of (A-B-D-E); and stress-free actuation can be activated thermally between (G-H) after a permanent monodomain has been programmed into the sample in step (F). The legend illustrates mesogen orientation in polydomain, monodomain, and isotropic states. T < Ti and T > Ti images were taken at 22 and 90 °C, respectively. Please click here to view a larger version of this figure.
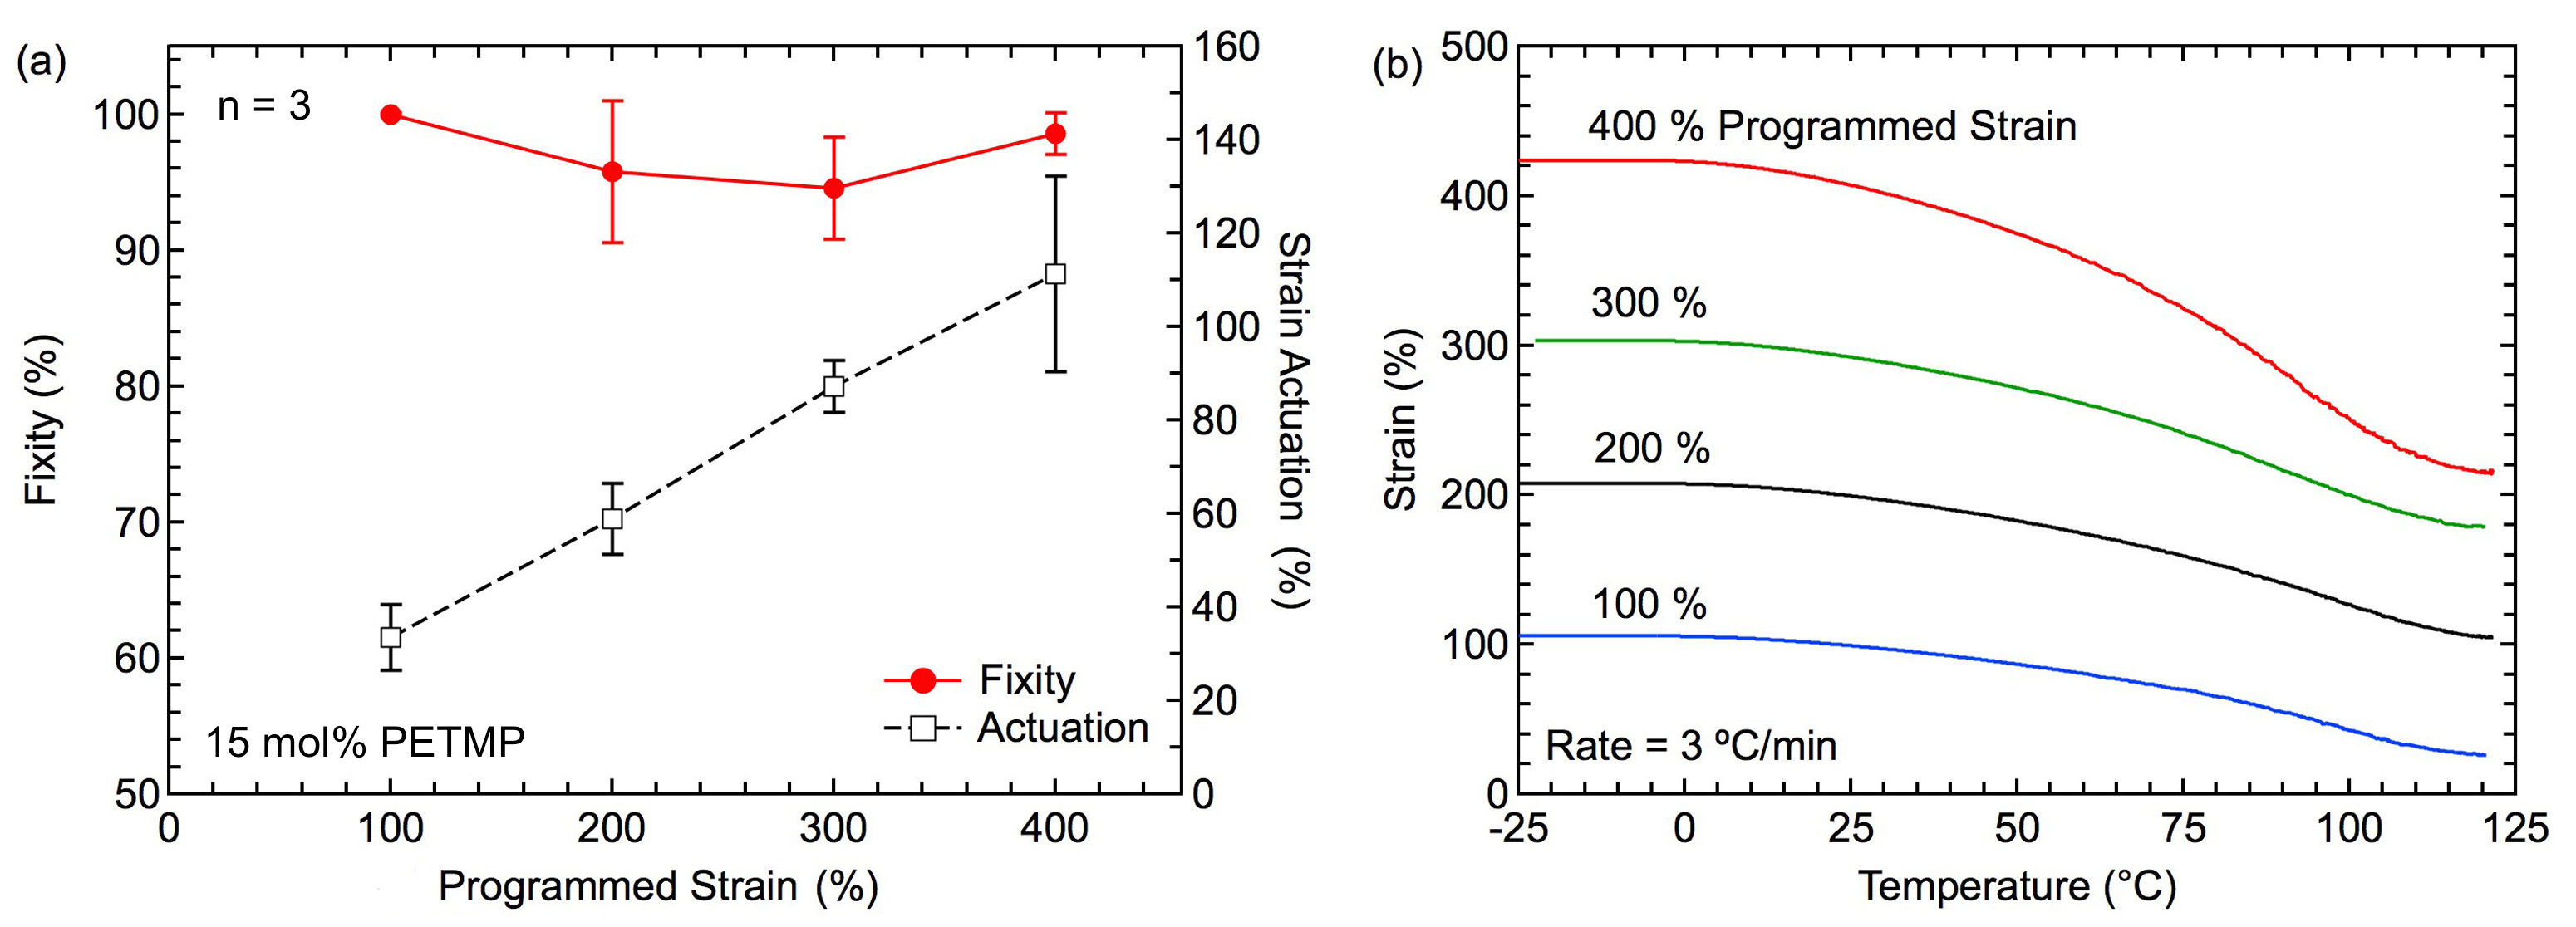
Figure 5. Thermomechanical Response in Programmed-Monodomain LCE Systems: (A) Shape fixity represents the efficiency of permanently aligning monodomain and all of samples show fixity above 90%. The magnitude of actuation measured between 22 and 90 °C on a hot plate. Error bars represent standard deviation. (B) The magnitude of actuation measured on DMA from -25 to 120 °C, the actuation increase with increasing of applied programming strain. Please click here to view a larger version of this figure.
| Name | RM 257 (g) | Toluene (g) | PETMP (g) | EDDET (g) | HHMP (g) | DPA (g)* |
| 15 mol% PETMP | 4.0 | 1.6 | 0.2166 | 0.9157 | 0.0272 | 0.5681 |
| 25 mol% PETMP | 4.0 | 1.6 | 0.3610 | 0.8080 | 0.0272 | 0.5681 |
| 50 mol% PETMP | 4.0 | 1.6 | 0.7219 | 0.5386 | 0.0272 | 0.5681 |
| 100 mol% PETMP | 4.0 | 1.6 | 1.4438 | 0.0000 | 0.0272 | 0.5681 |
| *DPA is diluted in toluene at a 1:50 ratio. | ||||||
Table 1. Chemical Formulations for LCE Systems. Four different LCE systems used in this study. The naming convention is based on the molar ratio of thiol functional groups between PETMP and EDDET. All systems have an excess of 15 mol% acrylate functional groups. It should be noted, FTIR studies tested HHMP as well as DMPA as photoinitiators and reduced the amount DPA catalyst by half to help with the kinetic characterization. *DPA is diluted in toluene at a ratio of 1:50.
| Name | Tonset (°C) | Tg (°C) | Ti (°C) | E'r (MPa) |
| 15 mol% PETMP | -6 ± 2 | 3 ± 1 | 62 ± 3 | 0.18 ± 0.01 |
| 25 mol% PETMP | 0 ± 2 | 7 ± 1 | 76 ± 2 | 0.47 ± 0.05 |
| 50 mol% PETMP | 8 ± 2 | 16 ± 2 | 78 ± 1 | 0.78 ± 0.13 |
| 100 mol% PETMP | 15 ± 1 | 27 ± 1 | 64 ± 3 | 1.90 ± 0.13 |
Table 2. Summary of Thermomechanical Properties of LCE Systems. Dynamic Mechanical Analysis (DMA) test shows the thermomechanical properties of the initial polydomain LCE networks formed via the first-stage Michael-addition reaction. Both Ti and E'r were measured at the lowest point of the storage modulus vs. temperature curve.
Discussion
Main-chain LCEs have been investigated for numerous potential applications ranging from actuators and sensors to artificial muscles. Unfortunately, synthesis and monodomain alignment remain significant challenges that prevent many of these applications from being fully realized.11 Recent work has explored new methods to help overcome these challenges, such as using exchangeable crosslinks to be able to re-program an aligned monodomain multiple times.33 The purpose of this study was to present a relatively unexplored approach to LCE synthesis and monodomain programming using a two-stage TAMAP reaction. The first-stage reaction is a "click" reaction based on a thiol-acrylate Michael addition using an amine catalyst. Due to the nature of this reaction, full conversion of thiol-acrylate Michael addition reaction was accomplished within 5 hr at RT using DPA as a catalyst (Figure 2). It is important to note that this was achieved with commercially available materials without purification and using a relatively simple "mix-and-pour" method. 0.5 mol% of DPA with respect to thiol functional groups was chosen in this study for the control it gave over polymerization rate, allowing transferring the monomers solution into the mold. It is very important to note that the polymerization rate of Michael addition is merely dedicated by the catalyst concentration. High catalyst concentration results an immediate gelation with high monomers conversions where is too low catalyst concentration allows slow conversions and often times high conversions cannot be achieved even as a function of time. Ultimately, the polymerization rate can be tuned by the catalyst concentration.34 One of the advantages this methodology offers is that the resulting intermediate polydomain LCE network is uniform and stable, such that the second-stage reaction can be delayed indefinitely. This can enable the synthesis and programming steps to be performed in separate laboratories. Furthermore, the second-stage reaction can be coupled with standard photolithography techniques to provide spatio-temporal control over photo-crosslinking.25 For preparation of our experimental samples, HHMP was used as a photoinitiator because of its stability in present of visible light and at elevated temperatures, allowing for samples to be thermally cycled for stress-driven actuation or the shape-memory effect without triggering the initiator. A separate photo-initiator was used for the FTIR portion of this study, helping illustrate that this methodology has the potential to be used with a variety of free-radical initiators to drive the second-stage reaction.
The presented TAMAP methodology offers facile control over the structure of the initial polydomain LCE network. The four LCE networks synthesized demonstrate a wide range of achievable thermomechanical properties by varying the ratio between the PETMP crosslinker and EDDET spacer. Failure strain decreased with increasing in the concentration of PETMP, while Tg and rubbery modulus (Er) increased with increasing in PETMP concentration. This behavior is explained as an increase in PETMP concentration increases the crosslinking density of the networks and restricts chain mobility within the network. The strain-to-failure behavior follows the inherent inverse relationship between rubbery modulus and failure strain as shown in other amorphous shape-memory polymer (SMP) networks.35 LCE systems with high failure strains are generally more desirable, as they allow for increased alignment of the monodomain with larger programming strains. The failure strain of our 15 mol% PETMP system was maximized when strained near Tg, as measured by the peak of tan ∂. This is also in good agreement with previous studies that demonstrated the maximum strain in amorphous SMP networks occurred between the onset of the glass transition and Tg;35,36 however, the LCE samples did not experience a rapid decrease in failure strain when heated above Tg, as shown in most elastomers.37 This can be attributed to the elevated tan ∂ region that exists between Tg and Ti (i.e., the nematic phase). Previous groups have investigated and verified the unique tan ∂ loss behavior in nematic LCE networks.38,39 This loss behavior is attributed to the soft-elasticity in the nematic phase, such that the anisotropic shape of the mesogens can accommodate strains by rotation without experiencing an increase in stress.
LCEs have generated a lot of scientific interest due to their stimuli-responsive shape-changing capabilities.40 Polydomain LCE samples can be programmed to demonstrate reversible stress-driven thermal actuation if stretched under a constant stress to program a temporary monodomain (Figure 4b-c); however, the shape-memory effect can also be realized in LCE networks.19,41 In this study, the TAMAP synthesized LCE samples could be programmed for shape memory at RT, in which a significant amount of strain remained stored in the sample even though the sample was above Tg. To enable stress free or "hands-free" actuation, the second stage photopolymerization reaction can be used to program a permanently aligned monodomain in stretched LCE samples. The efficiency of the second stage reaction can be examined by measuring fixity as a function of increasing stretch. It should be noted that fixity is a common metric used to evaluate the programming of SMP networks.42 In this study, samples were programed at different levels of strain (i.e., 100%, 200%, 300%, and 400%) and showed excellence fixity over 90%. Our results demonstrated that the magnitude of thermal actuation scaled with programming strain are in good agreement with previous results that link an increase in order parameter to increased mechanical actuation.43 For example, LCE samples that were photo-cured at 400% strain demonstrated on average 115% actuation when heated and cooled between 22 and 90 °C and 207% actuation when heated and cooled between -25 and 120 °C. Compared to other LCE studies, Ahir et al.44 reported 400% actuation in LC polymer fibers and Yang et al.22 reported 300% to 400% actuation for micro LCE pillars. It is important to note that the present study measures actuation differently from much of the LCE literature, which often calculates strain based on the length of the sample in the isotropic state. In this study, actuation strain is always based on the original length of the synthesized polydomain sample. This is more appropriate for the TAMAP methodology as it provides a more effective measure of the efficiency of the programming strain and photo-crosslinking on both strain fixity and recovery. Regardless, our reported actuation strains are still lower than 400% as reported in other studies. However, this TAMAP reaction is still relatively unexplored and the influence of photo-crosslinking has yet to fully be uncovered. While photo-crosslinking is necessary to fix a permanent monodomain, too much photo-crosslinking will prevent actuation from occurring. Theoretically, there should exist an optimal amount of photo-crosslinking to both stabilize the monodomain and allow for maximum actuation. Overall, the TAMAP methodology provides a powerful tool to synthesize LCE systems, tailor their structure, program permanent monodomain alignment, and ultimately explore this fascinating class of materials.
Disclosures
The authors have nothing to disclose.
Acknowledgements
This work was supported by NSF CAREER Award CMMI-1350436 as well as the University of Colorado Denver Center for Faculty Development. The authors would like to acknowledge Jac Corless, Eric Losty, and Richard Wojcik for their help in developing fixtures and molds for the synthesis and characterization of these materials. The authors would also like to thank Brandon Mang and Ellana Taylor for their preliminary characterization of the materials.
Materials
| Name | Company | Catalog Number | Comments |
|---|---|---|---|
| 1,4-Bis-[4-(3-acryloyloxypropyloxy)benzoyloxy]-2-methylbenzene; RM257 | Wilshire Technologies | 174063-87-7 | Di-Acrylate Mesogen |
| 2,2’-(Ethylenedioxy) diethanethiol; EDDET | Sigma Aldrich | 465178 | Di-Thiol Spacer |
| Pentaerythritol tetrakis (3-mercaptopropionate); PETMP | Sigma Aldrich | 381462 | Tetra-Thiol Crosslinker |
| Dipropylamine; DPA | Sigma Aldrich | D214752 | Catalyst |
| 2-Hydroxy-4′-(2-hydroxyethoxy)-2-methylpropiophenone; HHMP | Sigma Aldrich | 410896 | Photoinitiator |
| 2-2-dimethoxy-2-phenylacetophenone; DMPA | Sigma Aldrich | 196118 | Photoinitiator |
| Toluene | Sigma Aldrich | 244511 | Solvent |
References
- Brommel, F., Kramer, D., Finkelmann, H. Preparation of Liquid Crystalline Elastomers. Adv Polym Sci. 250, 1-48 (2012).
- Ohm, C., Brehmer, M., Zentel, R. Liquid Crystalline Elastomers as Actuators and Sensors. Adv Mater. 22 (31), 3366-3387 (2010).
- Garcia-Amoros, J., Martinez, M., Finkelmann, H., Velasco, D. Photoactuation and thermal isomerisation mechanism of cyanoazobenzene-based liquid crystal elastomers. Phys Chem Chem Phys. 16 (18), 8448-8454 (2014).
- de Gennes, P. G. Un muscle artificiel semi-rapide. Cr Acad Sci II B. 324 (5), 343-348 (1997).
- Finkelmann, H., Wermter, H. LC-elastomers and artificial muscles. Abstr Pap Am Chem S. 219, U493-U493 (2000).
- Ohm, C., Brehmer, M., Zentel, R. Applications of Liquid Crystalline Elastomers. Adv Polym Sci. 250, 49-93 (2012).
- Petsch, S., et al. Smart artificial muscle actuators: Liquid crystal elastomers with integrated temperature feedback. Sensor Actuat A-Phys. , (2014).
- Sanchez-Ferrer, A., et al. Photo-Crosslinked Side-Chain Liquid-Crystalline Elastomers for Microsystems. Macromol Chem Physic. 210 (20), 1671-1677 (2009).
- Selinger, R. L., Mbanga, B. L., Selinger, J. V. Modeling liquid crystal elastomers: actuators, pumps, and robots. P Soc Photo-Opt Ins. , 69110A-69115A (2008).
- Sungur, E., et al. Temperature tunable optical gratings in nematic elastomer. Appl Phys A. 98 (1), 119-122 (2010).
- Schuhladen, S., et al. Iris-Like Tunable Aperture Employing Liquid-Crystal Elastomers. Adv Mater. 26 (42), 7247-7251 (2014).
- Sánchez-Ferrer, A., et al. Liquid-Crystalline Elastomer Microvalve for Microfluidics. Adv Mater. 23 (39), 4526-4530 (2011).
- Burke, K. A., Rousseau, I. A., Mather, P. T. Reversible actuation in main-chain liquid crystalline elastomers with varying crosslink densities. Polymer. 55 (23), 5897-5907 (2014).
- Donnio, B., Wermter, H., Finkelmann, H. Simple and versatile synthetic route for the preparation of main-chain, liquid-crystalline elastomers. Macromolecules. 33 (21), 7724-7729 (2000).
- Bergmann, G. H. F., Finkelmann, H., Percec, V., Zhao, M. Liquid-crystalline main-chain elastomers. Macromol Rapid Comm. 18 (5), 353-360 (1997).
- Yang, H., et al. Synthesis and physical properties of a main-chain chiral smectic thiol-ene oligomer. Liq Cryst. 37 (3), 325-334 (2010).
- García-Márquez, A. R., Heinrich, B., Beyer, N., Guillon, D., Donnio, B. Mesomorphism and Shape-Memory Behavior of Main-Chain Liquid-Crystalline Co-Elastomers: Modulation by the Chemical Composition. Macromolecules. 47 (15), 5198-5210 (2014).
- Kupfer, J., Finkelmann, H. Nematic Liquid Single-Crystal Elastomers. Makromol Chem-Rapid. 12 (12), 717-726 (1991).
- Burke, K. A., Mather, P. T. Soft shape memory in main-chain liquid crystalline elastomers. J Mater Chem. 20 (17), 3449-3457 (2010).
- Agrawal, A., et al. Surface wrinkling in liquid crystal elastomers. Soft Matter. 8 (27), 7138-7142 (2012).
- Beyer, P., Terentjev, E. M., Zentel, R. Monodomain liquid crystal main chain elastomers by photocrosslinking. Macromol Rapid Comm. 28 (14), 1485-1490 (2007).
- Yang, H., et al. Micron-sized main-chain liquid crystalline elastomer actuators with ultralarge amplitude contractions. J Am Chem Soc. 131 (41), 15000-15004 (2009).
- Yang, H., et al. Novel liquid-crystalline mesogens and main-chain chiral smectic thiol-ene polymers based on trifluoromethylphenyl moieties. J Mater Chem. 19 (39), 7208-7215 (2009).
- Xia, Y., Verduzco, R., Grubbs, R. H., Kornfield, J. A. Well-defined liquid crystal gels from telechelic polymers. J Am Chem Soc. 130 (5), 1735-1740 (2008).
- Yakacki, C., et al. Tailorable and programmable liquid-crystalline elastomers using a two-stage thiol-acrylate reaction. RSC Adv. 5 (25), 18997-19001 (2015).
- Meng, Y., Jiang, J., Anthamatten, M. Shape Actuation via Internal Stress-Induced Crystallization of Dual-Cure Networks. ACS Macro Lett. 4 (1), 115-118 (2015).
- Peng, H., et al. High Performance Graded Rainbow Holograms via Two-Stage Sequential Orthogonal Thiol-Click Chemistry. Macromolecules. 47 (7), 2306-2315 (2014).
- Nair, D. P., et al. Two-Stage Reactive Polymer Network Forming Systems. Adv Func Mater. 22 (7), 1502-1510 (2012).
- Alzahrani, A. A., et al. Photo-CuAAC Induced Wrinkle Formation in a Thiol-Acrylate Elastomer via Sequential Click Reactions. Chem Mater. 26 (18), 5303-5309 (2014).
- Ma, S. J., Mannino, S. J., Wagner, N. J., Kloxin, C. J. Photodirected Formation and Control of Wrinkles on a Thiol-ene Elastomer. ACS Macro Lett. 2 (6), 474-477 (2013).
- Kamal, T., Park, S. Y. Shape-Responsive Actuator from a Single Layer of a Liquid-Crystal Polymer. ACS Appl Mater Interfaces. 6 (20), 18048-18054 (2014).
- Nair, D. P., et al. The thiol-Michael addition click reaction: a powerful and widely used tool in materials chemistry. Chem Mater. 26 (1), 724-744 (2013).
- Pei, Z. Q., et al. Mouldable liquid-crystalline elastomer actuators with exchangeable covalent bonds. Nat Mater. 13 (1), 36-41 (2014).
- Chan, J. W., Hoyle, C. E., Lowe, A. B., Bowman, M. Nucleophile-initiated thiol-michael reactions: effect of organocatalyst, thiol, and ene. Macromolecules. 43 (15), 6381-6388 (2010).
- Safranski, D. L., Gall, K. Effect of chemical structure and crosslinking density on the thermo-mechanical properties and toughness of (meth)acrylate shape memory polymer networks. Polymer. 49 (20), 4446-4455 (2008).
- Yakacki, C. M., Willis, S., Luders, C., Gall, K. Deformation Limits in Shape-Memory Polymers. Adv Eng Mater. 10 (1-2), 112-119 (2008).
- Smith, T. L. Ultimate tensile properties of elastomers. I. Characterization by a time and temperature independent failure envelope. J Polym Sci Part A. 1 (12), 3597-3615 (1963).
- Clarke, S. M., Hotta, A., Tajbakhsh, A. R., Terentjev, E. M. Effect of cross-linker geometry on dynamic mechanical properties of nematic elastomers. Phys Rev E. 65 (2), (2002).
- Martinoty, P., Stein, P., Finkelmann, H., Pleiner, H., Brand, H. R. Mechanical properties of monodomain side chain nematic elastomers. Eur Phys J E. 14 (4), 311-321 (2004).
- Behl, M., Lendlein, A. Actively moving polymers. Soft Matter. 3 (1), 58-67 (2007).
- Rousseau, I. A., Mather, P. T. Shape memory effect exhibited by smectic-C liquid crystalline elastomers. J Am Chem Soc. 125 (50), 15300-15301 (2003).
- Sauter, T., Heuchel, M., Kratz, K., Lendlein, A. Quantifying the Shape-Memory Effect of Polymers by Cyclic Thermomechanical Tests. Polym Rev. 53 (1), 6-40 (2013).
- Clarke, S. M., Hotta, A., Tajbakhsh, A. R., Terentjev, E. M. Effect of cross-linker geometry on equilibrium thermal and mechanical properties of nematic elastomers. Phys Rev E. 64 (6), (2001).
- Ahir, S. V., Tajbakhsh, A. R., Terentjev, E. M. Self-Assembled Shape-Memory Fibers of Triblock Liquid-Crystal Polymers. Adv Func Mater. 16 (4), 556-560 (2006).
Reprints and Permissions
