

Summary
We describe a relatively simple method for ex vivo live imaging of the tumor cell-stroma interactions within lung metastasis, utilizing fluorescent reporters in mice. Using spinning-disk confocal microscopy, this technique enables visualization of live cells for at least 4 hr and could be adapted to study other inflammatory lung conditions.
Abstract
Metastasis is a major cause for cancer-related morbidity and mortality. Metastasis is a multistep process and due to its complexity, the exact cellular and molecular processes that govern metastatic dissemination and growth are still elusive. Live imaging allows visualization of the dynamic and spatial interactions of cells and their microenvironment. Solid tumors commonly metastasize to the lungs. However, the anatomical location of the lungs poses a challenge to intravital imaging. This protocol provides a relatively simple and quick method for ex vivo live imaging of the dynamic interactions between tumor cells and their surrounding stroma within lung metastasis. Using this method, the motility of cancer cells as well as interactions between cancer cells and stromal cells in their microenvironment can be visualized in real time for several hours. By using transgenic fluorescent reporter mice, a fluorescent cell line, injectable fluorescently labeled molecules and/or antibodies, multiple components of the lung microenvironment can be visualized, such as blood vessels and immune cells. To image the different cell types, a spinning disk confocal microscope that allows long-term continuous imaging with rapid, four-color image acquisition has been used. Time-lapse movies compiled from images collected over multiple positions and focal planes show interactions between live metastatic and immune cells for at least 4 hr. This technique can be further used to test chemotherapy or targeted therapy. Moreover, this method could be adapted for the study of other lung-related pathologies that may affect the lung microenvironment.
Introduction
The deadliest aspect of cancer is metastasis, which accounts for more than 90% of cancer-related morbidity and mortality1. Metastasis is a multistep process and due to its complexity, the exact cellular and molecular mechanisms that govern metastatic dissemination and growth are still elusive. To metastasize, tumor cells in the primary tumor must detach from their neighboring cells and basement membrane, cross through the extracellular matrix, intravasate, travel via blood or lymphatic vessels, extravasate at the secondary site, and finally, survive and establish secondary tumors. In addition to the properties of the tumor cells, the contribution from the microenvironment, which includes the adjacent stroma along with the normal counterparts of the cancer cells, is crucial for the seeding and establishment of metastatic lesions2.
Traditional methods to study metastatic seeding and growth examine static states, as tissues are excised and sectioned for histology. These data only generate a snapshot of this highly dynamic process. Although some useful information can be gained from these studies, the complicated process by which tumor and stromal cells interact during metastatic formation cannot be adequately assessed by these methods. Furthermore, it is not possible to gain insights into tumor or stromal cell migration patterns, which are important in establishing a colony at the distant site. In order to effectively study the metastatic process, it is essential to visualize various interactions between cancer cells and their microenvironment in a continuous manner and at real time.
The lung is a common site for metastases from solid tumors as breast, colorectal, pancreatic cancer, melanoma and sarcoma3. Intravital imaging was previously used to study cell-cell interaction in various primary tumor and metastatic models4,5. Methods of lung imaging in mice, including intravital imaging, lung section imaging, and an ex vivo pulmonary metastasis assay have been published6–9. Intravital imaging of mouse lungs utilizes a thoracic suction window to stabilize the lungs6. This method is used for time-lapse imaging of the lung microcirculation and alveolar spaces. The anatomical location of the lungs poses a challenge to intravital imaging. In order to access the lungs, the chest cavity must be opened which leads to loss of negative pressure and collapsed lungs. This method only allows the visualization of a small part of the lungs and is technically demanding; an unnecessary complication in studies that examine processes that are independent of blood flow. Moreover, this method also requires gating out movement caused by breathing. This is done either by collecting images between breaths or during post image acquisition analyses10. The alternative ex vivo lung section imaging provides stability and depth, and also prepares lung parenchyma for immunostaining7. However, the lengthy sectioning process leads to an extensive delay between the time of animal sacrifice and the start of the imaging session. Moreover, the process of sectioning a mouse lung causes considerable amount of cell death8, thus interfering with the quality and quantity of imaging samples and perhaps needlessly altering tumor-stroma interactions. In order to technically bridge between the methods of intravital imaging and lung section imaging, while exploiting the advantages of the two techniques, a relatively fast and easy method for ex vivo lung imaging was developed. This method was achieved by imaging of non-sectioned whole lung lobes. Using this method, the motility of cancer cells as well as interactions between cancer cells and stromal cells in their microenvironment can be visualized in real time for several hours.
Subscription Required. Please recommend JoVE to your librarian.
Protocol
All procedures described must be performed in accordance with guidelines and regulations for the use of vertebrate animals, including prior approval by the local Institutional Animal Care and Use Committee (IACUC).
1. Generation of Lung Metastases for Ex vivo Live Imaging (Transgenic or Tail Vein Injection)
NOTE: Lung metastases can be generated by utilizing genetically engineered mouse models or by intravenous (i.v) injection of cancer cells.
- Generate lung metastases for imaging by crossing a genetically engineered tumor mouse model into a transgenic reporter mouse, e.g., cross the breast cancer mouse model, mouse mammary tumor virus long terminal repeat-polyoma middle T antigen (MMTV-PyMT)11 into ACTB-ECFP mouse model12.
NOTE: The ACTB-ECFP model expresses enhanced cyan fluorescent protein (ECFP) under the β-actin promoter such that all cells fluoresce in the blue, CFP channel. However, cancer cells are by far the most prominent and appear as a bulk of ECFP-positive cells under the microscope. The MMTV-PyMT mouse model develops a progressive disease, in which mammary tumor growth is associated with the dissemination of cancer cells to the periphery, especially to the lungs. In MMTV-PyMT mice on the FVB/n background, micrometastases can be observed around 10-11 weeks of age. Generally, these progress to macrometastases at around 14 weeks of age13.
OR - Generate experimental metastases using primary cells or syngeneic cell lines. Use in vitro manipulated primary tumor cells or cell lines (e.g., transduction) followed by i.v. injection14.
- Briefly, in this protocol, inject a green fluorescent protein (GFP)-expressing (+) MMTV-PyMT cell line into fluorescent reporter mice (ACTB-ECFP) or wildtype mice. Then, visualize these cells referred to as VO-PyMT cells15 using the green, GFP channel.
NOTE: The original VO-PyMT cell line was derived at the Vanderbilt Orthopaedics in Nashville, TN. VO stands for Vanderbilt Orthopaedics. - Following the injection of 106 cells (in 200 µl), observe cancer cell extravasation immediately and up to a few hours after injection; observe micrometastases between 1-3 weeks after injection and detect macrometastases 3 weeks after injection15.
NOTE: Fewer cells can be injected to prolong the time from injection to metastatic growth.
- Briefly, in this protocol, inject a green fluorescent protein (GFP)-expressing (+) MMTV-PyMT cell line into fluorescent reporter mice (ACTB-ECFP) or wildtype mice. Then, visualize these cells referred to as VO-PyMT cells15 using the green, GFP channel.
2. Labeling of Components of Interest in the Metastatic Microenvironment (Transgenic and/or Injectables)
NOTE: Labeling can be achieved by transgenic mice and/or by various injectables. Make sure to use different fluorescent colors for the labeling of various cell types.
- Label components of the metastatic microenvironment using transgenic mice. Cross the previously mentioned mouse tumor model (e.g., MMTV-PyMT x ACTB-ECFP) into a transgenic mouse model in which the stromal cells of interest are labeled by a fluorescent protein which is not ECFP, e.g., c-fms-EGFP4,16.
NOTE: In addition to visualization of cancer cells in the CFP channel, this enables visualization of myeloid cells in the GFP channel4.
AND/OR - Label various components of the metastatic microenvironment using injectables into transgenic fluorescent reporter mice or (non-fluorescent) wildtype mice.
NOTE: Several compounds can be injected to label various components of the metastatic microenvironment, e.g., an AF647-conjugated Gr-1 antibody is used here to label neutrophils and some monocytes13 and different molecular weight dextrans are used to label lung capillaries. For preparation of these injectables see step 4.
3. Preparation of Materials Before Dissection
- 2% Agarose
- Weigh 0.2 g of agarose and add to 10 ml 1 x PBS. Heat the solution to dissolve the agarose. Agarose will solidify at RT, so maintain it in a 37 °C water bath until used for inflation.
- CO2 and temperature controller
- Check ddH2O in the humidification chamber. Refill when needed. Insert configuration plate into temperature stage plate holder (climate chamber). Turn on the CO2 controller and set CO2 at 5%. Make sure the airflow rate is set at 0.4 Nl/min.
- Open the air and CO2 valves. Turn on the temperature controller. Make sure the temperature of the climate chamber and the lid are set at 37 °C.
- Release air pressure on CO2 meter. Check CO2 increasing, equilibration can take up to 30 min.
- Spinning disk confocal microscope
NOTE: Details of the microscope set-up have been previously described4,17.- Turn on the lasers (the argon laser for 488 nm excitation and the solid-state 405 nm, 561 nm and 640 nm lasers). Turn on the microscope, the camera, the spinning disk control unit, the AOTF, the laser control unit and the camera controller.
- Open the microscope shutter, turn on the computer running the microscope and open the software.
- Preparation of the tools and dissection platform.
- Turn on the hot bead sterilizer and let it reach 250 °C. Clean 2 pairs of surgical scissors and forceps with water and soap. Sterilize the tools for at least 30 sec. Let the tools cool off. Use a polystyrene lid as dissection platform. Cover it with a piece of lab soaker.
4. Preparation of Injections
NOTE: Depending on the half-life and the preferred response, inject fluorescently labeled antibodies and/or fluorescent molecules either immediately prior to animal sacrifice or a couple of hours to days before.
- To image Gr1-positive neutrophils and monocytes, prepare a syringe with 7 µl of stock AF647-conjugated Gr-1 antibody (1 mg/ml) into 100 µl of sterile PBS under the hood. Place a 27 G ½ needle on the syringe.
- To image lung capillaries, prepare a second and third syringe with 100 µl of either 70 kD rhodamine-conjugated dextran (4 mg/ml) or 10 kD AF647-conjugated dextran (4 mg/ml). Place a 27 G ½ needle on the syringes.
- Inject the AF647-conjugated antibody solution i.v. 5 hr prior to lungs’ excision.
- Inject one or both dextran solutions i.v. immediately prior to lungs’ excision.
5. Preparation of Lungs for Ex vivo Live Imaging
NOTE: Try to work as sterile and careful as possible to avoid unnecessary challenges of the immune cells within the lungs.
- Inject the mouse intraperitoneal (i.p.) with a lethal overdose of an anesthetic permitted by the animal protocol approved by IACUC, e.g., 1 ml of 2.5% Avertin. Wait for the mouse to stop breathing and be completely non-responsive to noxious stimuli (hind paw pinch).
NOTE: Cervical dislocation and carbon dioxide euthanasia should be avoided as it can detrimentally affect lung cell viability. - Immobilize the mouse on a dissection board and sterilize the mouse with 70% ethanol.
- Use surgical scissors to first make a transverse epigastric incision through the skin, followed by a similar incision through the peritoneum. Hold the dissection board in a vertical position and cut the descending aorta, so that blood pools down in the abdomen and not in the chest cavity.
- Snip a small opening in the diaphragm to release vacuum. Cut along the 10th and 12th rib to excise the diaphragm and get visual access to the lungs.
- Use surgical scissors to cut the skin up to the trachea over the ribcage but leave the ribcage intact. Separate the skin from the ribcage. Expose the trachea by removing the surrounding connective tissue, being careful not to damage the trachea itself (Figure 1A).
- Snip a small opening approximately 1 mm in diameter in the exposed trachea parallel to the cartilaginous rings, as close to the larynx as possible (Figure 1B). Be careful not to cut completely through the trachea.
- Take a 20 G needle and gently insert the needle 4-5 mm into the trachea without any counter force (Figure 1D). The end of the needle should be visible through the trachea (Figure 1C). Use forceps to stabilize the needle in the trachea. Alternatively, a suture may be tied around the trachea to hold the needle in place.
NOTE: By inserting too deep, the carina may be traumatized or only one side of the lungs might be inflated. - Fill a syringe with 400 µl of 37 °C 2% low-melting-temperature agarose (taken directly from a constant temperature bath). Make sure the dissection board is standing up and slowly instill the warm agarose through the needle into the lungs, use ~400 µl to inflate the lungs.
NOTE: Watch the lungs inflating inside the ribcage. Do not over-inflate the lung as it will rupture. - Once the lungs are inflated, filling ~⅔ of the rib cage, detach the syringe and keep the needle inside the trachea to prevent any agarose from leaking.
- Pour approximately 50 ml of 20 °C PBS over the inflated lungs to allow the agarose inside the lungs to set and solidify. Slowly remove the needle and close the trachea with forceps to prevent any non-solidified agarose from leaking.
- Expose the lungs by performing a sternotomy and subsequently excise the lungs. For excision of the lungs, hold on to the trachea while cutting through the trachea completely. Gently pull the trachea up, cut away the connective tissue and esophagus while pulling the lungs out of the chest cavity until the lungs is separated from the mouse (Figure 1E).
- Immerse the lungs in warm RPMI-1640 to wash off excessive blood and gently separate the lobes by using scissors and forceps to cut the lobes’ main stem bronchus at hilum (Figure 1F).
- Place the lobes, with the flat surface down to maximize imaging surface, in a well of a 24-well imaging plate (Figure 1G). Add 100 µl of 37 °C RPMI-1640 on top of the lobes. Place several 15 mm circular microscope cover slides on top of the lobes to prevent it from floating.
- Pour warm PBS into the surrounding wells to prevent the RPMI-1640 media from evaporating. Insert the 24-well plate into the equilibrated climate chamber and maintain the lung lobes at 37 °C with air and 5% CO2. Insert the climate chamber on the stage of the confocal microscope.
NOTE: Other gas mixtures (e.g., 5% O2, 5% CO2 in N2 to examine cell behavior under conditions of hypoxia/lower oxygen) could also be considered.

Figure 1. Protocol for preparation of lungs for live imaging. (A) Exposure of the trachea after preparation of the mouse. (B) Small snip made in the exposed trachea parallel to the cartilaginous rings. (C) 20 G needle inserted 4-5 mm into the trachea. (D) Instillation of 400 µl 2% low-melting-temperature agarose into the lungs. (E) Inflated lungs separated from the mouse. (F) Lobes separated after inflation. (G) Lobes placed in a well of a 24-well imaging plate. Please click here to view a larger version of this figure.
6. Acquisition and Analysis of Images
NOTE: Images can be acquired with a variety of spinning disk confocal microscopes supported by various software programs. In this protocol, either µManager with a custom-made spinning disk confocal microscope or Zen with a commercially-available spinning disk confocal microscope is used for image acquisition, while Imaris is used for movie editing and analysis.
- Acquire images using µManager. A detailed step by step protocol for the acquisition of images using µManager software is previously described18.
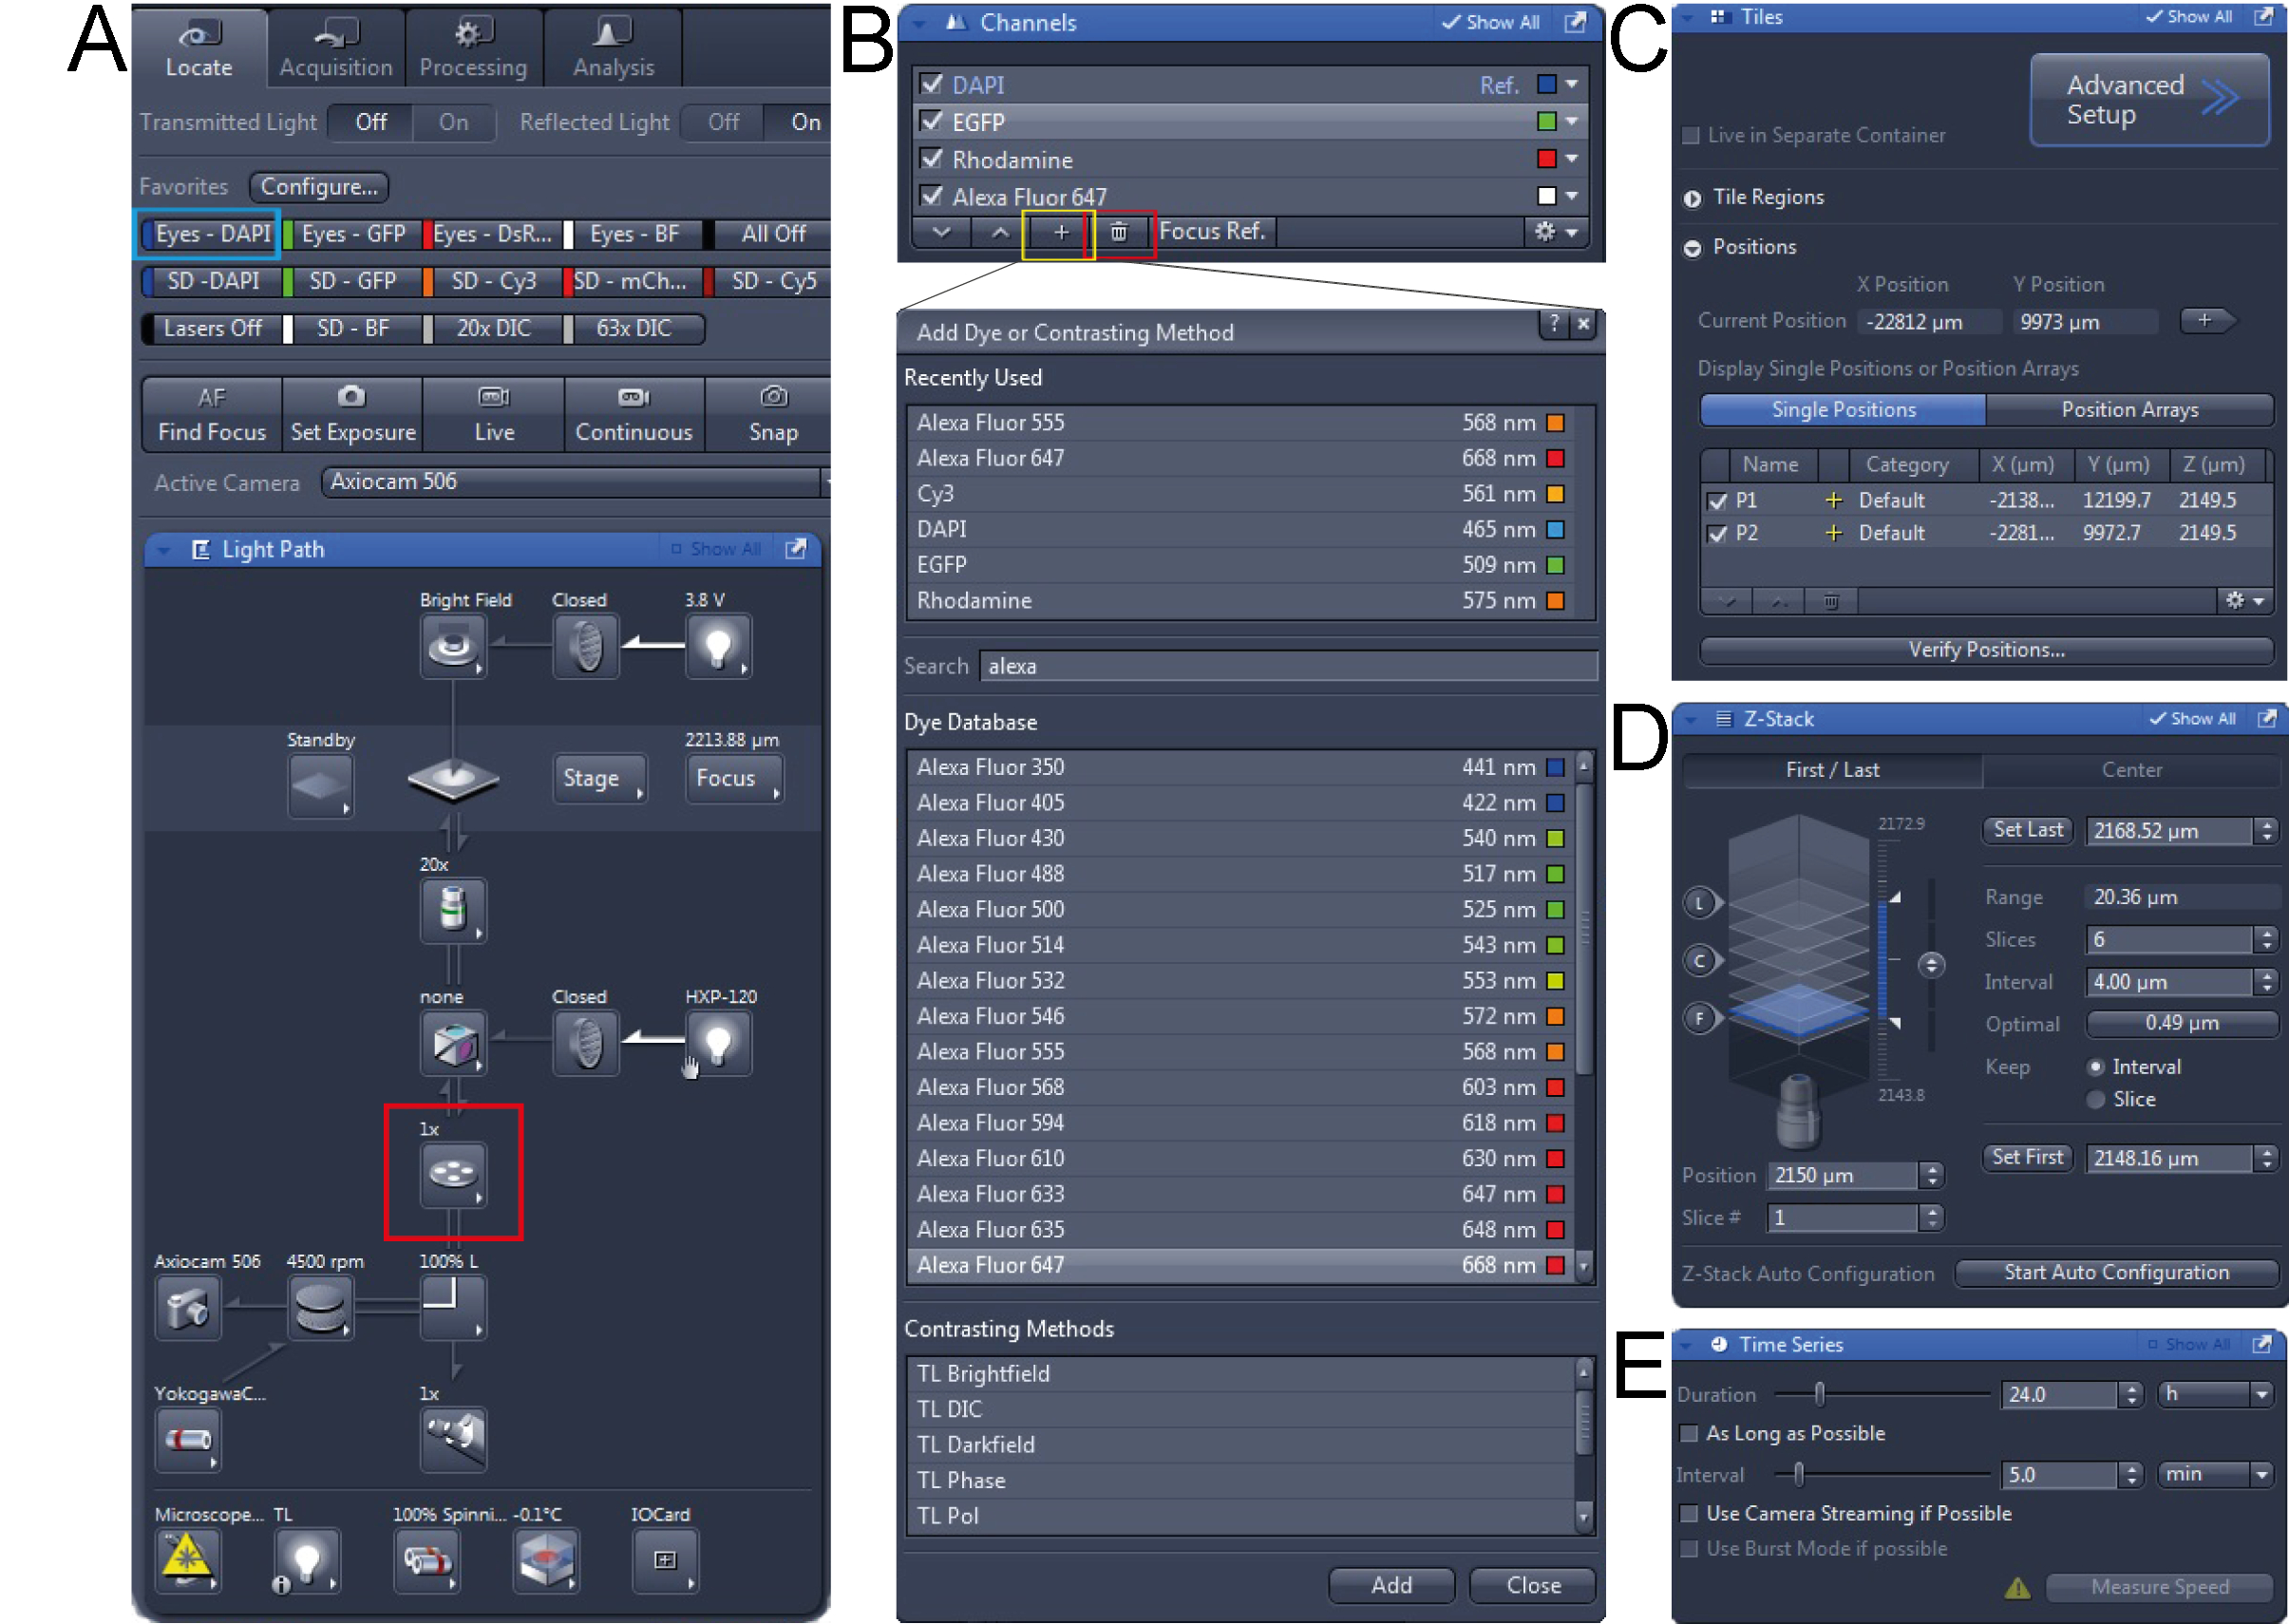
OR - Acquire images using image analysis software such as Zen (see Figure S1).
- Click on the ‘Locate’ tab, and choose objective (10x or 20x) in the ‘Light Path’ tool (Figure S1A, red box). Subsequently, click on ‘Eyes – DAPI’ to look at the CFP channel through the eyepiece (Figure S1A, blue box). Localize the sample manually using the microscope. Click ‘All Off’after the tissue is center of the field of view.
- Click on the ‘Acquisition’ tab to set all the parameters for image acquisition.
- In the ‘Channels’ tool, click the ‘+’ button (Figure S1B, red box). A pop-up menu appears and search for the dye(s) present in the sample in the ‘Dye Database’ (Figure S1B). Select the dye and click ‘Add’.
NOTE: The program will set all filters to be optimized. A dye can be deleted by selecting it followed by clicking the trash can button (Figure S1B, yellow box). - In the ‘Acquisition Mode’ menu, set ‘Binning’ to 5x5. Double click on ECFP in the channels menu to select it. Lower the laser power to 20% so the sample will not be bleached while setting up the parameters for image acquisition.
- Check the ‘Tiles’ box in the ‘Experiment Manager’ section and the tiles tool appears in the ‘Multidimensional Acquisition’ tool group (Figure S1C). Click on ‘Advanced Setup’ button to view the live image from the camera. Click on the ‘Add’ button in the ‘Positions’ section to add 4 to 6 positions to the experiment. To delete a position, select that position and click on the trash can button.
- In the ‘Acquisition Parameter’ tool group, open the ‘Focus Strategy’ tool, and select ‘Absolute Fixed Z-position’ from the dropdown list.
- Check the Z-Stack box in the ‘Experiment Manager’ section and the Z-Stack tool appears in the ‘Multidimensional Acquisition’ tool group (Figure S1D). Double click on one of the positions in the ‘Positions’ section and press ‘Live’. Manually set first and set last position of the imaging field. Set the interval at 4 µm.
NOTE: The program will determine the number of slices for the chosen range and interval. Ideally, 5-7 slices are convenient to allow sufficient visualization and rapid image acquisition. - Check the ‘Time Series’ box in the ‘Experiment Manager’ section. Set desired ‘Duration’ and ‘Interval’ times in the ‘Time Series’ tool that appeared in the ‘Multidimensional Acquisition’ tool group (Figure S1E).
- In the ‘Acquisition Mode’ menu, set ‘Binning’ to 2x2. Double click on a fluorophore in the channels menu to select it and increase the laser power to 100%. Press ‘Live’ and adjust the ‘Exposure Time’. Repeat this for every fluorophore.
- Check the ‘Enable Auto Save’ box. Select a folder and type in the name of the file. All the acquired images will be automatically saved in this folder.
- Click on ‘Start Experiment’ in the ‘Experiment Manager’ section to start image acquisition.
- After image acquisition, compile the raw data in Imaris software. Convert images to .ims files and adjustments can be made. A detailed step by step protocol for conversion of files, making adjustments and saving movies using Imaris is previously described18.
- When saving the movie, set the ‘Frame Rate’ to 5 frames per second (fps).
Subscription Required. Please recommend JoVE to your librarian.
Representative Results
Using spinning-disk confocal microscopy, various mouse model systems and injectables, the metastatic microenvironment can be visualized and tracked over time. Using an MMTV-PyMT; ACTB-ECFP; c-fms-EGFP triple transgenic mouse model, different cellular components are fluorescently labeled (Figure 2A, Movie 1). The typical structure of the lung parenchyma can be visualized in the CFP channel since all cells express ECFP under the β-actin promoter. Larger/multicellular lung metastases are easily resolved as these appear as a bulk of cells within the organized lung structure. Myeloid cells are visualized in the GFP channel through c-fms-EGFP expression, which is the transgene for CSFR-112. Myeloid cells are very dynamic as they migrate throughout the imaging field. c-fms-EGFP-positive cells are more abundant and migratory in lung parenchyma as compared to those in close contact with the lung metastasis. The dynamics of myeloid cells and their interactions with lung metastases can be followed in real time for several hours.
To examine metastatic seeding and growth, an experimental metastasis model is used (Figure 2B, Movie 2). The GFP+ VO-PyMT tumor cells were injected into a wildtype, non-reporter mouse and allowed to seed and grow for 2 weeks. The structure of the lung is clearly visible in the GFP channel due to autofluorescence of the lungs. However, the VO-PyMT cells are still easily distinguishable from the lung structure since they have a round shape and higher EGFP expression thus appear brighter as compared to the lung parenchyma. VO-PyMT cellular motility can be observed within the established metastatic lesion.
Cellular interactions between metastatic and immune cells in the lung microenvironment can also be examined using the experimental metastasis model. Two weeks after injection of VO-PyMT cells, fluorescently labeled Gr-1 647 conjugated antibodies are i.v. injected 5 hr prior to lung excision (Figure 2C, Movie 3). On the left side of the imaging field, two Gr-1+ myeloid cells are interacting with a VO-PyMT cell. A metastatic lesion is observed on the right side of the imaging field. Over time, Gr-1+ cells are recruited to the metastatic lesion. Below the metastatic lesion, one of the Gr-1+ cells closely interacts with a VO-PyMT cell. Eventually, the VO-PyMT cell dislodges, disengaging from the Gr-1+ cell.
Combining reporter transgenic mouse models with the experimental metastasis model and injectable antibodies labeling immune cells yields a three-color movie. One week after the injection of VO-PyMT cells into an ACTB-ECFP reporter mouse, fluorescently labeled Gr-1 647 conjugated antibodies are i.v. injected 5 hr prior to tissue excision (Figure 2D, Movie 4). Gr-1+ cells migrate vigorously within the field of view, while a single GFP+ metastatic cell is visible at the center of the imaging field.
Injecting different fluorescent dextrans into reporter mice, which were previously injected with metastatic cells, can yield a four-color movie (Figure 2E, Movies 5-6). Early events in the seeding of metastasis can be studied when VO-PyMT cells are visualized immediately and 4 hr after i.v. injection into ACTB-ECFP reporter mice. The injection of rhodamine-conjugated, 70 kD dextran and 10 kD dextran conjugated to a 647 fluorescent tag allows the visualization of lung capillaries. The usage of lower and higher molecular weight dextrans could potentially be utilized to detect changes in the permeability of capillaries in the lungs, since the lower molecular weight molecules extravasate faster as compared to the high molecular weight ones19. Although cellular events can still be effectively studied, Movie 5 is an example of a tissue drift. If necessary and in the case the tissue cannot be repositioned during the imaging session, this could be corrected during the post image acquisition analyses.
This system enables a rapid, four-color continuous image acquisition to follow different fluorescently labeled cell types within the lung metastatic microenvironment. This protocol also allows the visualization of metastasis of different sizes, from events related to the seeding of single cancer cells to established metastases. Moreover, tumor cells and stromal cells movement can be visualized within the lung microenvironment along with blood vessels. Typically, cellular movement can be observed for at least 4 hr from the start of the imaging session. The observation of different metastatic microenvironments within the same lung tissue helps to avoid mouse-to-mouse variability.

Figure 2. Representative images from movies acquired by live imaging. (A) Snapshot of a merged Z stack from movie 1 showing myeloid cells associated with a lung metastasis (yellow insert) versus those associated with the lung parenchyma (red insert). (B) Snapshot of a merged Z stack from movie 2 showing GFP+ metastatic cell in an experimental metastasis model. Arrowhead points to a motile metastatic cell. (C) Snapshot of a Z stack from movie 3 showing co-localization of fluorescent signals from a GFP+ metastasis and Gr-1+ cells visualized by a Gr-1 antibody conjugated to a 647 tag (red arrowhead). Green arrowhead points to a GFP+ metastatic cell that dislodged from the metastatic bulk. White arrowhead points to a Gr-1+ cell that interacted with the motile GFP+ VO-PyMT cell. (D) Snapshot of a merged Z stack from movie 4 showing GFP+ VO-PyMT cells, in ACTB-ECFP mouse. A single VO-PyMT cell is visible in the center (green arrowhead). The animal was injected with Gr-1 647 conjugated antibody. (E) Representative Z-stack of movies 5 and 6 showing blood vessels in the lung of mice sacrificed immediately after injection of 70 kD rhodamine-dextran (red arrowhead) along with the GFP+ VO-PyMT cells (green). Scale bars are 100 µm. Please click here to view a larger version of this figure.

Supplementary Figure 1. Screen shots of ZEN camera software for acquisition of images. (A) First, in the ‘Light Path’ tool the right objective should be chosen (red box) and the tissue be localized in the microscope. (B) Configure channels for image acquisition, in the ‘Channels’ tool channels can be deleted (red box) or added (yellow box). (C) In the ‘Tiles’ tool, different positions can be added to the experiment. (D) In the ‘Z-Stack’ tool, the Z-stack can be set and the thickness of slices can be adjusted. (E) In the ‘Time Series’ tool, the Duration and Interval can be set. Please click here to view a larger version of this figure.

Movie 1. (Right click to download). Interactions between a lung metastasis and surrounding immune cells using transgenic reporter mice. This movie shows a metastasis in the lung of a triple-transgenic MMTV-PyMT; ACTB-ECFP; c-fms-EGFP mouse in which all cells are labeled with ECFP and myeloid cells are labeled with EGFP. The metastasis can be observed as a bulk of cells in blue in contrast to the normal lung architecture. c-fms+ myeloid cells migrate throughout the whole imaging field. This movie is a 2 hr 1 min acquisition.

Movie 2. (Right click to download). Cancer cell motility in an experimental metastasis model. This movie shows a lung metastasis generated by i.v. injection of GFP+ VO-PyMT (green) cells into a wildtype, non-reporter, mouse. Lungs were harvested two weeks after injection of VO-PyMT cells. GFP+ cells are moving within the metastatic bulk. This movie is a 4 hr 40 min long acquisition.

Movie 3. (Right click to download). Recruitment of immune cells visualized by fluorescently-conjugated antibodies to experimentally established metastasis. This movie shows a lung metastasis generated by i.v. injection of GFP+ VO-PyMT cells (green) into a wildtype, non-reporter, mouse. Lungs were harvested two weeks after the VO-PyMT cells were injected. Gr-1+ cells are labeled with Gr-1 647 conjugated antibody and observed in the near infrared channel (white). Note that Gr-1 cells are recruited to the GFP+ metastasis. This movie is an example of a long-term acquisition, a total of 11 hr 27 min.

Movie 4. (Right click to download). Motility of immune cells visualized by fluorescently-conjugated antibodies in a transgenic reporter mouse injected with metastatic cells. This movie shows a single GFP+ VO-PyMT cell in the lung generated by i.v. injection of VO-PyMT cells (green) into an ACTB-ECFP mouse. Lungs were harvested one week after VO-PyMT cells were injected. Gr-1+ cells are labeled with Gr-1 647 conjugated antibody and observed in the near infrared channel (white). This movie is a 2 hr 40 min long acquisition.

Movie 5. (Right click to download). Metastatic cells and capillaries visualized by fluorescent dextrans immediately after i.v. injection into a transgenic reporter mouse. This movie shows experimental metastasis generated by i.v. injection of GFP+ VO-PyMT cells (green) into an ACTB-ECFP mouse along with the injection of rhodamine-conjugated, 70 kD dextran (red) and 10 kD dextran conjugated to a 647 fluorescent tag (white), to mark blood vessels. This movie is an example of a tissue drift and is an 18 min long acquisition.

Movie 6. (Right click to download). Metastatic cells and capillaries visualized by fluorescent dextrans several hours after i.v. injection into a transgenic reporter mouse. This movie shows experimental metastasis generated by i.v. injection of GFP+ VO-PyMT cells (green) into an ACTB-ECFP mouse along with the injection of rhodamine-conjugated, 70 kD dextran (red) and 10 kD dextran conjugated to a 647 fluorescent tag (white), to mark blood vessels. Lungs were retrieved 4 hr after injection of the VO-PyMT cells. This movie is a 19 min long acquisition.
Subscription Required. Please recommend JoVE to your librarian.
Discussion
This manuscript describes a detailed method for ex vivo live imaging of lung metastasis in mouse models of metastasis. This imaging protocol provides a direct visualization of the dynamic and spatial tumor cell-stroma interactions within the lung microenvironment. It is a relatively easy and fast method that allows reliable imaging of lung metastasis for at least 4 hr. Movies acquired from these experiments can be used to track dynamic processes as cell motility and cellular interactions.
Two methods for the generation of lung metastasis were described: a genetically engineered mouse model and the use of a manipulated cell line. The MMTV-PyMT mouse model recapitulates breast cancer progression and spontaneous lung metastasis. Other techniques that recapitulate metastatic spread are also available, e.g., orthotopic transplantation of cells in the mammary gland20. An intravenously injected VO-PyMT cell line is used to mimic seeding and outgrowth of breast cancer metastasis. The time allowance for VO-PyMT cell outgrowth depends on the experimental preference for the stage of lung metastasis. Depending on the number of injected cells, micrometastases can be observed within several days to 2 weeks after VO-PyMT cell injection.
For optimal lung imaging, great care must be taken during the inflation of the lungs. For proper inflation, the needle should only be inserted 4-5 mm into the trachea. Deeper insertion of the needle can result in partial, one-sided inflation of the lungs. In addition, the lungs should be watched during the actual inflation to prevent over-inflation that may result in tissue damage. Furthermore, it is crucial to keep the lung as sterile as possible so that the immune cells in the lung will not be challenged.
For each live imaging experiment, the optimal balance between the amount of data acquisition and the potential of tissue damage caused by excessive laser exposure needs to be considered. It is important to optimize the settings for image acquisition by running pilot experiments. Also, it is recommended to keep the laser power down while searching for optimal fields of view and/or to keep the shutter off when images are not acquired.
The motility of the cancer and/or immune cells of interest is one of the indicators for cell vitality. Motility is sensitive to temperature, oxygen levels, and phototoxicity7. However, the inhibition or lack of motility may not be related to imaging conditions or technical issues but rather biological. Inhibition of motility may result from a certain therapeutic effect or from the arrest of metastatic cells just prior to their proliferation within the microvasculature of the lung and their extravasation into the lung parenchyma21,22. It may therefore be important to corroborate such data using additional techniques (as migration assays in 2D culture)23.
Moreover, this ex vivo lung imaging method is sufficient for a short-term study that does not require lung microcirculation. Using this method, movement of cancer and/or immune cells is observed for at least 4 hr. Prior to image acquisition, it takes about 30 min to prepare the lungs and 30-60 min to find positions for acquisition. Although cell motility is observed beyond 4 hr (up to 11 hr, Movie 3), prolonged imaging depends on the particular cell types studied, the conditions used (e.g., reduced oxygen), and should be determined for a particular experimental setup. Furthermore, due to the lack of microcirculation and the possible impact of postmortem changes or in case there is a rationale for a need to verify the results in the presence of an intact microcirculation, the lung intravital imaging with a thoracic suction window can be utilized. However, it is still a challenge to perform intravital lung imaging across multiple days using an imaging window as performed in brain, mammary gland and abdominal organs5 due to difficulties in maintaining sufficient negative pressure. As an alternative method for perfusion of intact ex vivo lungs, the isolated-perfused lung method was previously used to study pulmonary metastasis. However, this method is often used for larger animals. Since mice have smaller thoracic cavities, they pose a real challenge for effective perfusion24.
Owing to light scattering, the imaging depth of the spinning-disk confocal microscopy is limited. As a consequence, visualization of cell dynamics and cellular interactions is restricted to superficial lung metastasis. Pulmonary metastases are enriched in the lung periphery since metastatic cells are confined by the capillaries which diminish in size toward the outer margins of the lung1. Moreover, it is easier to maintain the viability of the cells closer to surface of the lung as they have preferred access to media and oxygen. To allow deeper visualization into the lungs, live imaging of lung sections can be performed. However, considerable amount of cell death should be expected. Alternatively, multiphoton microscopy can be conducted, allowing greater tissue penetration. In addition, multiphoton imaging generates an intrinsic optical signal, called second-harmonic generation (SHG), which allows the visualization of non-centrosymmetric structures in the extracellular matrix, such as collagen 1 fibers.
As shown in this study, tumor and immune cell behavior in lung metastases can be followed and analyzed using fluorescent reporter mice, manipulated tumor cells and fluorescently labeled tracers or antibodies. This methodology could be modified for the study of other cells and determinants within the metastatic microenvironment. To this end, there are various transgenic reporter mice available for stromal cell study including those for fibroblasts as FSP1-EGFP4, alpha-SMA-RFP25 and Col1a1-EGFP25 or endothelial cells as Tie2-GFP26.
Cell staining on live lung sections has been performed to visualize immune cell populations8. This staining strategy can be adopted as an alternative for multi-color image capture. However, majority of markers often label multiple cell populations instead of a distinct cell population. Injectables that are taken up by specific cell populations4 or fluorescently labeled antibodies against additional cell markers can be used to further differentiate between populations. The usage of different fluorescent colors to label the various cells of interest is preferred for imaging. In cases where the use of different fluorescent dyes cannot be performed (e.g., due to limited imaging channels), it is possible to image different cell types with same fluorescent reporters as long as they are easily distinguishable by shape and/or anatomical localization.
In addition to studying various cell types, several classes of chemotherapeutics are weakly fluorescent (such as doxorubicin). These chemotherapeutics can in principle be used to visualize drug delivery and distribution in lung metastasis in a similar fashion as in primary tumor19. Other targeted therapeutics that could be fluorescently labeled may also be used in ex vivo lung imaging. Notably, the data acquired with the lung imaging could be more informative about which cells take-up these drugs and their interaction with other cells within the metastatic microenvironment in addition to the extravasation of these therapeutics from active blood vessels. This technique can be further used for the study of primary lung cancer27 or adapted for the study of other lung-related pathologies that may affect the lung microenvironment28,29.
Subscription Required. Please recommend JoVE to your librarian.
Disclosures
The authors have no conflicts of interest to disclose. All animal experiments were conducted in accordance with IACUC approved protocols, UCSF.
Acknowledgments
We thank Nguyen H. Nguyen for her technical help and Audrey O’Neill for support with the Zeiss Cell Observer spinning-disk confocal microscope. This work was supported by a Department of Defense postdoctoral fellowship (W81XWH-11-01-0139) and the Weizmann Institute of Science-National Postdoctoral Award Program for Advancing Women in Science (to V.P.).
Materials
| Name | Company | Catalog Number | Comments |
| MMTV-PyMT/FVB mice | Jackson Laboratory | 2374 | Female mice |
| ACTB-ECFP/FVB mice | UCSF Werb lab | Female mice | |
| c-fms-EGFP/FVB mice | UCSF Werb lab | Female mice | |
| FVB mice | Jackson Laboratory | 1800 | Female mice |
| GFP+ VO-PyMT cells | UCSF Werb lab | ||
| 70,000 kDa Dextran, rhodamine-conjugated | Invitrogen | D1818 | Dilute to 4mg/ml in 1 x PBS and store at -20 °C. Use 0.4 mg per animal. |
| 10,000 kDa Dextran, Alexa Fluor 647 conjugated | Invitrogen | D22914 | Dilute to 4mg/ml in 1 x PBS and store at -20 °C. Use 0.4 mg per animal. |
| Anti-mouse Gr-1 antibody Alexa Fluor 647 | UCSF Monoclonal antibody core | Stock 1mg/ml. Use 7 ug per animal. | |
| Anesthetic | Anesthesia approved by IACUC, used for anesthesia and/or euthanesia | ||
| 1X PBS | UCSF cell culture facility | ||
| PBS, USP sterile | Amresco INC | K813-500ML | Ultra pure grade for i.v. injection |
| Styrofoam platform | Will be used as dissection board | ||
| Fine scissors sharp | Fine Science Tools | 14060-11 | |
| Forceps | Roboz Surgical Store | RS-5135 | |
| Hot bead sterilizer | Fine Science Tools | 18000-45 | Turn ON 30min before use |
| Air | UCSF | ||
| Oxygen | UCSF | ||
| Carbon dioxide | UCSF | ||
| 1 mL syringe without needle | BD | 309659 | |
| 27 G x 1/2 needle | BD | 305109 | for i.v. injection |
| 20 G x 1 needle, short bevel | BD | 305178 | |
| Low-melting-temperature agarose | Lonza | 50111 | To make 10 ml of solution, weigh 0.2 g of agarose, add to 10 ml 1 x PBS, and heat to dissolve. Agarose will solidify at room temperature, so maintain in a 37 °C water bath until used for inflation. |
| RPMI-1640 medium without phenol red | Life Technologies | 11835-030 | |
| 24 well Imaging plate | E&K scientific | EK-42892 | |
| Glass cover slides, 15 mm | Fisher Scientific | 22-031-144 | |
| Digital CO2 and temperature controller | Okolab | DGTCO2BX | http://www.oko-lab.com |
| Climate chamber | Okolab | http://www.oko-lab.com | |
| Cell Observer spinning disk confocal microscope | Zeiss | ||
| Zen software | Zeiss | ||
| Inverted microscope | Carl Zeiss Inc | Zeiss Axiovert 200M | |
| ICCD camera | Stanford Photonics | XR-Mega-10EX S-30 | |
| Spinning disk confocal scan-head | Yokogawa Corporation | CSU-10b | |
| Imaris | Bitplane | ||
| mManager | Vale lab, UCSF | Open-source software |
References
- Chaffer, C. L., Weinberg, R. A. A perspective on cancer cell metastasis. Science. 331 (6024), 1559-1564 (2011).
- Plaks, V., Kong, N., Werb, Z. The cancer stem cell niche: how essential is the niche in regulating stemness of tumor cells. Cell stem cell. 16 (3), 225-238 (2015).
- Nguyen, D. X., Bos, P. D., Massague, J. Metastasis: from dissemination to organ-specific colonization. Nat Rev Cancer. 9 (4), 274-284 (2009).
- Egeblad, M., Ewald, A. J., et al. Visualizing stromal cell dynamics in different tumor microenvironments by spinning disk confocal microscopy. Dis Model Mech. 1 (2-3), 155-167 (2008).
- Ellenbroek, S. I. J., van Rheenen, J. Imaging hallmarks of cancer in living mice. Nat Rev Cancer. 14 (6), 406-418 (2014).
- Looney, M. R., Thornton, E. E., Sen, D., Lamm, W. J., Glenny, R. W., Krummel, M. F. Stabilized imaging of immune surveillance in the mouse lung. Nat Methods. 8 (1), 91-96 (2011).
- Thornton, E. E., Krummel, M. F., Looney, M. R. Live imaging of the lung. Cur Protoc Cytom. , (2012).
- Thornton, E. E., Looney, M. R., et al. Spatiotemporally separated antigen uptake by alveolar dendritic cells and airway presentation to T cells in the lung. J Exp Med. 209 (6), 1183-1199 (2012).
- Mendoza, A., Hong, S. -H., et al. Modeling metastasis biology and therapy in real time in the mouse lung. J Clin Invest. 120 (8), 2979-2988 (2010).
- Lelkes, E., Headley, M. B., Thornton, E. E., Looney, M. R., Krummel, M. F. The spatiotemporal cellular dynamics of lung immunity. Trends Immunol. 35 (8), 379-386 (2014).
- Guy, C. T., Cardiff, R. D., Muller, W. J. Induction of mammary tumors by expression of polyomavirus middle T oncogene: a transgenic mouse model for metastatic disease. Mol Cell Biol. 12 (3), 954-961 (1992).
- Hadjantonakis, A. -K., Macmaster, S., Nagy, A. Embryonic stem cells and mice expressing different GFP variants for multiple non-invasive reporter usage within a single animal. BMC Biotechnol. 2, (2002).
- Casbon, A. -J., Reynaud, D., et al. Invasive breast cancer reprograms early myeloid differentiation in the bone marrow to generate immunosuppressive neutrophils. Proc Natl Acad Sci USA. 112 (6), 566-575 (2015).
- Donovan, J., Brown, P. Parenteral injections. Curr Protoc Immunol. , (2006).
- Halpern, J., Lynch, C. C., et al. The application of a murine bone bioreactor as a model of tumor: bone interaction. Clin Exp Metastas. 23 (7-8), 345-356 (2006).
- Sasmono, R. T., Oceandy, D., et al. A macrophage colony-stimulating factor receptor-green fluorescent protein transgene is expressed throughout the mononuclear phagocyte system of the mouse. Blood. 101 (3), 1155-1163 (2003).
- Ewald, A. J., Werb, Z., Egeblad, M. Dynamic, long-term in vivo imaging of tumor-stroma interactions in mouse models of breast cancer using spinning-disk confocal microscopy. Cold Spring Harb Protoc. (2), (2011).
- Bonnans, C., Lohela, M., Werb, Z. Real-time imaging of myeloid cells dynamics in ApcMin/+ intestinal tumors by spinning disk confocal microscopy. J Vis Exp. (92), (2014).
- Nakasone, E. S., Askautrud, H. A., et al. Imaging tumor-stroma interactions during chemotherapy reveals contributions of the microenvironment to resistance. Cancer cell. 21 (4), (2012).
- Cheng, N., Lambert, D. L. Mammary transplantation of stromal cells and carcinoma cells in C57BL/6J mice. J Vis Exp. (54), (2011).
- Al-Mehdi, A. B., Tozawa, K., Fisher, A. B., Shientag, L., Lee, A., Muschel, R. J. Intravascular origin of metastasis from the proliferation of endothelium-attached tumor cells: a new model for metastasis. Nat Med. 6 (1), 100-102 (2000).
- Wong, C. W., Song, C., et al. Intravascular location of breast cancer cells after spontaneous metastasis to the lung. Am J Pathol. 161 (3), 749-753 (2002).
- Liang, C. -C., Park, A. Y., Guan, J. -L. In vitro scratch assay: a convenient and inexpensive method for analysis of cell migration in vitro. Nat protoc. 2 (2), 329-333 (2007).
- Nelson, K., Bobba, C., Ghadiali, S., Hayes, D. J., Black, S. M., Whitson, B. A. Animal models of ex vivo lung perfusion as a platform for transplantation research. World J Exp Med. 4 (2), (2014).
- Magness, S. T., Bataller, R., Yang, L., Brenner, D. A. A dual reporter gene transgenic mouse demonstrates heterogeneity in hepatic fibrogenic cell populations. Hepatology. 40 (5), 1151-1159 (2004).
- Motoike, T., Loughna, S., et al. Universal GFP reporter for the study of vascular development. Genesis. 28 (2), (2000).
- Srivastava, M. K., Andersson, A., et al. Myeloid suppressor cells and immune modulation in lung cancer. Immunotherapy. 4 (3), (2012).
- Craig, A., Mai, J., Cai, S., Jeyaseelan, S. Neutrophil recruitment to the lungs during bacterial pneumonia. Infect Immun. 77 (2), 568-575 (2009).
- Kreisel, D., Nava, R. G., et al. In vivo two-photon imaging reveals monocyte-dependent neutrophil extravasation during pulmonary inflammation. Proc Natl Acad Sci USA. 107 (42), 18073-18078 (2010).
