

Summary
A method for the functionalization of carbon nanotubes with structure-tunable polymeric encapsulation layers and structural characterization using small-angle neutron scattering is presented.
Abstract
We demonstrate a protocol for single-walled carbon nanotube functionalization using thermo-sensitive PEO-PPO-PEO triblock copolymers in an aqueous solution. In a carbon nanotube/PEO105-PPO70-PEO105 (poloxamer 407) aqueous solution, the amphiphilic poloxamer 407 adsorbs onto the carbon nanotube surfaces and self-assembles into continuous layers, driven by intermolecular interactions between constituent molecules. The addition of 5-methylsalicylic acid changes the self-assembled structure from spherical-micellar to a cylindrical morphology. The fabricated poloxamer 407/carbon nanotube hybrid particles exhibit thermo-responsive structural features so that the density and thickness of poloxamer 407 layers are also reversibly controllable by varying temperature. The detailed structural properties of the poloxamer 407/carbon nanotube particles in suspension can be characterized by small-angle neutron scattering experiments and model fit analyses. The distinct curve shapes of the scattering intensities depending on temperature control or addition of aromatic additives are well described by a modified core-shell cylinder model consisting of a carbon nanotube core cylinder, a hydrophobic shell, and a hydrated polymer layer. This method can provide a simple but efficient way for the fabrication and in-situ characterization of carbon nanotube-based nano particles with a structure-tunable encapsulation.
Introduction
Carbon nanotubes (CNTs) are hollow cylindrical nanoparticles formed by rolling a micrometer-scale graphite sheet into a nanotube. Because of their extraordinary mechanical, thermal, and electrical properties, CNTs have been extensively investigated as a novel candidate for functional nanoparticles in therapeutic and bio-sensing applications as well as nano-fillers in self-assembled nanocomposite materials.1-3 However, their poor solubility and strong preference toward making bundles in commonly used organic and aqueous solvents hinder easy and environmentally-friendly processing as well as advances in biological applications. Therefore, a variety of functionalization methods, such as ultra-sonication, chemical surface modification, and non-covalent functionalization by using surfactants and block copolymers,4-9 have been developed to modify the CNT surfaces and improve their dispersibility in a wide range of solvents. Non-covalent functionalization methods based on physical surface treatments, in particular, are considered to be a promising and robust strategy, because any surface-modification induced suppression in intrinsic CNT properties can be minimized.10 To date, there have been numerous efforts to improve the dispersion efficiency of non-covalent functionalization methods by employing various types of dispersive agents including basic surfactants (e.g., SDS, CTAB, NaDDBS),7,11 amphiphilic block copolymers,8 bio-materials (e.g., DNA),12,13 and synthetic functional polymers (e.g., conjugated polymer, aromatic polymer).14,15
PEO-PPO-PEO polymers, a kind of triblock copolymer consisting of two hydrophilic poly(ethylene oxide) (PEO) chains at both ends covalently bound to one hydrophobic poly(propylene oxide) (PPO) chain at the center, can extend the potential application of non-covalently functionalized CNTs in aqueous solution. These polymers provide the interface, which is friendly not only to the CNT surfaces but also to aqueous media and other polymer matrices and exhibits tremendous biocompatibility due to the minimal toxicity of the PEO chains. This facilitates easier processing in a wide range of dispersing environments as well as the utilization of polymer-coated CNTs in biomedical applications.12,16-17 Moreover, the rich thermodynamic phase behavior of these polymers based on their sensitive responses to external stimuli enables the fabrication of the smart block copolymer-CNT hybrid nanostructures in which intra- and inter-particle structures can be reversibly and precisely controlled.18-21 Here, we present a protocol for the fabrication of CNT-based hybrid nanoparticles with a tunable encapsulation layer of PEO105-PPO70-PEO105 (poloxamer 407). The resulting structure is characterized by small-angle neutron scattering (SANS). This work is expected to introduce the concept of smart functional building blocks and help non-specialists easily prepare block copolymer-functionalized CNT suspensions and use SANS for the detailed characterization at Oak Ridge National Laboratory.
Subscription Required. Please recommend JoVE to your librarian.
Protocol
Note: This protocol requires special care in the handling of nanomaterials. As-purchased single-walled carbon nanotubes (SWNTs) exist in the form of fine powder and thus, they should be considered as nano-hazardous materials before dispersing them in aqueous solutions. Please use appropriate safety equipment described in the material safety data sheets (MSDS).
1. Preparation of Poloxamer 407/SWNT Aqueous Suspensions
Note: Proceed with all the sample preparation procedures at a lower temperature than the critical micellization temperature (CMT) of the block copolymers used. The poloxamer 407/SWNT samples were prepared at 20 °C, below the CMT of poloxamer 407 (30 °C).21
- Preparation of Poloxamer 407 aqueous solutions (0.25% w/w)
- Completely dissolve 0.175 g of poloxamer 407 powder in 70 g D2O.
Note: D2O is used for SANS measurements. 70 g D2O is approximately 63.2 ml at room temperature. For other purposes, H2O is recommended for use.
- Completely dissolve 0.175 g of poloxamer 407 powder in 70 g D2O.
- Preparation of crude Poloxamer 407/SWNT suspensions
- Add 0.01 g SWNT powder to two 50 ml conical centrifuge tubes (tube 1 and tube 2) separately.
- Add 31.6 ml of the poloxamer 407 solution (1.1.1), into the tube 1 and 31.6 ml of the remaining solution into the tube 2.
- Mix the suspensions in the tube 1 and 2 by vortex-mixing for 5-10 min.
- Place the tube 1 in a water bath. Fix the tube position securely. (Figure 1) Dip the tube until the air-suspension interface reaches the surface of water in the bath.
- Dip the tip of an ultrasonicator into the suspension of the tube 1. Increase the sonication power gradually from 0% at least until the SWNTs deposited at the bottom of the tube start shattering and spreading due to the ultrasound propagated from the ultrasonicator tip. Treat the suspension with ultrasound for 60 min at 20 °C, while keeping the suspension temperature below 25 °C.
Note: Do not put the tip end deeper than 1 cm into the suspension. Keep the suspension temperature below 25 °C, either by controlling the temperature of the water reservoir or by refilling the bath appropriately. - Repeat steps 1.2.4 and 1.2.5 for the tube 2.
- Preparation of Poloxamer 407/SWNT suspensions in the absence and presence of 5-Methylsalicylic acid
- Centrifuge the crude suspensions in tubes 1 and 2 at 9,800 × g for 2 hr at 20 °C.
- Move 15 ml of the supernatants from each tube to a new tube, separately.
- Dissolve 0.015 g of 5-methylsalicylic acid (5MS) into the supernatant taken from tube 2, and label this mixture as Sample #2. Label the other supernatant from the tube 1 as Sample #1.
2. Extended Q-range Small-angle Neutron Scattering (EQ-SANS) Measurements
Note: To work at the beamlines of Spallation Neutron Source (SNS), an accepted beamtime proposal is required. Radiological safety training and other instrument specific training are also required in advance. Access and training details are provided by the SNS User Office and can be found at neutrons.ornl.gov.
- Sample loading
- Load 0.3 ml of Sample #1 of into an amorphous quartz banjo cell and Sample #2 into another banjo cell (Figure 2A-i). Put lids on the two cells and seal them by wrapping tape securely around the lids.
- Place one of the sealed cells between spacers (Figure 2A-ii) for an aluminum cell holder (Figure 2A-iii), and assemble the aluminum banjo cell holder (Figure 2B). Assemble the other cell with a different set of banjo cell holder in the same manner.
- Load the assembled cells into different sample positions of the EQ-SANS sample paddle (Figure 3A). Make the list of the sample positions of the paddle.
- Measurements
- Set the configurations for the SANS measurements in a script with the help of an instrument scientist, referring to the given example script.
Note: An example of the script used during the actual SANS measurements is provided in the supplementary material with brief comment. This example is specifically designed for SANS measurements of two samples (sample #1 and #2) using a wavelength band of 9.1 Å < λ < 13.2 Å at the fixed 1.3 m sample-to-detector distance with a 10 mm sample aperture and a 30 mm beam stop. The example script can be used without any modification for the sample #1 and #2.- To cover a q-range of 0.01 - 0.4 Å-1, select a wavelength band of 9.1 Å < λ < 13.2 Å and a sample-to-detector distance of 1.3 m by inputting 1300 into detector position and 9 into wavelength as shown in the example script.
- To use a 10 mm sample aperture and a 30 mm beam stop, set x-y positions of the beam stops and apertures in the script.
- Set the sample positions and the corresponding names for both transmission and sample scattering measurements.
- Save the script in the folder corresponding to the beam time.
- Execute the script to perform measurements by clicking on 'Run Script' on the right side of the PyDAS control window (Figure 3B) and loading the saved script.
- Inform the instrument team of the completion of measurements after the experiment is finished.
- Set the configurations for the SANS measurements in a script with the help of an instrument scientist, referring to the given example script.
3. SANS Data Reduction and Analysis
- SANS Data reduction process
- For the reduction of the measured data, use MantidPlot23-24 software provided at analysis.sns.gov, with the help of the instrument team.
Note: Detailed instructions to run MantidPlot software can be found at analysis.sns.gov webpage. - Within MantidPlot, open the EQSANS reduction interface from the interfaces menu. (interface>SANS>ORNL SANS). Input all necessary information for the data reduction process.
Note: Most of important information in the data reduction process is provided by the instrument team. For information, relevant screenshots are also provided in the supplementary materials. - Input all necessary information in the 'Reduction Options' tab.
- Input the absolute scale factor from the standard sample measurement. Obtain the absolute intensity from the measurement of a well characterized standard sample whose scattering intensity is known (I(0)=450 cm-1) and fit with a Debye-Buche scattering model.
- Input the dark current file name, which is provided by the instrument team.
- Check options for the 'solid angle correction', 'Q resolution', 'use configuration file', 'Correct TOF', and 'user mask from configuration file as applicable'.
- Set sample aperture diameter to 10 mm. Set number of Q bins to 200 with a linear Q binning scheme. Input the mask file name, which is also provided by the instrument team.
- Input all necessary information to complete the 'Detector' tab.
- Check 'Use beam finder' (with fit direct beam option) and 'perform sensitivity correction'. Find a beam center 'data file' using the run number of the empty beam measurement.
- Input the sensitivity data file name, which is provided by the instrument scientist. Set the allowed sensitivity range to 0.5 and 2.5 for the min and max, respectively. Check 'Use sample beam center'.
- Input all necessary information for the 'Data' tab.
- Enter sample scattering run number at 'Scattering data file'. Specify the sample thickness in cm. Select 'Calculate transmission'.
- Enter the sample transmission run number at 'Sample direct beam data file'. Enter empty beam run number at 'Empty direct beam data file'.
- Check 'Background data file' and enter background scattering run number. Select 'Calculate transmission'. Enter background transmission run number at 'Sample direct beam data file'.
Note: In this case, the empty banjo cell scattering data file is the background scattering. - Enter empty beam run number at 'Empty direct beam data file'. Typically, this number is same as the empty beam run number (3.1.5.2).
- Click on 'Reduce' to execute the data reduction.
Note: The output is written in the designated folder as #####_Iq.txt where ##### is the run number of the sample scattering file. ASCII format is used for the data files.
- For the reduction of the measured data, use MantidPlot23-24 software provided at analysis.sns.gov, with the help of the instrument team.
- Model fitting analysis
Note: SasView is a small-angle scattering analysis software package, which was originally developed as part of the NSF DANSE project, and is currently managed by an international collaboration of facilities (http://www.sasview.org/). The software package can be downloaded at http://sourceforge.net/projects/sasview/files/.- Run SasView, and load a data file by clicking on 'Load Data' from the 'Data Explorer' window.
- Click on 'Send To' with the 'Fitting' option, and check the data plot on the popup window.
- In the 'Fit Panel', select "Shapes" under the model category, and choose "CoreShellCylinderModel" from the model drop box.
- Adjust the parameter values, so the model curve is as close to the data curve as possible.
Note: Use the SLD (scattering length density) calculator from the Tool menu to calculate scattering length densities. - Select "Use dQ data" and "Use dI Data" in the Fitting panel. Adjust Q range of the data for fitting. Click on 'Fit' to execute data fitting.
4. Real-space Observation Using Atomic Force Microscopy (AFM)
- Sample preparation on Si-wafers using spin coating
- For AFM measurements, take 0.1 ml sample solution from the Sample #1 (1.3.3), and mix it with 1.9 ml de-ionized water.
- Place a clean Si-wafer (12 mm × 12 mm) on a spin coater. Fix the wafer position using a vacuum chuck.
- Set the rotation speed and the running time at 1,500 revolutions per minute (rpm) and 60 sec, respectively. Wet the exposed surface of the wafer with the diluted sample. Start spin coating.
- Turn off the vacuum pump, and remove the coated wafer from the spin coater.
- AFM measurements
- Attach the spin-coated wafer (4.1.4) on an iron disk using a double-sided adhesive carbon tape.
- Bring the specimen disk (4.2.1) closer to the edge of the exposed area of the scanner first, and slide the disk toward the center until the bottom surface of the disk completely covers the top of the scanner.
Note: Avoid sudden contact because a magnet on the top of the scanner strongly attracts the iron disk. Gently make a contact between two edges of the disk and the scanner. - Mount the scanning probe microscope (SPM) head on the scanner, and plug in the cable.
Note: Extreme care has to be paid while moving the SPM head or docking (removing) it to (from) the scanner. When the head is detached from the scanner stage, keep the bottom surface of the head facing upwards all the time. - Run the instrument-supplied control software, and select the tapping mode in the 'System Configuration' window.
- Place the cantilever tip at the center of the monitor window by adjusting the coarse and fine knobs of the optical microscope and by moving the x- and y- optical stages.
- Align the laser by adjusting the laser alignment knobs on the SPM head. Locate the red laser dot to the cantilever roughly, and move the dot to the middle of the cantilever tip by tracing the dot shown in the monitor.
Note: When the laser is properly aligned, the pink reflection spot appears on the laser alignment window. - Align the detector by locating the pink reflection image at the center of the laser alignment window. Adjusting the photodetector knobs on the SPM head until the quadrant photodiode (QPD) signal sum is greater than 2 V at least (2.1 - 2.4 V).
- Tune the cantilever using AutoTune in the Cantilever Tuning window. Run AutoTune in a frequency range of 0 - 1,000 kHz.
- Bring the wafer surface into focus of the microscope by adjusting the focus knobs.
- Drive the cantilever tip slowly toward the wafer surface using the up and down arrows in the 'Motor Stage' window. Stop the movement before the tip touches the sample surface.
Note: As the tip approaches the wafer, the blurred black image of the tip appears in the monitor and the image becomes clear when the tip and the wafer surface make contact. Never let the tip physically touch the specimen. It damages both sample and instrument. Stop the tip when the dark blurred image is shown. - Click on the engage button on the toolbar.
- Select a scan size (5-10 µm), a sampling number (512-1,024), and a scan rate (0.5-0.6 Hz) in the popup window, in order to acquire a large-scale image first.
- Start scanning. Gradually adjust P (proportional gain), I (integral gain), and D (vertical deflection) values if the contrast between the particles and the substrate background is too low to clearly recognize particle shapes and boundaries from the scanned image.
Note: When a new PID value set is entered, the scanning process will be automatically restarted. - If there is any region of interest in the large-scale image, re-run the scan with a proper set of scan size, x-offset, y-offset, and sample number.
- Disengage the probe after measurement.
Note: Raise the probe head to prevent any damage on the cantilever tip and the sample. Remove the probe head first, and then, detach the specimen disk.
Subscription Required. Please recommend JoVE to your librarian.
Representative Results
Poloxamer 407-coated SWNT nanorod suspensions were fabricated using the sample preparation procedure (Figure 4), which can be divided into two important processes; the physical adsorption process of poloxamer 407 on SWNT surfaces using ultra-sonication, and the fractionation process of individually-stabilized SWNTs from bundled aggregates using centrifugation.
The SANS scattering intensities were obtained for the prepared poloxamer 407/SWNT/D2O sample in a temperature range of 20-60 °C in the absence (Figure 5A) and presence (Figure 5B) of 5MS. The scattering intensities with the q-1 behavior in the low q regions (< 0.02 Å-1) indicate the existence of cylindrical rod-like particles in the aqueous media. By changing the temperature from 20 °C to 60 °C or by adding 5MS additives, the scattering intensities show clear changes; a shift to higher q in the intermediate q-region (0.02-0.05 Å-1) and the development of a peak at high q (about 0.11 Å-1) are observed. These analogous changes due to temperature-control and 5MS-addition originate from the structural change of poloxamer 407-encapsulation layer on SWNTs. As summarized in Figure 6A-6D, the CNT core/hydrophobic inner shell/hydrated poloxamer 407 layer undergoes a structural transformation from an SWNT encapsulated by spherical micelles of poloxamer 407 at room temperature to an SWNT encapsulated by a compact cylindrical layer of poloxamer 407 at higher temperature. The structural change was reversible with varying temperature regardless of the existence of 5MS additives; the size of hydrated polymer blobs was reversibly controlled in a temperature range between 20 °C and 60 °C. During this structural change of the poloxamer 407 layer, the spherical poloxamer 407 micelle with a radius of gyration of 45 Å, which consists of several poloxamer 407 chains, becomes a set of single-chain blobs which surround the SWNT core more compactly with a radius of gyration of 30 Å.
The structural change upon both temperature control and aromatic additives is explicable by variations in intermolecular interactions among polymers, water, and SWNTs. Increasing hydrophobicity of PPO and PEO blocks with increasing temperature causes stronger interaction of adsorbed polymers with SWNT core surfaces than with water.21 As a result, the adsorbed polymers form more compact encapsulation layer at high temperature to cover the hydrophobic core more efficiently and reduce the interfacial free energy. This tendency can be more promoted in the presence of 5MS, because of the preferential interaction between SWNT and a benzene ring of 5MS as well as the strong tendency of 5MS to bind with poloxamer 407.21,22 Especially, the inner shell thickness (Figure 6B), which was measured to be about 3 Å close to the planar distance between 5MS molecules and SWNT surfaces,21 is in good agreement with the prediction that the added 5MS prefer to occupy the SWNT surface area and provide a friendly interface to the polymers.
As a complementary investigation to the SANS study, the poloxamer 407/SWNT nanorods were observed in real space using an AFM. Figures 7A and 7B are tapping mode AFM images of poloxamer 407/SWNT nanorods which were spin-coated onto a Si-wafer. Although these AFM images only show a dried morphology of the nanorods without water, they provide evidence of de-bundling and dispersion of SWNTs as well the length distribution of the nanorods.

Figure 1. Snapshot of the ultrasonication process for SWNT stabilization. A sample tube is put into a water bath with the tip dipped in. Please click here to view a larger version of this figure.

Figure 2. Aluminum banjo cell holder for the EQ-SANS experiment at SNS. (A) Disassembled parts including (i) a banjo cell (ii) spacers, and (iii) a holder. (B) Assembled parts. Please click here to view a larger version of this figure.
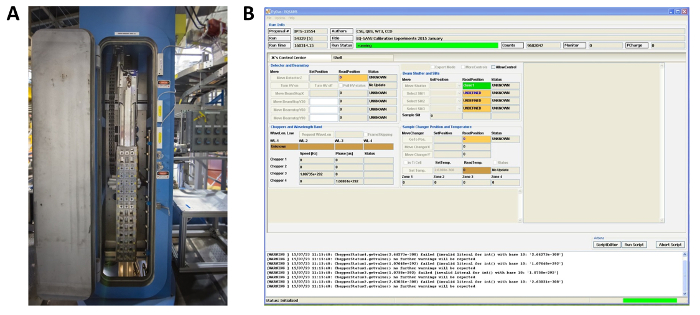
Figure 3. Standard EQ-SANS experiment environments. (A) Sample booth, and (B) control software at the beam line. Please click here to view a larger version of this figure.

Figure 4. Simplified sample preparation procedure for Poloxamer 407/SWNT (sample #1) and Poloxamer 407/SWNT/5MS (sample #2) suspensions. The mass ratio between SWNTs and Poloxamer 407 in these final suspensions was measured by thermogravimetric analysis (TGA) after freeze-drying (*). (This figure has been modified with permission from ref. 21. Copyright 2015, American Chemical Society.) Please click here to view a larger version of this figure.

Figure 5. SANS intensities measured in a temperature range from 20 °C to 60 °C. (A) Poloxamer 407/SWNT/D2O sample. (B) Poloxamer 407/SWNT/5MS/D2O sample. The solid lines are the curves obtained by fitting the SANS data using a modified core/shell/chain model. The q-1 behavior at low q regions around 0.01 Å-1 indicates the existence of rod-like particles in the suspensions. The curves have been shifted for clarity. (This figure has been modified with permission from ref. 21. Copyright 2015, American Chemical Society.) Please click here to view a larger version of this figure.

Figure 6. Detailed structures of encapsulation layers from a SANS model fit analysis. (A) Radius of gyration (Rg) of poloxamer 407 chain blobs and (B) thickness of hydrophobic inner shell layers (T1) on SWNT surfaces in the absence (diamond) and presence (square) of 5-Methylsalicylic acid (5MS) in a temperature range from 20 °C to 60 °C. Rg was reversibly changed by controlling temperature via heating (filled marker) and cooling (filled marker with a cross inside) processes regardless of the existence of 5MS. (C-D) Schematic cross-sectional diagrams suggested from SANS analysis for the poloxamer 407/SWNT nanorods at room temperature (top) and its structural changes with increasing temperature or adding additives (bottom). (This figure has been modified with permission from ref. 21. Copyright 2015, American Chemical Society.) Please click here to view a larger version of this figure.

Figure 7. Tapping mode AFM images of spin-coated Poloxamer 407/SWNT nanorods on Si-wafer. (A) The height channel image provides the z-directional thickness information. (B) The tapping amplitude channel image presents clear boundaries of deposited nanoparticles. Scale bar: 1 µm. (This figure has been modified with permission from ref. 21. Copyright 2015, American Chemical Society.) Please click here to view a larger version of this figure.
Subscription Required. Please recommend JoVE to your librarian.
Discussion
SANS and AFM measurements showed that SWNTs have been successfully de-bundled and individually dispersed in aqueous solution using a poloxamer 407 triblock copolymer. In this sample preparation method, ultra-sonication and centrifugation processes are the critical steps determining the characteristics of the final suspension. The strong interaction between the SWNTs, which forces uncoated SWNTs to bundle together in solution, must be overcome to stabilize the individual SWNTs with block copolymers. Providing a sufficient energy for a properly long time allows the polymers to overcome the energy barriers and stabilize the SWNT successfully. Nevertheless, it is too difficult to remove all the SWNT bundles in the suspension and thus, the fractionation process is also crucial to produce high purity and quality samples. Optimization in the sonication power, the centrifugation speed, and the collecting volume of supernatant is required if any improvement in the sample purity and yield rate is needed.
Using this method, thermo-reversible CNT/polymer nanoparticles of various sizes can be fabricated by varying the molecular weight of the triblock copolymer. It has been predicted that the stabilization of carbon nanotubes using amphiphilic block copolymers shows size selectivity so that carbon nanotubes with a specific diameter can be selectively solubilized.25 In this work, SANS analysis reveals that the SWNT core in the synthesized nanorods has a diameter of about 7.2 Å on average. This implies that poloxamer 407 could even solubilize SWNTs with a relatively small diameter around 7-8 Å among HiPCo (high-pressure carbon monoxide) SWNTs, which are known to have a diameter of 7-14 Å.26 Therefore, a rational selection of molecular weight and the PEO/PPO mass ratio in the PEO-PPO-PEO polymers enables researchers not only to utilize either single-walled or multi-walled carbon nanotubes regardless of their diameter but also to size-selectively fabricate polymer-CNT hybrid nanorods via this strategy.
Although a variety of PEO-PPO-PEO polymer-coated CNT nanorods can be prepared through the identical preparation procedure, the methods for characterization of the detailed structure in real space are quite limited. Commonly-used optical microscopy instruments are not appropriate because of the very small particle size. Electron microscopy (EM) and AFM techniques also have limitations. Solvent evaporation required in dry-EM and AFM techniques prevents the in-situ characterization and may cause a morphology change, and temperature quenching in cryo-EM prevents the real-time observation with temperature control. Thus, the structural characterization in q-space using small-angle scattering techniques is essential in this system, and it is also more powerful if any other real-space observation can be provided as a complementary approach.
Nevertheless, for this characterization method via SANS, there are two things to consider. First, the set of fitting parameters from SANS analysis may not be unique because there are uncertainties in SLDs. The obtained results should be consistent with other physical measurements as well as the amount and SLDs of the constituents. Second, this investigation is based on model-dependent analysis and thus, the fitting model should be chosen by carefully considering the inter-molecular interaction as well as possible macro-molecular geometries. The CoreShellCylinder model introduced in this protocol is one of the simplest models, which is appropriate for describing polymer-coated CNT structures. Although the CoreShellCylinder model provides information about the core and shell thicknesses of the synthesized nanorods, the oversimplified form factor in this model is not able to describe the actual distribution profiles of water and polymers surrounding the CNT core. For a better understanding, the modified CoreShellCylinder model, which employs the Gaussian chain model for the adsorbed polymers, is recommended.21
Through this work, it is demonstrated that the synthesized hybrid nanoparticles exhibit a sensitive temperature-dependent response of their encapsulation structure. These systems present an interesting model for smart functional building blocks which self-assemble into higher-ordered nanostructures and whose intra- and inter-particle structures are reversibly controlled as a response to external stimuli. While the technique presented lends itself to producing well-ordered, self-assembled systems, there are still challenges to be overcome before they can be utilized in devices. For example, after sonication the CNT's are not uniform in length limiting full three dimensional order. Nevertheless, successful design of fabrication of shape-tunable nano-building blocks provide a promising opportunity towards self-assembled smart functional materials.
Subscription Required. Please recommend JoVE to your librarian.
Disclosures
The authors have nothing to disclose.
Acknowledgments
The Research at Oak Ridge National Laboratory's Spallation Neutron Source and Center for Nanophase Materials Sciences was sponsored by the Scientific User Facilities Division, Office of Basic Energy Sciences, U.S. Department of Energy. The author, Zhe Zhang, gratefully acknowledges the financial support from Jülich Center for Neutron Science, Research center Jülich.
Materials
| Name | Company | Catalog Number | Comments |
| HiPco Single-walled carbon nanotubes | Unidym | P2771 | |
| Pluronic F127 | BASF | 9003-11-6 | Mw = 12.6 kg/mol |
| 5-methylsalicylic acid | TCI America | C0410 | |
| Ultrasonic processor | Cole-Parmer | ML-04714-52 | |
| Sorvall 6 plus centrifuge | Thermo Scientific | 46910 | |
| Innova AFM | Bruker | ||
| Si-wafer | Silicon Quest International | 150 mm in diameter; N type <1-1-1> cut; 1-10 Ohm/cm; Single-side polyshed (675 ± 25 μm); Diced (12 mm x 12 mm) |
References
- Kostarelos, K., Bianco, A., Prato, M. Promises, facts and challenges for carbon nanotubes in imaging and therapeutics. Nat Nanotechnol. 4 (10), 627-633 (2009).
- Baughman, R. H., Zakhidov, A. A., de Heer, W. A. Carbon nanotubes--the route toward applications. Science. 297 (5582), 787-792 (2002).
- Wang, J. Carbon-nanotube based electrochemical biosensors: a review. Electroanal. 17 (1), 7-14 (2005).
- Kim, T. H., Doe, C., Kline, S. R., Choi, S. M. Water-Redispersible Isolated Single-Walled Carbon Nanotubes Fabricated by In Situ Polymerization of Micelles. Adv Mater. 19 (7), 929-933 (2007).
- Doe, C., Choi, S. M., Kline, S. R., Jang, H. S., Kim, T. H. Charged Rod-Like Nanoparticles Assisting Single-Walled Carbon Nanotube Dispersion in Water. Adv Funct Mater. 18 (18), 2685-2691 (2008).
- Kim, S. W., et al. Surface modifications for the effective dispersion of carbon nanotubes in solvents and polymers. Carbon. 50 (1), 3-33 (2012).
- Moore, V. C., et al. Individually suspended single-walled carbon nanotubes in various surfactants. Nano Lett. 3 (10), 1379-1382 (2003).
- Mountrichas, G., Tagmatarchis, N., Pispas, S. Synthesis and solution behavior of carbon nanotubes decorated with amphiphilic block polyelectrolytes. J Phys Chem B. 111 (29), 8369-8372 (2007).
- Habibnejad Korayem, A., et al. Transition and Stability of Copolymer Adsorption Morphologies on the Surface of Carbon Nanotubes and Implications on Their Dispersion. Langmuir. 30 (33), 10035-10042 (2014).
- Yang, Z., et al. Noncovalent-wrapped sidewall functionalization of multiwalled carbon nanotubes with polyimide. Polym Composite. 28 (1), 36-41 (2007).
- Islam, M. F., Rojas, E., Bergey, D. M., Johnson, A. T., Yodh, A. G. High weight fraction surfactant solubilization of single-wall carbon nanotubes in water. Nano Lett. 3 (2), 269-273 (2003).
- Kim, J. S., Song, K. S., Lee, J. H., Yu, I. J. Evaluation of biocompatible dispersants for carbon nanotube toxicity tests. Arch Toxicol. 85 (12), 1499-1508 (2011).
- Zheng, M., et al. DNA-assisted dispersion and separation of carbon nanotubes. Nat Mater. 2 (5), 338-342 (2003).
- Nish, A., Hwang, J. Y., Doig, J., Nicholas, R. J. Highly selective dispersion of single-walled carbon nanotubes using aromatic polymers. Nat Nanotechnol. 2 (10), 640-646 (2007).
- Chen, J., et al. Noncovalent engineering of carbon nanotube surfaces by rigid, functional conjugated polymers. J Am Chem Soc. 124 (31), 9034-9035 (2002).
- Jones, M. C., Leroux, J. C. Polymeric micelles-a new generation of colloidal drug carriers. Eur J Pharm Biopharm. 48 (2), 101-111 (1999).
- Chiappetta, D. A., Sosnik, A. Poly (ethylene oxide)-poly (propylene oxide) block copolymer micelles as drug delivery agents: improved hydrosolubility, stability and bioavailability of drugs. Eur J Pharm Biopharm. 66 (3), 303-317 (2007).
- Alexandridis, P., Zhou, D., Khan, A. Lyotropic liquid crystallinity in amphiphilic block copolymers: temperature effects on phase behavior and structure for poly (ethylene oxide)-b-poly (propylene oxide)-b-poly (ethylene oxide) copolymers of different composition. Langmuir. 12 (11), 2690-2700 (1996).
- Doe, C., Jang, H. S., Kim, T. H., Kline, S. R., Choi, S. M. Thermally switchable one-and two-dimensional arrays of single-walled carbon nanotubes in a polymeric system. J Am Chem Soc. 131 (45), 16568-16572 (2009).
- Doe, C., Jang, H. S., Kline, S. R., Choi, S. M. SANS Investigation of Selectively Distributed Single-Walled Carbon Nanotubes in a Polymeric Lamellar Phase. Macromolecules. 43 (12), 5411-5416 (2010).
- Han, Y., Ahn, S. K., Zhang, Z., Smith, G. S., Do, C. Tunable Encapsulation Structure of Block Copolymer Coated Single-Walled Carbon Nanotubes in Aqueous Solution. Macromolecules. 48 (11), 3475-3480 (2015).
- Kim, T. H., Han, Y. S., Jang, J. D., Seong, B. S. SANS study on self-assembled structures of Pluronic F127 triblock copolymer induced by additives and temperature. J Appl Cryst. 47 (1), 53-59 (2013).
- Arnold, O., et al. Mantid-Data analysis and visualization package for neutron scattering and µ SR experiments. Nucl Instrum Meth A. 764 (1), 156-166 (2014).
- Alvarez, R., et al. Mantid 3.4: Manipulation and Analysis Toolkit for Instrument Data. Mantid Project. , (2015).
- Nagarajan, R., Bradley, R. A., Nair, B. R. Thermodynamically stable, size selective solubilization of carbon nanotubes in aqueous solutions of amphiphilic block copolymers. J Chem Phys. 131 (10), 104906 (2009).
- Nikolaev, P., et al. Gas-phase catalytic growth of single-walled carbon nanotubes from carbon monoxide. Chem. Phys Lett. 313 (1), 91-97 (1999).
