We present the setup and experimental procedure to obtain smFRET data from large donor-acceptor networks with a TIRF microscope. The step-by-step analysis of these measurements with the Bayesian inference software Fast-NPS yields high-resolved structural information via the application of adapted dye models.
Method Article
Structural Information from Single-molecule FRET Experiments Using the Fast Nano-positioning System
* These authors contributed equally
In This Article
Summary
Abstract
Single-molecule Förster Resonance Energy Transfer (smFRET) can be used to obtain structural information on biomolecular complexes in real-time. Thereby, multiple smFRET measurements are used to localize an unknown dye position inside a protein complex by means of trilateration. In order to obtain quantitative information, the Nano-Positioning System (NPS) uses probabilistic data analysis to combine structural information from X-ray crystallography with single-molecule fluorescence data to calculate not only the most probable position but the complete three-dimensional probability distribution, termed posterior, which indicates the experimental uncertainty. The concept was generalized for the analysis of smFRET networks containing numerous dye molecules. The latest version of NPS, Fast-NPS, features a new algorithm using Bayesian parameter estimation based on Markov Chain Monte Carlo sampling and parallel tempering that allows for the analysis of large smFRET networks in a comparably short time. Moreover, Fast-NPS allows the calculation of the posterior by choosing one of five different models for each dye, that account for the different spatial and orientational behavior exhibited by the dye molecules due to their local environment.
Here we present a detailed protocol for obtaining smFRET data and applying the Fast-NPS. We provide detailed instructions for the acquisition of the three input parameters of Fast-NPS: the smFRET values, as well as the quantum yield and anisotropy of the dye molecules. Recently, the NPS has been used to elucidate the architecture of an archaeal open promotor complex. This data is used to demonstrate the influence of the five different dye models on the posterior distribution.
Introduction
Determining the structure of a biomolecule is a key prerequisite for understanding its function. Two well-established methods for structure determination are cryo-electron microscopy and X-ray crystallography1,2. Today, both methods provide high-resolution structural information with a resolution down to the angstrom level. These two methods have been used extensively to elucidate the structure of large biomolecules such as protein complexes. Though the existing methods have constantly been improved throughout the last decades, the complexity of biological structures still poses a major challenge to structural biology, in particular when large, dynamic and transient complexes are investigated3.
In order to study the dynamics of macromolecular complexes and the structure-function relationship in particular, single-molecule methodologies have provided useful information4. Several new strategies were developed providing an orthogonal approach on acquiring structural and dynamic information. Examples are high speed AFM5, mechanical manipulation6, fluorescence localization microscopy7, as well as single-molecule Förster Resonance Energy Transfer (smFRET)8,9. Since quite early on FRET has been termed a molecular ruler, due to the distance dependence on the length scale of biomacromolecules10.
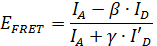
One particularly interesting application of smFRET is to use the distance information obtained from smFRET measurements to infer structural information11,12,13,14,15,16,17,18,19,20,21,22,23. Due to the high time resolution of smFRET, the position of mobile parts of a protein structure can be localized. However, in order to extract quantitative information from smFRET data important correction parameters about the dye molecules need to be determined during the measurement24. With these correction factors, the FRET efficiency EFRET can be calculated using the formula
 ,
,
where IA and ID are the fluorescence intensities of the donor and the acceptor molecule, respectively (see Figure 2). The β-factor accounts for cross-talk, the leakage of donor emission into the acceptor channel and is calculated by

where I'A and I'D are the fluorescence intensities of the donor and the acceptor molecule after photo bleaching of the acceptor molecule.
The γ-factor corrects the difference in the relative detection efficiencies in the two channels as well as the differences in the fluorescence quantum yield of the donor and the acceptor dye. It is calculated from every individual time trace by
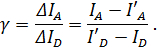
Note, that this description neglects direct excitation of the acceptor molecule, which sometimes becomes important and would need to be corrected for as well. For determining these correction factors it is useful to excite both the donor as well as the acceptor in an alternating scheme25 in order to differentiate between photo-physical changes and structural dynamics.
In order to not only obtain quantitative smFRET efficiencies but also quantitative structural information, the Nano-Positioning System (NPS) was introduced in 200826. The name was chosen based on its similarities to the satellite-based Global Positioning System (GPS). The NPS is a hybrid technique combining smFRET and X-ray crystallography data for the localization of unknown dye positions in biomacromolecular complexes. The crystal structure serves as a reference frame and the smFRET results are used to obtain distance information between an unknown fluorophore position (antenna) and a position known from the crystal structure (satellite). In consecutive experiments the distances between the antenna and several satellites are measured and the position of the antenna is determined by means of a statistically rigorous analysis scheme based on Bayesian parameter estimation. As a result, not only the likeliest position of the antenna is computed, but its complete 3D uncertainty distribution, the so-called posterior, visualized by credible volumes. Moreover, NPS was expanded to allow for the analysis of complete smFRET networks27.
The NPS has been used to solve a number of important questions in eukaryotic transcription, namely the course of the upstream DNA, the non-template DNA and the nascent mRNA within the RNA Polymerase II elongation complex12,28, also demonstrating the effect of transcription initiation factors26 and the dynamic architecture of an open-promotor complex29. Moreover, the NPS was used to elucidate the structure of the archaeal RNA Polymerase open complex30 and in particular the position of transcription initiation factor TFE, which binds competitively to the same site as transcription elongation factor Spt4/531.
Since then, a number of smFRET based structural approaches have been published15,18,21,23. When comparing different smFRET based structural methods, it becomes clear that the apparent precision of the method is highly dependent on the particular choice of dye models. One should note that dye molecules may exhibit different spatial and orientational behavior depending on their local environment.
To this end, Fast-NPS was introduced32. Fast-NPS uses an advanced sampling algorithm reducing the calculation times drastically. Furthermore, Fast-NPS allows one to perform a structural analysis and for each dye molecule the user can choose from a set of five different dye models which will be described next. The most conservative model, called classic, assumes that the dye occupies only one, but unknown, position. At this position, the fluorophore can rotate freely within a cone, whose size is determined from its respective (time-dependent) fluorescence anisotropy. The orientation of the cone is not known, which leads to large uncertainties when converting measured smFRET efficiencies into distances. In this respect, the model is conservative, since it will lead to the smallest precision compared to the other dye models. Only for very short distances should the assumptions made by the classic model lead to a noticeably incorrect position determination. For typical smFRET values, the correct position is always enclosed in the comparatively large credible volume.
However, since a higher precision is desirable, it is important to develop and test alternative dye models, which could help to improve the precision. If the dye rotates much faster than its inherent fluorescence lifetime, the so-called iso model can be applied. Here, the orientation factor κ2 (needed for calculating the characteristic isotropic Förster radius ) is set to 2/3. As a result, the computed credible volumes are almost two orders of magnitude smaller as compared to those in the classic model32. In the case that the fluorophore is found in an environment that enables not only fast reorientation, but additionally fast motion all over its accessible volume, the meanpos-iso model should be used. In this model, the dye effectively occupies only one mean position, where the spatial averaging is accounted for by a polynomial distance conversion15. This model applies if for example the (commonly hydrophobic) dye is attached to a hydrophilic region, e.g., the DNA. Application of the meanpos-iso model leads to a further reduction in the size of the credible volumes by a factor of approximately two. However, a dye linked to a protein might bind reversibly to several hydrophobic patches in its sterically accessible volume (AV). A fluorophore that instantaneously switches between these regions, but within one region undergoes free rotation and fast localized motion is best described by the var-meanpos-iso model. For a similar situation in which the dye is not free to rotate the var-meanpos model applies. More details about these models can be found in our recent publication32.
These models provide an extensive repertoire to specifically account for the various environments a dye might encounter and applying them wisely optimizes its localization precision. In Fast-NPS every dye molecule attached to a specific position can be assigned to an individual model, such that FRET-partners are allowed to have different models. This enables limitless and close-to-nature modelling. However, it is important that one performs rigorous statistical tests to ensure that the result obtained by the final model combination is still in agreement with the experimental data. These tests are included in the Fast-NPS software.
In order to apply Fast-NPS to experimental data the measurement of (only) three input parameters is required. First, the dye-pair specific isotropic Förster radii ( ) have to be determined. Therefore, the quantum yield (QY) of the donor dye, the donor fluorescence emission spectra and the acceptor absorption spectra need to be measured. These measurements can be carried out in bulk, using a standard spectrometer and a standard fluorescence spectrometer. For each pair, the R0 is then calculated using the freeware PhotochemCAD and can be used in the NPS analysis. Moreover, the (time-resolved) fluorescence anisotropies of the dye molecules need to be obtained using a polarization (and time) sensitive fluorescence spectrometer. However, the most important input parameters for Fast-NPS are the smFRET efficiencies measured on a single-molecule fluorescence microscopy setup, such as a total internal reflection fluorescence microscope (TIRFM).
Here, we present a step-by-step protocol for obtaining smFRET data and applying Fast-NPS (Figure 1).
Protocol
1. Prerequisites and Lab Equipment
NOTE: The assembly of the measurement chamber is depicted in Figure 3. The sandwich-design of the measurement chamber comprises three major components: a quartz glass (fused silica) slide, a sealing film and a coverslip that seals the flow chamber. The measurement chamber is mounted onto a customized sample holder. The dimensions of the sample chamber and the metal holder are geared to fit to a standard microscopy quartz glass slide (76 mm x 26 mm).
- Cut quartz glass slides using a diamond drill (0.75 mm) at positions indicated in Figure 4. The design of the quartz glass slides is asymmetric in order to differentiate between the two sides of each slide.
NOTE: The quartz slides can be re-used after the measurement until the surface becomes scratched. - To mount the chambers, use customized metal sample holders as depicted in Figure 5. The sample holders contain two threads (M4) in order to connect an inlet and an outlet tubing for the flow chamber. Furthermore, use threads (M3) to mount the sample chamber onto the metal holder as well as threads (M3) to fix the prism holder onto to the lower half of the metal holder.
- Perform the smFRET measurements on a prism type total internal reflection fluorescence microscope (TIRFM) (Figure 6).
NOTE: The TIRFM features three lasers: A green (532 nm, Nd:YAG laser) and a red laser (643 nm, diode laser) for the excitation of the donor and the acceptor dye molecules as well as a blue laser (491 nm, diode-pumped solid-state laser) for bleaching the background fluorescent impurities on the sample chamber prior to the smFRET measurement. The three laser beams are spatially combined and can be selected via an acousto-optic tunable filter (AOTF). The fluorescence light is collected by a high aperture objective, split into a donor and an acceptor channel by using a dichroic mirror and projected onto two EM-CCD cameras. The sample chamber is attached to a micrometer stage allowing movement in x- and y-direction with two stepper motors. A third piezo motor is used together with an IR-laser and a position sensitive detector to build an auto-focus system to ensure optimal focus throughout the experiment.- Use alternating laser excitation (ALEX) when dynamics in the FRET time trajectories are observed25. Such dynamics can be caused by either conformational changes within the molecules or by fluctuations in acceptor brightness and acceptor blinking.
NOTE: ALEX allows for the discrimination between these two possible causes and prevents misinterpretation of dynamic FRET trajectories. However, for reasons of simplicity, the protocol part is restricted to the analysis of movies taken without ALEX.
Caution: Class 3B lasers are used in the single-molecule fluorescence setup. Ensure that adequate laser safety precautions, according to local government regulations, have been taken before the system is operated.
- Use alternating laser excitation (ALEX) when dynamics in the FRET time trajectories are observed25. Such dynamics can be caused by either conformational changes within the molecules or by fluctuations in acceptor brightness and acceptor blinking.
- Perform the absorption measurement used for determining the quantum yield on a UV-VIS spectrometer (see Materials and Methods).
- Perform the measurement of the donor fluorescence emission spectrum, the acceptor absorption spectrum and the fluorescence anisotropy on a fluorescence spectrometer (see Materials and Methods).
- Prepare sample chambers according to published procedures33. Alternatively, the procedure described in [34] can be used.
- Label the investigated samples with a donor-acceptor dye molecule pair suited for smFRET and ensure that there is a biotin moiety for the immobilization on the surface of the sample chamber.
NOTE: In order to localize an unknown antenna dye position with the Fast-NPS software different sample constructs are needed. Every construct needs to have one label at the unknown antenna dye position and one label at a satellite position known from the crystal structure. At least three different constructs with dyes attached to the antenna position and three different satellite positions are required for accurate results. Measurements between antennas as well as between satellites are also useful to improve the accuracy, however, this requires exchange of dye molecules which needs to be correctly entered in the analysis.
2. Mounting of Flow Chambers in a Custom Holder
- Pull silicone tubing (0.8 mm ID, 2.4 mm OD) into hollow tab screws (M4) and cut the tubing on both ends straight leaving an overhang of 1 cm on both sides by using a sharp razor blade. Adjust the overhang of the tubing to about 2 mm on one side of the tab screw.
- Mount the flow chamber into the sample holder in a way that the holes in the quartz glass slide match the threads in the sample holder. Tighten inlet and outlet screws gently to ensure that the inlet and outlet of the sample chamber are still penetrable. Gently tighten the four screws of the acrylic glass holder to fix the position of the flow chamber.
- Cut silicone tubing (0.58 mm ID, 0.96 mm OD) into 20 cm long pieces. Insert one of the pieces to the inlet and the outlet screw of the measurement chamber. Close the inlet and outlet tubing by using a clamp.
NOTE: The assembled sample chambers can be stored at room temperature for up to two weeks.
3. smFRET Measurement on the TIRF Microscope
- Use a syringe to wash the sample chamber with 500 µL of PBS. Prevent air bubbles from entering the sample chamber at all times by creating a droplet at the end of the inlet tubing before changing to a different buffer solution.
- Flush the sample chamber with 100 µL neutravidin (0.5 mg/mL in PBS) solution and incubate 15 min at room temperature.
- Wash out the neutravidin solution with 500 µL of PBS.
- Screw the metal holder for the prism onto the sample chamber.
- Mount the sample chamber to the micrometer stage of the TIRF-microscope. Make sure to mount the sample chamber horizontally as straight as possible in front of the objective to avoid defocusing during scanning process.
- Start the software controlling the EM-CCD cameras and the software for controlling the piezo-motors of the stage.
- Adjust the focus of the microscope objective by looking at the reflections of the IR laser.
- Place the prism (PS991, n = 1.52) on top of the metal prism holder. Adjust the lateral position of the prism to make sure that the laser beams hit the prism then use an adhesive and incubate with UV light for 5 min.
NOTE: Mounted prism can be reused by cleaning. - In the camera control software click "Setup Acquisition" and define the following acquisition parameters: 100 ms integration time, 401 frames/movie (green camera), 400 frames/movie (red camera), electron multiplier gain 225, pre-amplifier gain 5x and readout rate 3 MHz at 14 bit.
- Create a folder on the local hard drive for the measurement. Choose a desired name for the measurement files, e.g., Year-Month-Day. In the software settings go to the "Auto-Save" rider, enable "Auto save" and choose file format *.sif for movie acquisition. Select the folder on the hard disk. Use the folder name as filestem.
- Enable the "AutoIncrement" function (set start value to 1). Enable the attachment of an operator to the filename. Use "DON" and "ACC" for the donor and the acceptor channel, respectively. Choose "_" as separator.
- In the camera control software click on "Video" to start the live image of the camera and bleach background fluorescence by scanning the sample chamber using maximum laser intensity of all three lasers (combined ≈3,000 W/cm2 for 10 s per field of view).
- Switch off the blue laser. Decrease the intensity of the green laser to around 200 W/cm2 and to around 40 mW/cm2 for the red laser if alternating laser excitation (ALEX) is used.
- Dilute the biotinylated fluorescent sample to a concentration of 50-100 pM. Load 100 µL of the solution. The sample is immobilized on the chamber surface upon binding.
NOTE: Make sure not to overload the chamber. Neighboring molecules must be separated from each other. - If necessary, load an additional 100 µL of a 2x more concentrated sample to the chamber.
- Seal the inlet and outlet tubing of the measurement chamber using clamps after loading is completed.
- Switch off all lasers and use the piezo-motors to move the flow chamber two fields of view further.
- In the camera control software click on "Take signal" to start movie recording and switch on the laser at the same time. Ensure that more than 80% of the molecules are bleached by the end of the movie by adjusting the laser power.
- Repeat steps 3.17 and 3.18 for the whole prebleached sample chamber region.
4. Acquisition of the Transformation Map ("beadmap")
- Prepare a flow chamber as described in Sections 1.1, 1.2 and 2.
- Use avidin-coated fluorescent multispectral beads which show fluorescence emission in the donor and the acceptor channel. Vortex the stock for 1 min, then dilute 50 µL of the stock in 50 µL ddH2O. Vortex again for 1 min, sonicate 1-2 min, then vortex another 10 s.
- Carry out steps described for smFRET measurements (Section 3.5-3.10).
- Load 100 µL (1 chamber volume) of the 1:2 diluted fluorescent beads into the flow chamber. Wait 10 min for the fluorescent beads to bind to the surface.
- Use the acquisition parameters in 3.9 but change movie length to 26 (green camera) and 25 (red camera) and the electron multiplier gain to 10.
- Set the intensity of the green laser to a value of 20 W/cm2.
- Take one movie at a field of view with approximately 50-100 beads.
5. Processing and Analysis of smFRET Data
- Use the custom written software SM FRET for the analysis of the beadmap (see Materials and Methods) and the acquired movies. Start the program viewPlot1.m.
- Click on Analysis|Batch Analysis, uncheck the option "ALEX" if it has not been used. For best performance choose the threshold for peak finding "high". Press "OK".
- Choose "NO" when asked if a beadmap has already been analyzed. Browse the folder containing the acquired beadmap and select the *.sif file (by double-clicking on it). In the next dialogue window press "OK".
NOTE: If a beadmap has already analyzed in a previous measurement, choose "YES" here and select the saved beadmap by browsing to the correct folder and double clicking on the beadmap *.map file. Continue with step 5.8. - Choose two single beads positioned in opposite corners of the field of view. The pixel intensities are color-coded from dark blue (low intensity) to dark red (high intensity).
- Click on the center of the first bead. If the center of the molecule can be located clearly by the color-coding, choose "YES" or else click "NO" and choose a different molecule pair.
- Position the crosshair on the pixel showing the maximum intensity and press "KEEP". Repeat the process with the second channel.
- Click on the molecule in the opposite corner and repeat steps 5.5 and 5.6.
NOTE: The relative pixel shift of the two channels is displayed in the command window and the transformation map is automatically saved as *.map file into the folder containing the beadmap *.sif file. - To load the donor and acceptor movies (*.sif) for the "batch analysis", browse to the folder, select all movies that shall be analyzed and click on "OK". In the next dialogue window, press "OK".
NOTE: The batch analysis is finished when the last lane displayed in the command window starts with "Finished analyzing…". The detected molecules are displayed in a new window, which also indicates the relative shift of the donor and the acceptor channel determined from the transformation map. - To load the batched movie files click on File|Load. Uncheck the option "ALEX" if it has not been used. Set the smoothwidth to 10 and click "OK". Choose the folder containing the *.ttr files and click on "select all" and "OK" in the next context menu.
- If the displayed trace features the characteristic smFRET phases (Figure 2) press on the toggle button "Not selected" and first select the time point of the beginning of the FRET event by moving the line with the mouse cursor and clicking the left mouse button. Next select the time point of the bleaching of the acceptor molecule and finally the time point of the bleaching of the donor molecule.
- In the next window the FRET efficiency is plotted in blue. To select the trace press the "Yes" button otherwise choose "No". To re-access a time trace click the "Prev" button.
- Repeat the procedure until the last molecule of the movie.
- After analyzing the last molecule in a movie save the selected traces by clicking on "File|Save". Save the selected traces in the same folder as the *.sif files.
- Repeat steps 5.10-5.13 for all acquired movies.
- Execute the program combine_fret_results.m. Select the folder containing the *.res files and all the *.FRETonly_trace files. Save the molecule-wise FRET and frame-wise FRET files as MW.dat and FRW.dat, respectively.
NOTE: The *.dat files are saved as ASCII files. The FRW.dat file contains six columns and one row for each FRET-frame. The sixth column contains the corrected frame-wise FRET efficiency. The MW.dat file contains 21 columns and one row per selected FRET molecule. The third column contains the molecule-wise FRET efficiency.
6. Displaying smFRET Data in Histograms
NOTE: In order to extract the mean smFRET efficiency of all recorded smFRET data the frame-wise data or the molecule-wise data are plotted in histograms and analyzed using Gaussian fits to (multiple) peaks. In the following, the protocol uses a commercial data analysis software (see Materials List). However, any other available software can be used instead.
- Open a data analysis software (see Materials List). Click on File|Import|multiple ASCII. Select the folder containing the FRW.dat file. Select the file and press "OK". Accept the input option with "OK" without a change.
- Select the third column C(Y) containing the corrected FRET efficiencies, right-click on the column and select Plot|Statistics|Histogram. In the histogram window double-click on the columns and deselect "automatic binning" and select a desired bin-size, e.g., 0.05. Also choose beginning and end values, e.g., -0.025 and 1.025.
- Select the columns of the histogram by left-clicking on them. Then right-click and choose "go to Bin Worksheet". Select the "Counts" column by left-clicking on it and then right-click and select Plot|Column/Bar/Pie|Column.
- In the column bar plot go to Analysis|Fitting|Nonlinear curve fit|Open dialog. Choose "Gaussian" under Function then go to the "Parameter" rider. Deselect auto parameter initialization. Fix the offset value (y0) at 0. Click on "Fit".
NOTE: The fit function as well as the fitting details are now displayed in the column plot. The "xc" value gives the center of the fit function, i.e., the mean FRET efficiency that serves as the input parameter for the NPS software.
7. Measurement of the Quantum Yield
- Perform quantum yield determination with the relative method similar to the procedure described by Würth et al.35, using Rhodamine 101 dissolved in ethanol (QY = 91.5%) as a standard.
- Record absorption spectra at a UV-VIS spectrometer using an 80 µL volume in an absorption cuvette of 1 cm path length. The absorbance at the wavelength which will be used for fluorescence excitation has to be ≤ 0.05.
- Record emission spectra on a lamp-calibrated spectrometer operated in photon-counting mode. Perform the measurements with Glan-Thompson polarizers in the excitation (0°) and emission (54.7°) path (magic angle conditions) using a spectral bandwidth of about 5 nm and 2.5 nm for the excitation and emission monochromator, respectively. Measure samples after transferring them to a fluorescence cuvette with 3 mm path length taking care that the count rate does not exceed 106 s-1.
- Calculate quantum yield according to
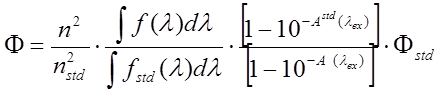
where n and nStd are the refractive indices of the solvent of the sample and the standard, respectively. f(λ) and f_Std (λ) are the fluorescence intensities of the sample and the standard at the wavelength λ. A(λex) and Astd (λex) are the absorbance of the sample and reference at the excitation wavelength and Φstd is the quantum yield of the standard.
8. Calculation of the Isotropic Förster Radius
- Calculate the isotropic Förster radius () from the emission spectrum of the donor molecule, the absorption spectrum of the acceptor molecule, the quantum yield of the donor and the refractive index of the medium. Use the freeware PhotochemCAD for the calculation of . However any other available software can be used instead36.
9. Measurement of the Anisotropies
- Determine steady-state fluorescence anisotropies from recordings of fluorescence spectra with various excitation/emission polarizer settings (V/V, V/H, H/V, H/H)36.
- Calculate the G-factor, which corrects for polarization artefacts of the instrument, for each wavelength from the ratio
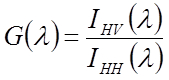
and use it to calculate the anisotropy value for each wavelength:
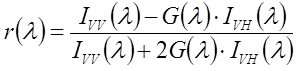
where Ixy indicates the intensity for excitation polarization x and emission polarization y.
- Average the values across the emission spectral range to calculate the steady-state fluorescence anisotropy.
10. Installation of Fast-NPS Software
- Download UCSF Chimera from http://www.cgl.ucsf.edu/chimera and follow the installation guide.
- Go to the website of the "Institute of Biophysics" at Ulm University: https://www.uni-ulm.de/en/nawi/institute-of-biophysics/software.html. Download the current version of Fast-NPS and extract it to a folder of choice. Open the subfolder “Redistributable” and install the Visual C++ Redistributable which is appropriate for the system.
11. Centering the pdb File
- Open the pdb file(s) of interest in Chimera. Select all atoms of the macromolecular complex and calculate the coordinates of the centroid (Tools|Structure Analysis|Axes/Planes/Centroids|Define centroid…|Ok).
- Open the Reply Log (Favorites|Reply Log) and the Transformation Tool (Tools|Movement|Transform Coordinates). Enter the coordinates of the centroid shown in the Reply Log into the textbox "Shift" of the Transform Coordinates window and change the sign of every coordinate. Press "Apply" and save the file with "Save PDB" (File|Save PDB).
12. Setting up the Position Priors
NOTE: All values are considered in angstrom.
- Start the technical computing language and change the current folder to the local Fast-NPS folder. Enter in the command window: FastNPS.
- Create a new jobfile in the Project Manager (Project|New).
- Set up the position prior (Tools|Model dye prior).
- In the panel "prior basics" define the spatial resolution of the position prior by entering its value (2 is recommended).
- Exclude the interior of the macromolecule by activating the check box and clicking on the "load PDB" button. Select and load the centered pdb file as described in Section 11.
- Specify the approximate diameter (13 Å is recommended, see discussion) of the dye by entering its value.
- Enter a skeletonization distance, i.e., the distance the dye molecule may penetrate into the macromolecule (2 Å is recommended).
- In the panel "maximum prior size" enter the minimal and maximal coordinates of the position prior (recommended: x in [-150,150], y in [-150,150] and z in [-150,150]).
- When defining a satellite, activate the checkbox "attachment via flexible linker" in the panel "prior basics" and enter in the panel "linker" the coordinates of the atom (in the centered pdb file) at which the dye molecule is attached. Further, specify the length and the diameter of the linker by entering their values (13 Å and 4.5 Å are recommended, see discussion). In case of an antenna skip this point.
- Press the button "calculate accessible volume".
- Save the position prior and optionally export it for visualization purposes using software such as Chimera.
13. Defining the Network Geometry
- Open the Define Measurement Window (Mode|Edit Geometry).
- Create a new dye molecule by pressing the button "New" in the panel "Dyes".
- Set its fluorescence anisotropy (Section 9) by entering a value and select a dye model within the dropdown menu "Dye model".
- Press the button "Load", select the corresponding position prior and check the activate check box of the dye. Repeat this procedure for all dyes, i.e., for all antennas as well as for all satellites.
- After creating all dyes, define the measurements. Create a new measurement by clicking "New" in the panel "Measurements".
- Select its FRET partners in the dropdown menus "Dye1" and "Dye2" below.
- Enter the smFRET efficiency with error and the isotropic Förster radius of this dye pair.
- Finally, check the activate check box of the measurement. Repeat this procedure for all measurements.
NOTE: Oftentimes the network becomes increasingly complex, so that the user might get confused. In order to prevent mistakes, check the network visually by pressing the "Check Network" button. The figure displays the activated dyes and indicates measurements via lines interconnecting the FRET dyes.
14. Calculation
- Open the Calculation Window (Mode|Calculation).
- If every dye in the network has a specific model assigned, select "User defined" and start the calculation by pressing "Calculation". To have all dyes in the same model, select one of the five models (classic, iso, meanpos-iso, var-meanpos-iso and var-meanpos) and continue.
NOTE: The command window will indicate the progress of the calculation. Fast-NPS will do so with a pop-up message, when the calculation has been completed.
15. Visualization of Results
- In order to export the credible volumes of the dyes, open the View Results Window (Model|View Results).
- Export dye densities:
- Export dyes singly or all simultaneously. In order to export a single dye select it in the panel "Displayed Dyes" and press "Export Density". Enter a resolution (2 is recommended) and choose a file type for exportation. On the right the density is previewed and some of its mathematical characteristics are shown.
- In order to export all dyes simultaneously push "Batch Export".
- Open the resulting density files in Chimera.
16. Consistency Check of Chosen Model Combination
- Open the View Results Window (Model|View Results). If in the panel "Calculation Info" the text box "Consistency" displays a value lower than 90% the current model does not represent the measured smFRET efficiencies sufficiently and is thus inconsistent.
- In case of inconsistency push the button "Detailed Consistency". Search for the measurements that have a value below 90%. If one or more dyes are predominantly involved in these measurements, their models are likely to cause the inconsistency. Consider different dye models for these dyes and rerun the Fast-NPS calculation.
Results
Transcription is the first step in gene expression in all organisms. In Archaea, transcription is carried out by a single RNA polymerase (RNAP). Compared to eukaryotes, the archaeal RNAP bears a striking structural resemblance to their eukaryotic counterparts while having a simpler transcriptional machinery. Thus, Archaea can be used as a model system to study eukaryotic transcription initiation by RNA Polymerase II (Pol II). Recently, the complete architecture of the archaeal RNA polymerase open complex has been determined from single-molecule FRET and NPS. The data from NPS analysis was used to build a model of the complete archaeal open promotor complex, which provides useful insights into the mechanism of transcription initiation.
To elucidate this structure, smFRET efficiencies were measured between unknown antenna dye molecules located within the open promotor complex and several known satellite dye molecules that were incorporated at five reference sites in the RNAP, whose positions are known from crystallographic structures (pdb-ID: 2WAQ)37. The antenna dyes were attached to either one of different positions on the non-template DNA, TFB, TBP or TFE. The complete network used in this study consisted of more than 60 measured distances.
Figure 7 depicts the model of the complete archaeal open promotor complex built from the NPS analysis. It comprises the double stranded promotor DNA (light and dark blue), the RNA Polymerase (grey) and the transcription initiation factors TBP (purple), TFB (green) and TFE (yellow). The model is superimposed with the results from the NPS analysis, the credible volumes, which were calculated using the classic model (A), the iso model (B), the meanpos-iso model (C), the var-meanpos-iso model (D) and the var-meanpos model (E).
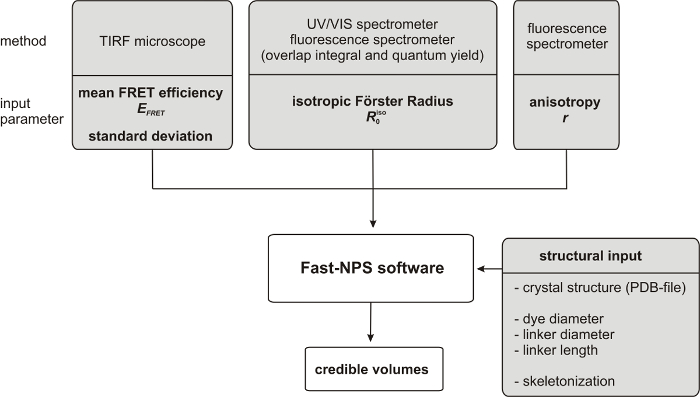
Figure 1: Workflow of the acquisition and processing of the parameters needed for the Fast-NPS calculation. Please click here to view a larger version of this figure.
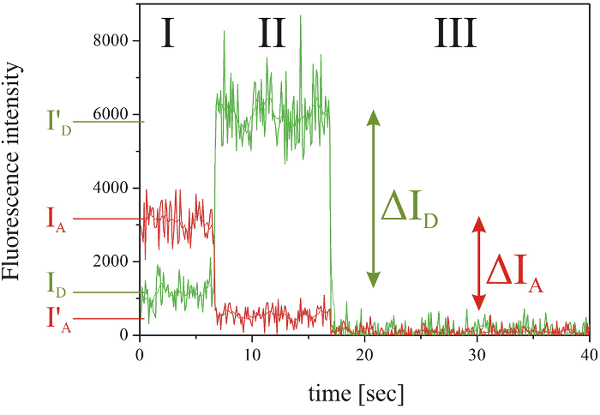
Figure 2: Exemplary fluorescence intensity time trace of a smFRET event. The fluorescence intensities of the donor (green) and the acceptor molecule (red) showing the three characteristic phases, namely I: smFRET, II: donor fluorescence after acceptor photobleaching, III: background fluorescence after donor photobleaching. Please click here to view a larger version of this figure.
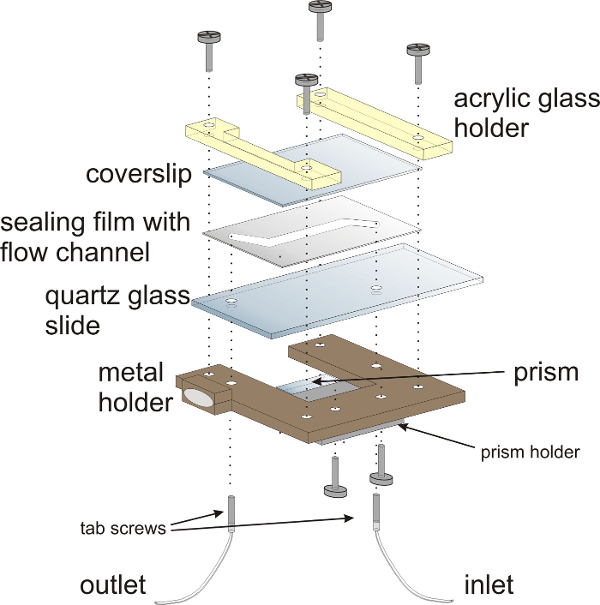
Figure 3: Schematic illustration of the flow chamber for smFRET experiments. The flow chamber is mounted onto a customized metal holder with acrylic glass holders. The sandwich-design of the flow chamber comprises a quartz glass (fused silica) slide with two holes for attaching inlet and outlet tubing, a sealing film and a coverslip that closes the flow chamber. The prism for TIRF illumination is mounted onto the lower half of the flow chamber. Hollow tab screws provide the inlet and outlets for the flow chamber. Please click here to view a larger version of this figure.
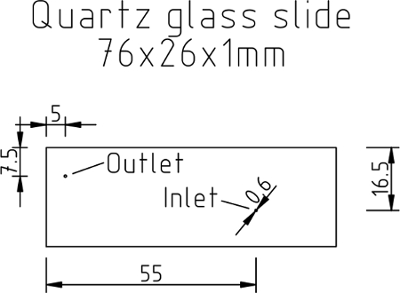
Figure 4: Preparation of the quartz glass slide and the sealing film. Mechanical drawing of the quartz glass slide indicating the positions of the holes (given in millimeters). Please click here to view a larger version of this figure.
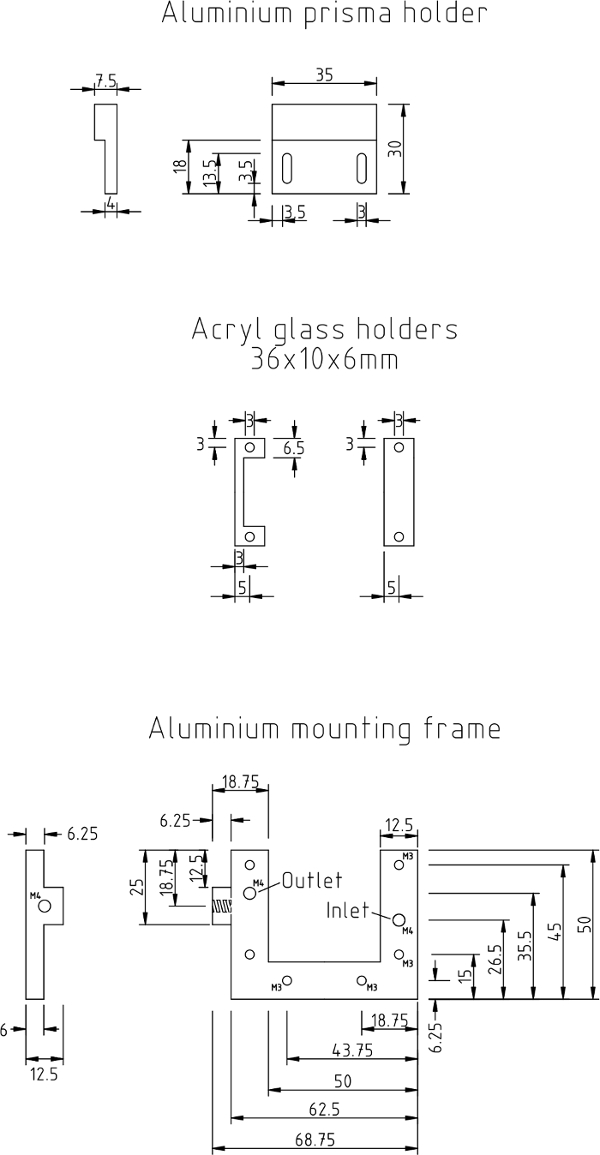
Figure 5: Mechanical drawing of the flow chamber. The measures for the aluminum prism holder, acryl glass holders and aluminum mounting frame are given in millimeters. Please click here to view a larger version of this figure.
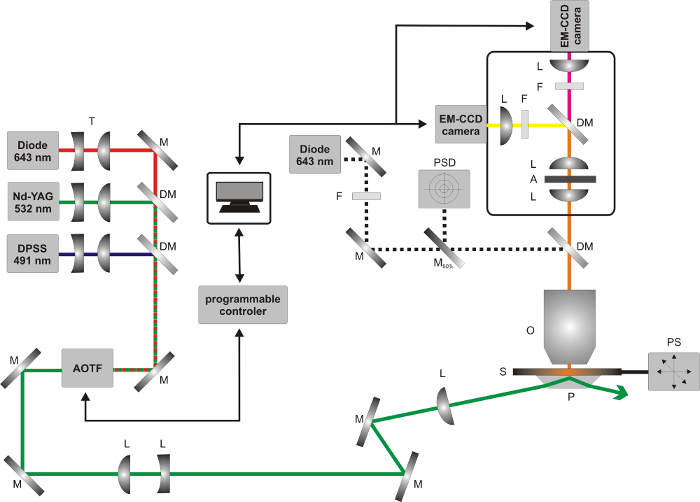
Figure 6: Schematic illustration of the prism-type TIRF setup used for smFRET experiments. Abbreviations for optical components: A, aperture; DM, dichroic mirror; F, emission filter; L, lens; M, mirror; O, objective; P, prism; PSD, position sensitive photo-diode; S, sample; PS, positioning stage; T, telescope. Please click here to view a larger version of this figure.

Figure 7: Simulation results of the different model assumptions. All pictures show the archaeal RNA polymerase (pdb-ID: 2WAQ, top view) together with the model for promoter DNA (tDNA and ntDNA in blue and cyan, respectively), TBP (purple), TFB (green) and TFE (yellow) in the archaeal open complex30. The credible volumes are superimposed for the NPS simulation results of (A) the classic model, (B) the iso model, (C) the meanpos-iso model, (D) the var-meanpos-iso model and (E) the var-meanpos model. All volumes are shown at 68% credibility. The classic and the var-meanpos networks are consistent with the smFRET data. In contrast, networks where for all dyes the iso, meanpos-iso or the var-meanpos-iso model is chosen are inconsistent with the measured data. Please click here to view a larger version of this figure.
Discussion
We present the setup and experimental procedure to accurately determine FRET efficiencies between dyes attached via flexible linkers to biomacromolecules, i.e., nucleic acids and/or proteins.
In order to ensure precise smFRET measurements (Section 3), it is crucial to exclude air from the flow chamber at any time during the measurement. Furthermore, make sure to not overload the flow chamber with fluorophores. The fluorophores must be clearly separated to ensure correct analysis. As smFRET pairs, which do not show bleaching of the donor have to be excluded from the analysis, make sure that >80% of the molecules in the field of view are bleached at the end of the movie. To account for inhomogeneities in the sample the β-factor and the γ-factor, correcting the cross-talk and relative detection efficiencies of the donor and acceptor channel, respectively, are calculated for each FRET pair individually.
The camera settings (integration time, electron multiplier gain, pre-amplifier gain and readout rate described in Section 3.9) should be set to values giving the best tradeoff between signal to noise ratio, dynamic range and time-resolution. They need to be re-adjusted for different experiments or if different hardware is used. The numbers of frames need to be high enough to ensure that most of the donor molecules bleach within the observation time.
For the measurements on the fluorescence spectrometer (Sections 7 to 9) a good compromise between the signal intensity and the spectral resolution of the recorded data has to be found. To this end the slits in the excitation and emission pathway of the fluorescence spectrometer have to be adapted dependent on the instrument used and the sample concentration.
Moreover, we present the Fast-NPS analysis method to obtain structural information of transient or dynamic macromolecular complexes. NPS has been applied to reveal the path of the non-template DNA strand and the position of transcription initiation factors in the archaeal RNA polymerase open complex. Using the network of more than 60 different distance measurements, we showed that Fast-NPS, equipped with a newly implemented sampling engine (Eilert, T., Beckers, M., Drechsler, F., & Michaelis, J. in preparation), reduces the time needed for the analysis of this complex smFRET network by ≈2 orders of magnitude, as compared to the original global NPS method27. The algorithm's robustness is rooted in a Metropolis-within-Gibbs sampler combined with a parallel tempering scheme. Fast-NPS shows exact reproducibility of network results and is consistent with results published earlier30.
Several different methods have been published aiming to infer structural information from smFRET measurements11,12,13,14,15,16,17,18. All of these approaches provide only one specific dye model. Thus, dyes, that do not fulfill the assumptions made by the respective model, cannot be used or lead to false structural information. Fast-NPS, on the contrary, allows to select for each dye molecule a different model. This helps to account for different conformational behavior of both, the dye molecule itself, as well as the linker used for its attachment. The local molecular surroundings of the dye molecule, as well as its physical properties will determine which model is most appropriate.
For the analyzed smFRET network of the archaeal initiation complex, an isotropic assumption for all dye molecules leads to a drastic decrease in the size of the credible volumes as compared to the classic model. In combination with a dynamic position averaging for all dye molecules the median of all credible volume sizes (at 95%) reduces to less than 0.5 nm3. However, these dye molecule posteriors are no longer consistent with their smFRET measurements, indicating that the assumptions made lead to false structural information. In contrast, the posteriors determined in the classic model are consistent with the determined smFRET efficiencies.
As the assumption of isotropic and/or dynamic position averaging for all dyes lead to inconsistencies, Fast-NPS enables dye molecule priors in which each dye can be assigned one of the five models. Each model uses the same accessible volume. The algorithm for the calculation of the dye AVs makes several assumptions. At first, the fluorophore's spatial shape is approximated by a sphere. Thus, a diameter taking into account the fluorophore's width, height and thickness should be used (Section 12). Further, the linker's shape is approximated by a flexible rod. The values presented in Section 12 were computed for the dye Alexa 647 attached via a 12-C linker. To date, it is not possible to accurately determine a priori which model is most suited, given an experimental geometry, and thus all models should be tested. In general, one will choose the model which gives the smallest possible posterior size, while still being consistent with the data. To test whether a choice of models is consistent with the smFRET data, we calculate both the posterior and the likelihood. Consistency means that more than 90% of the samples collected from the posterior are within the 95% confidence interval of the likelihood.
While it is true that the lower the anisotropy, the smaller the distance uncertainty, in a smFRET network geometric arrangements of the dye molecules also have to be taken into account. Thus, while representing dye molecules with a low fluorescence anisotropy with an iso model is a typical first choice, the consistency test provides a more direct means for selecting the correct dye model. The optimal choice of dye models can lead to a drastic increase in localization precision and at the same time retain the network's consistency with its FRET data.
To summarize, Fast-NPS allows to gain structural and dynamic information of large macromolecular complexes. In contrast to common structural methods such as x-ray crystallography or cryo electron microscopy this allows for monitoring highly flexible or transient complexes, thus greatly widening our mechanistic understanding of complex biological processes.
Disclosures
The authors have nothing to disclose.
Acknowledgements
The authors thank B. Gruchmann for the mechanical drawings of the flow chamber. Further, we want to express our gratitude to Max Beckers and Florian Drechsler for insightful comments and discussions regarding NPS and the underlying sampling engine.
Materials
| Name | Company | Catalog Number | Comments |
|---|---|---|---|
| Flowchamber preparation | |||
| Customized metall sample holder | self-built | n/a | |
| quartz-glass slides, 76 mm x 26 mm | Technical Glass Products | 26007 | |
| coverslips, 60 mm x 24 mm | Marienfeld | 101242 | |
| detergent, Hellmanex II | Hellma | 320.001 | |
| ultra-pure water from Synergy UV | Millipore | 2512600 | |
| Zepto plasma cleaner | Diener | n/a | |
| (3-aminopropyl)-triethoxysilane, p.a. | Sigma-Aldrich | A3648 | |
| methoxy PEG-succinimidyl valerate, 5 kDa | Laysan Bio Inc. | MPEG-SVA-5000-1g | |
| biotinylated PEG-succinimidyl valerate, 5 kDa | Laysan Bio Inc. | BIOTIN-PEG-SVA-5000 | |
| Sodium biocarbonate | Sigma-Aldrich | S5761 Sigma | |
| Sodium carbonate | Sigma-Aldrich | S2127 Sigma-Aldrich | |
| sealing film (Nescofilm) | Fisher Scientific | 12981805 | |
| Tygon Flexible Silicone Tubing, 0.8 mm ID, 2.4 mm OD | Saint-Gobain Performance Plastics | 720958 | |
| Fine-Bore Polyethylene Tubing, 0.58 mm ID, 0.96 mm OD (Smiths Medical) | Fisher Scientific | 12665497 | |
| Neutravidin | Life Technologies | A2666 | |
| Total internal reflection fluorescence microscope | |||
| Nd:YAG Laser, 532 nm | Newport Spectra-Physics | EXLSR-532-100-CDRH | |
| diode-pumped solid-state laser, 491 nm, Calypso | Cobolt | 904010050 | |
| diode laser 643 nm, iBeam smart | Toptica | iBEAM-SMART-640-S | |
| dichroic mirror, 532 RDC | Chroma | F33-540 | |
| dichroic mirror, 476 RDC | Chroma | F33-476z | |
| acousto-optic tunable filter | AA Opto-Electronic | AOTFnC-VIS | |
| plano-convex cylindrical lens, f = 75 mm | Thorlabs | LJ1703L1-A | |
| plano-concave cylindrical, f = -300 mm | Thorlabs | ||
| prism, PS 991 | Thorlabs | PS991 | |
| focusing lens, f = 75 mm | Thorlabs | LA1608-B | |
| syringe pump, PHD 2000 | Harvard Apparatus | 70-2002 | |
| 2 stepper motors, Z812B | Thorlabs | Z812B | |
| piezoelectric actuator, PE4 | Thorlabs | PE4 | |
| IR diode laser | Edmund Optics | CPS808 | part of the autofocus system |
| dichroic mirror, 775 DCXR | Chroma | 775 DCXR | |
| position-sensing detector (PSD), PDP90A | Thorlabs | PDP90A | part of the autofocus system |
| water-immersion objective, Plan Apo 60X WI, NA 1.2 | Nikon | MRD07601 | |
| dichroic mirror, 645 DCXR | Chroma | 645 DCXR | part of the emission pathway |
| emission filter, 3RD550-510 | Omega Optical | 3RD550-510 | green channel in the emission pathway |
| emission filter, 3RD660-760 | Omega Optical | 3RD660-760 | red channel in the emission pathway |
| EMCCD camera, iXon+ DU897EBV | Andor | AND-20-00032 | |
| EMCCD camera, iXon3 DU897D-BV | Andor | AND-20-000141 | |
| Miscellaneous | |||
| Varian 50 | Cary | UV-VIS spectrometer | |
| Fluorolog2 | SPEX | fluorescence spectrometer | |
| Solis (V4.15) | Andor | control software for the EM-CCD camera | |
| Apt user utility (V1.022) | Thorlabs | control software for the piezo-motors | |
| Norland Optical Adhesive 68 | Thorlabs | adhesive | |
| PC-AFN-0.8 Nile red | Kisker Biotech | avidin-coated fluorescent multispec beads | |
| Matlab | Mathworks | technical computing language for custon written software | |
| Origin (V9.0) | Originlab | scientific graphing and data analysis software | |
| Hellma 105-202-15-40 | Hellma | 105-202-15-40 | absorption cuvette of 1 cm path length |
| Hellma 105-251-15-40 | Hellma | 105-251-15-40 | fluorescence cuvette with 3 mm path length |
References
- Cheng, Y. Single-Particle Cryo-EM at Crystallographic Resolution. Cell. 161, 450-457 (2015).
- Garman, E. F. Developments in X-ray Crystallographic Structure Determination of Biological Macromolecules. Science. 343 (6175), 1102-1108 (2014).
- Sali, A. Outcome of the First wwPDB Hybrid/Integrative Methods Task Force Workshop. Structure. 23, 1156-1167 (2015).
- Hopfner, K. P., Michaelis, J. Mechanisms of nucleic acid translocases: lessons from structural biology and single-molecule biophysics. Curr Opin Struct Biol. 17, 87-95 (2007).
- Ando, T., Uchihashi, T., Kodera, N. High-speed AFM and applications to biomolecular systems. Annu Rev Biophys. 42, 393-414 (2013).
- Neuman, K. K. C., Nagy, A. Single-molecule force spectroscopy: optical tweezers, magnetic tweezers and atomic force microscopy. Nat Methods. 5, 491-505 (2008).
- Yildiz, A. Myosin V walks hand-over-hand: single fluorophore imaging with 1.5-nm localization. Science. 300 (5628), 2061-2065 (2003).
- Joo, C., Balci, H., Ishitsuka, Y., Buranachai, C., Ha, T. Advances in Single-Molecule Fluorescence Methods for Molecular Biology. Annu Rev Biochem. 77 (1), 51-76 (2008).
- Hohlbein, J., Craggs, T. D., Cordes, T. Alternating-laser excitation: single-molecule FRET and beyond. Chem Soc Rev. 43 (4), 1156-1171 (2014).
- Stryer, L., Haugland, R. P. Energy transfer: a spectroscopic ruler. Proc Natl Acad Sci U S A. 58 (2), 719-726 (1967).
- Rasnik, I., Myong, S., Cheng, W., Lohman, T. M., Ha, T. DNA-binding Orientation and Domain Conformation of the E. coli Rep Helicase Monomer Bound to a Partial Duplex Junction: Single-molecule Studies of Fluorescently Labeled Enzymes. J Mol Biol. 336 (2), 395-408 (2004).
- Andrecka, J. Single-molecule tracking of mRNA exiting from RNA polymerase II. Proc Natl Acad Sci U S A. 105 (1), 135-140 (2008).
- Schröder, G. F., Grubmüller, H. FRETsg: Biomolecular structure model building from multiple FRET experiments. Comput Phys Commun. 158 (3), 150-157 (2004).
- Margittai, M. Single-molecule fluorescence resonance energy transfer reveals a dynamic equilibrium between closed and open conformations of syntaxin 1. Proc Natl Acad Sci U S A. 100 (26), 15516-15521 (2003).
- Kalinin, S. A toolkit and benchmark study for FRET-restrained high-precision structural modeling. Nat Methods. 9 (12), 1218-1227 (2012).
- Choi, J. N6-methyladenosine in mRNA disrupts tRNA selection and translation-elongation dynamics. Nat Struct Mol Biol. 23 (August 2015), 110-115 (2015).
- Svensson, B. FRET-based trilateration of probes bound within functional ryanodine receptors. Biophys J. 107 (9), 2037-2048 (2014).
- Stephenson, J. D., Kenyon, J. C., Symmons, M. F., Lever, A. M. L. Characterizing 3D RNA structure by single molecule FRET. Methods. (2016), 1-11 (2016).
- Lee, N. K. Accurate FRET measurements within single diffusing biomolecules using alternating-laser excitation. Biophys J. 88 (4), 2939-2953 (2005).
- McCann, J. J., Choi, U. B., Zheng, L., Weninger, K., Bowen, M. E. Optimizing methods to recover absolute FRET efficiency from immobilized single molecules. Biophys J. 99 (3), 961-970 (2010).
- Brunger, A. T., Strop, P., Vrljic, M., Chu, S., Weninger, K. R. Three-dimensional molecular modeling with single molecule FRET. J Struct Biol. 173, 497-505 (2011).
- Schuler, B. Single-molecule FRET of protein structure and dynamics - a primer. J nanoboitechnology. 11, Suppl 1. 1-17 (2013).
- Choi, U. B. Single-molecule FRET-derived model of the synaptotagmin 1-SNARE fusion complex. Nat Struct Mol Biol. 17 (3), 318-324 (2010).
- Dale, R. E., Eisinger, J., Blumberg, W. E. The orientational freedom of molecular probes. The orientation factor in intramolecular energy transfer. Biophys J. 26 (2), 161-193 (1979).
- Kapanidis, A. N. Alternating-laser excitation of single molecules. Acc Chem Res. 38 (7), 523-533 (2005).
- Muschielok, A. A nano-positioning system for macromolecular structural analysis. Nat Methods. 5 (11), 965-971 (2008).
- Muschielok, A., Michaelis, J. Application of the nano-positioning system to the analysis of fluorescence resonance energy transfer networks. J Phys Chem B. 115 (41), 11927-11937 (2011).
- Andrecka, J. Nano positioning system reveals the course of upstream and nontemplate DNA within the RNA polymerase ii elongation complex. Nucleic Acids Res. 37 (17), 5803-5809 (2009).
- Treutlein, B. Dynamic Architecture of a Minimal RNA Polymerase II Open Promoter Complex. Mol Cell. 46 (2), 136-146 (2012).
- Nagy, J. Complete architecture of the archaeal RNA polymerase open complex from single-molecule. FRET and NPS. Nat Commun. 6, 6161(2015).
- Grohmann, D., et al. The Initiation Factor TFE and the Elongation Factor Spt4/5 Compete for the RNAP Clamp during Transcription Initiation and Elongation. Mol Cell. 43 (2), 263-274 (2011).
- Beckers, M., Drechsler, F., Eilert, T., Nagy, J., Michaelis, J. Quantitative structural information from single-molecule FRET. Faraday Discuss. 184, 117-129 (2015).
- Bennink, M. L. Unfolding individual nucleosomes by stretching single chromatin fibers with optical tweezers. Nat Struct Biol. 8 (7), 606-610 (2001).
- Chandradoss, S. D. Surface passivation for single-molecule protein studies. J Vis Exp. (86), e50549(2014).
- Würth, C., Grabolle, M., Pauli, J., Spieles, M., Resch-Genger, U. Relative and absolute determination of fluorescence quantum yields of transparent samples. Nat Protoc. 8 (8), 1535-1550 (2013).
- Lakowicz, J. R. Principles of Fluorescence Spectroscopy. , Springer US. Boston, MA. (2006).
- Korkhin, Y. Evolution of complex RNA polymerases: The complete archaeal RNA polymerase structure. PLoS Biol. 7 (5), (2009).
Reprints and Permissions
