Measuring Protein Binding to F-actin by Co-sedimentation
Summary
This protocol describes a method to test the ability of a protein to co-sediment with filamentous actin (F-actin) and, if binding is observed, to measure the affinity of the interaction.
Abstract
Filamentous actin (F-actin) organization within cells is regulated by a large number of actin-binding proteins that control actin nucleation, growth, cross-linking and/or disassembly. This protocol describes a technique – the actin co-sedimentation, or pelleting, assay – to determine whether a protein or protein domain binds F-actin and to measure the affinity of the interaction (i.e., the dissociation equilibrium constant). In this technique, a protein of interest is first incubated with F-actin in solution. Then, differential centrifugation is used to sediment the actin filaments, and the pelleted material is analyzed by SDS-PAGE. If the protein of interest binds F-actin, it will co-sediment with the actin filaments. The products of the binding reaction (i.e., F-actin and the protein of interest) can be quantified to determine the affinity of the interaction. The actin pelleting assay is a straightforward technique for determining if a protein of interest binds F-actin and for assessing how changes to that protein, such as ligand binding, affect its interaction with F-actin.
Introduction
Actin is an essential cytoskeletal protein that plays a critical role in multiple cellular processes, including motility, contraction, adhesion, and morphology1. Actin exists in two forms: monomeric globular actin (G-actin) and polymerized filamentous actin (F-actin). Within cells, F-actin organization is controlled by a large collection of proteins that regulate the nucleation, growth, cross-linking, and disassembly of actin filaments2,3,4. However, how multiple actin-binding proteins function in concert to regulate actin network organization is still largely unclear.
The measurement of protein-protein interactions is an important approach for understanding how proteins exert their effects on cellular behavior at the biochemical level. Many different assays can be used to detect interactions between purified proteins. Common approaches for soluble proteins include pull-downs, fluorescence polarization, isothermal titration calorimetry, and surface plasmon resonance. Importantly, all of these assays require proteins to be soluble, and are thus difficult to adapt for use with a polymeric, filamentous protein such as F-actin. Here, we describe a technique – the actin co-sedimentation, or pelleting, assay – to determine if a protein or protein domain binds F-actin and to measure the affinity of the interaction.
The actin pelleting assay is a relatively straightforward technique that does not require specialized equipment, aside from an ultracentrifuge. All reagents can be made, assuming knowledge of basic biochemistry, or purchased. Once binding to F-actin is established, the assay can be used to measure the apparent affinity (i.e., the dissociation equilibrium constant)5. Also, once an affinity is established, the pelleting assay is a useful tool to measure how changes to the protein of interest (i.e., post-translational modifications, mutations, or ligand binding) affect its interaction with F-actin6. The technique does have limitations (see the Discussion) that the researcher should be aware of before attempting the assay.
Protocol
1. Prepare the Materials
- Purify the protein of interest (see section 2).
- Prepare or purchase G-actin.
NOTE: G-actin can be isolated from multiple sources1; alternatively, it can be purchased. Reconstituted G-actin (in 5 mM Tris pH 8.0, 0.2 mM CaCl2, 0.2 mM ATP (adenosine triphosphate), and 0.5 mM dithiothreitol (DTT)) should be flash frozen, stored at -80 °C and >10 mg/mL in small (10-20 µL) aliquots, and thawed just before use. G-actin aliquots should not be refrozen. - Prepare or purchase a control protein, such as BSA (see step 4.4).
- Prepare 10x polymerization buffer (200 mM imidazole pH 7.0, 1 M KCl, 20 mM MgCl2, 5 mM ATP, and 10 mM EGTA (ethylene glycol-bis(β-aminoethyl ether)-N,N,N',N'-tetraacetic acid)). Make a 10x stock and adjust the pH after the addition of ATP, if necessary. Aliquot (25 µL is a useful volume) and store at -80 °C.
- Prepare 10x reaction buffer (200 mM imidazole pH 7.0, 1.5 M NaCl, 20 mM MgCl2, 5 mM ATP, and 10 mM EGTA). Make a 10x stock and adjust the pH after the addition of ATP, if necessary. Aliquot (50-100 µL is a useful volume) and store at -80 °C.
NOTE: The composition of the reaction buffer is flexible and may need to be adjusted to reduce background sedimentation, limit non-specific binding, and/or improve binding (steps 1.5.1-1.5.3).- Adjust the pH of the reaction buffer between 6 and 8 to optimize protein stability. At a lower or higher pH, substitute an appropriate buffer for imidazole.
NOTE: Use pH 7.0 as a starting point, unless a protein requires a lower or higher pH for stability. Do not use a buffer with a pH below 6.0 or higher than 8.0, as this may disrupt the actin. Recommended buffers (final concentration and optimal pH listed) include: 20 mM MOPS (3-(N-morpholino)propanesulfonic acid), pH = 6.5; 20 mM imidazole, pH = 7.0; 10 mM HEPES (4-(2-Hydroxyethyl)piperazine-1-ethanesulfonic acid), pH = 7.5; and 20 mM Tris, pH = 8.0. - Vary the salt concentration of the reaction buffer, depending on the needs of the assay.
NOTE: Actin is an acidic protein, and almost all actin-binding proteins rely to some extent on electrostatic interactions to associate with actin. Therefore, increasing the salt concentration decreases the actin binding in most cases. The reaction buffer uses a physiological level of salt (150 mM NaCl, working concentration), and this is the recommended starting point. If necessary, the salt concentration can be lowered (e.g., to 100 mM) to promote binding or increased to limit binding. - Do not change the concentrations of MgCl2, ATP, or EGTA in the reaction buffer unless there is a specific reason to do so.
- Adjust the pH of the reaction buffer between 6 and 8 to optimize protein stability. At a lower or higher pH, substitute an appropriate buffer for imidazole.
2. Prepare the Test Protein for the Assay
- Prepare a high-purity protein using liquid chromatography for the best results7.
NOTE: If using recombinant protein, large protein tags, such as glutathione-S-transferase (GST) should be removed by protease cleavage from the target protein, as they can interfere with binding. GST also causes homodimerization of fusion proteins, which can artificially increase the affinity of actin binding. - Determine the protein concentration by measuring the absorbance at 280 nm. Divide by the extinction coefficient; the extinction coefficient can be calculated from the protein sequence using sequence analysis or online tools. Alternatively, determine the protein concentration using Bradford or BCA (bicinchoninic acid) methods.
NOTE: For initial experiments, 50-100 µL of protein at 20-40 µM is usually sufficient. This will permit the analysis of binding in the low micromolar range, a useful starting point for most actin-binding proteins. A larger quantity, and oftentimes a higher concentration of protein are needed to generate a binding curve to calculate the affinity (see section 5). - Just before use, hard spin the protein (50,000-100,000 x g for 10 min at 4 °C) to remove the aggregates of insoluble protein. If solubility is a concern, re-measure the protein concentration (step 2.2) after centrifugation.
3. Prepare the F-actin
- Remove an aliquot of G-actin from the -80 °C freezer and thaw it quickly.
- Add the 10x polymerization buffer to the G-actin to a final concentration of 1x. Ensure that the G-actin concentration in 1x polymerization buffer is at least 10-20 µM, well above the critical concentration. Incubate for 1 h at room temperature (RT) to allow the actin to polymerize.
- After polymerization, store the F-actin in solution at 4 °C, where it will be stable for a few weeks. Before using the F-actin again after storage, gently invert or flick the tube several times to ensure that all actin is dissolved and uniformly distributed in solution.
NOTE: (Optional) Add phalloidin to achieve a 1:1 molar ratio of G-actin:phalloidin. Incubate for 30 min at RT to allow the phalloidin to bind to the F-actin. Phalloidin stabilizes F-actin and accomplishes two things: (i) it reduces the amount of actin that does not sediment during centrifugation and (ii) it allows F-actin to be diluted below the critical concentration (~0.5 µM), which is often necessary if varying the amount of F-actin to generate a binding curve (see section 5 on measuring the affinity).
4. Pelleting Assay – Basic Protocol
NOTE: The basic protocol described in section 4 is used to determine if a protein of interest co-sediments with F-actin. Once the binding to F-actin is established, the affinity of this interaction can be measured following the protocol described in section 5.
- Prepare the reaction buffer the day of use by diluting the 10x stock to 1x and add DTT to a final concentration of 1 mM.
NOTE: (Optional) Add polidocanol to a final working concentration of 0.02% in the reaction buffer. Polidocanol is a surfactant that reduces non-specific background binding and helps to prevent hydrophobic proteins from sticking to the ultracentrifuge tube. - Dilute the protein of interest to the desired concentrations in 1x reaction buffer in ultracentrifuge tubes. Keep the sample volumes low (40-60 µL) to avoid using large amounts of protein by using ultracentrifuge tubes with small minimum volumes (e.g., 7 x 20 mm tubes that hold 0.2 mL each).
NOTE: Since many actin-binding proteins have an affinity for F-actin in the micromolar range, testing a protein of interest at 2 and 10 µM is recommended. If binding is not observed at 10 µM, it is unlikely that binding will be observed at higher concentrations. If the added protein makes up more than 10-20% of the final reaction volume, it may be necessary to dialyze the protein into the reaction buffer before performing the experiment. - Add F-actin to the desired final concentration.
NOTE: 2 µM is a useful concentration for initial experiments because it is well above the critical concentration, thus maintaining actin in the filamentous state It will produce a visible pellet when analyzed by SDS-PAGE (step 4.10). - Prepare the following controls in ultracentrifuge tubes to make the assay informative.
- Prepare sample(s) containing the protein of interest without F-actin. Ensure that the concentration of protein in these samples matches the concentration in the "plus F-actin" samples.
NOTE: These samples will determine the amount of protein that is aggregated or stuck to the sides of the ultracentrifuge tube in the absence of F-actin. - Prepare negative control samples at the same or similar concentration(s) used for the protein of interest. Use a control protein that does not bind to F-actin, with and without F-actin.
NOTE: This is an important control because proteins can become "trapped" in actin filaments and pellet with F-actin, even though they do not bind F-actin. The amount of trapping can vary depending on the F-actin source, buffer conditions, etc. Thus, this control should be included in all experiments. Ideally, the control protein should have a molecular weight similar to the protein of interest (e.g., for αE-catenin (~100 kDa), BSA (66 kDa) is an appropriate control). Commercially available gel filtration standards make excellent control proteins, since they cover a range of sizes and tend not to contain aggregates. - Optionally, prepare positive control samples containing a protein that binds to F-actin, with and without F-actin. Ensure that the concentration(s) are similar to those of the protein of interest.
NOTE: This control is helpful in that it demonstrates that the experimental conditions (e.g., prepared F-actin, reaction buffer, and centrifugation) permit F-actin binding. Since the pelleting assay can fail to detect weak F-actin interactions (see the Discussion), it is recommended that the known F-actin binding protein have a moderate-to-weak affinity for F-actin (i.e., in the low micromolar range). Purified F-actin binding proteins are commercially available.
- Prepare sample(s) containing the protein of interest without F-actin. Ensure that the concentration of protein in these samples matches the concentration in the "plus F-actin" samples.
- Incubate all samples for 30 min at RT.
NOTE: Longer incubation times are fine, assuming that the protein of interest is stable, although likely unnecessary. If the protein of interest is not stable at RT, then samples can be incubated at 4 °C. In this case, longer incubation times may be necessary. - Load the samples into the centrifuge rotor. Position the tubes within the rotor to assist in resuspending the pellet after centrifugation. For this, mark all centrifuge tubes (e.g., with a sample number) and place all tubes in the rotor in the same position (e.g., the number facing out).
- Centrifuge at 100,000 x g for 20 min at 4 °C in an ultracentrifuge.
- After centrifugation, remove 3/4 of the supernatant (e.g., 45 µL if the starting volume was 60 µL) from each tube and mix with 1/3 volumes of 4x sample buffer (15 µL in this case) in a separate microcentrifuge tube.
- Remove the remaining supernatant with a gel-loading tip, taking care not to disturb the pellet (which may be visible as a glassy spot).
NOTE: It is important to remove the supernatant from the tubes as soon as possible after the completion of the centrifuge run to limit protein dissociation post-separation. Also, do not wash the pellet with reaction buffer for the same reason.
- Remove the remaining supernatant with a gel-loading tip, taking care not to disturb the pellet (which may be visible as a glassy spot).
- Add 4/3 volumes of 1x sample buffer to each pellet (e.g., 80 µL if the starting volume was 60 µL).
NOTE: This makes the dilution the same as for the supernatant (step 4.8, 1/3 volumes of 4x sample buffer were added), permitting the direct comparison between pellet and supernatant samples and the determination of the percentage of protein that was pelleted.- Add sample buffer to all tubes and incubate for at least 5 min at RT. Allow the pellet to sit in the sample buffer to improve sample recovery.
- Triturate the sample 8-10 times with a p200 pipette tip to resuspended the pellet by continuously washing the pellet area of the tube. Gently scrape the pipette tip over the pellet during the trituration to help with resuspension.
NOTE: Take care to avoid introducing air into the sample during the trituration, as this will cause the sample buffer to bubble and will reduce sample recovery. - Transfer the resuspended samples to microfuge tubes after trituration.
- Analyze the supernatant and pellet samples by SDS-PAGE and Coomassie staining8 by loading 10-15 µL of sample per lane; this is sufficient to visualize the proteins.
NOTE: Proteins that co-sediment with F-actin will be enriched in the "plus F-actin" pellet samples over the "no F-actin" pellet samples (Figure 1A). Standard Coomassie blue staining is sufficient for detection if the protein concentrations are in the 0.1-10 µM range. Colloidal Coomassie9 or Western blotting can be used to increase the sensitivity if lower protein concentrations are used to measure higher-affinity interactions. - Image Coomassie-stained gels using a scanner or imaging system (step 5.12).
5. Pelleting Assay – Quantification
Note: If specific binding to F-actin is observed, it can be useful to measure the affinity of the interaction. This is accomplished by making a few changes and additions to the protocol outlined in section 4. For an excellent guide to designing and interpreting binding assays, see Pollard10. A flow chart (Figure 2) is provided for assistance with the analysis and quantification.
- Determine the concentration range to test.
NOTE: The concentration range will depend on the protein and should span from a concentration below the apparent Kd (e.g., 1 µM) to concentrations high enough to saturate binding. It is critical that the binding reaches saturation in multiple samples at the high end of the concentration range to generate an accurate binding curve (Figure 1C). As noted above, many actin-binding proteins have an affinity for F-actin in the low micromolar range (1-5 µM). For a protein with a Kd of 0.5-1 µM, a useful starting concentration range would be 0.1-10 µM. - Hard spin (step 2.3) the protein of interest to remove aggregates. Serially dilute the protein to make a concentration series containing 7-8 samples at 2x the final concentration to be tested. For example, if the range to test is 0.1-8 µM, prepare the following dilutions in 1x reaction buffer: 16, 8, 4, 2, 1, 0.5, and 0.2 µM.
NOTE: As mentioned in step 4.2, if the added protein makes up more than 10%-20% of the first dilution (the 16 µM sample in the example above), it may be necessary to either concentrate the protein further or to dialyze the protein into 1x reaction buffer. Be sure to prepare enough of each dilution for "plus F-actin" and "no F-actin" samples. - Prepare samples (as in section 4), by diluting the protein of interest to the desired concentrations in 1x reaction buffer in ultracentrifuge tubes. Keep the sample volumes low (40-60 µL) to avoid using large amounts of protein by using ultracentrifuge tubes with small minimum volumes (e.g., 7 x 20-mm tubes that hold 0.2 mL each).
- Add F-actin to the desired final concentration to the appropriate samples and bring up the volume using 1x reaction buffer. For example, for 50-µL reactions using 2 µM F-actin, ensure that each sample has 25 µL of 2x protein, 10 µL of 10 µM F-actin, and 15 µL of 1x reaction buffer. Include control samples (steps 4.4.2 and 4.4.3).
NOTE: For negative and positive controls, use one concentration within the range to be tested (step 5.1), ideally near the middle to the high end of the range (e.g., 4 µM if the concentration range is 0.1-10 µM).
- Add F-actin to the desired final concentration to the appropriate samples and bring up the volume using 1x reaction buffer. For example, for 50-µL reactions using 2 µM F-actin, ensure that each sample has 25 µL of 2x protein, 10 µL of 10 µM F-actin, and 15 µL of 1x reaction buffer. Include control samples (steps 4.4.2 and 4.4.3).
- Incubate all samples for 30 min at RT.
- After 30 min, remove 1/5 of each sample (e.g., 10 µL of the 50-µL reaction) and mix with 20 µL of water and 10 µL of 4x sample buffer.
NOTE: These are the "Total" samples and will be used to generate a standard curve. - Load the samples into the ultracentrifuge rotor. Centrifuge for 20 min at 100,000 x g and 4 °C.
- Optionally, after centrifugation, remove 3/4 of the supernatant (e.g., 30 µL if the centrifuged volume was 40 µL) from each tube and mix with 4x sample buffer (10 µL in this case) in a separate microfuge tube. Remove the remaining supernatant with a gel-loading tip, taking care not to disturb the pellet.
NOTE: When measuring the binding affinity, it is not necessary to run the supernatant. Nonetheless, it can be useful to save the supernatant, especially when testing a new protein. - Remove the supernatant if not analyzing (step 5.7).
- Resuspend the pellet in 1 volume of 1x sample buffer (e.g., 40 µL if the centrifuged volume was 40 µL).
- Add sample buffer to all tubes and incubate for at least 5 min at RT.
- Triturate the sample 8-10 times with a p200 pipette tip, continually washing the pellet area of the tube. Gently scrape the pipette tip over the pellet during the trituration to help with resuspension.
- Transfer the resuspended protein to a microcentrifuge tube.
NOTE: These are the "Pellet" samples. - Analyze the Total and Pellet samples by SDS-PAGE8. Run all samples on one gel if possible; if not, run the pellet samples on one gel and the total samples on a second.
NOTE: Given the number of samples, a large gel system is recommended for analysis. If running samples on two or more gels, it is important that all gels be stained identically (i.e., the same Coomassie solution and an identical time in stain/destain). - Image Coomassie-stained gels using an imaging system that measures protein band intensities over a wide (i.e., a two- to three-log) and linear range. Ensure that the images are collected with no saturated pixels.
NOTE: Laser-based imaging systems offer the best sensitivity and signal-to-noise ratios. - Using ImageJ or a similar analysis program, measure protein band intensities and calculate the amount of bound protein.
NOTE: For all sample measurements, use the selection tool in ImageJ to draw a region of interest (ROI) around each band and measure (Analyze > Measure) the area and mean gray value. Calculate the background for each gel by measuring the mean gray value from an area without sample. Subtract the background mean gray value from each ROI mean gray value and then multiply by the area to obtain the integrated density value for each band.- Measure the protein of interest band intensities from the Total samples (Figure 2A).
- Generate a standard curve by plotting the band intensity (i.e., the integrated density measurements) versus protein mass (Figure 2B).
- Measure the amount of protein of interest that co-sedimented with F-actin (co-sedimented protein, Figure 2C).
- Measure the amount of protein of interest that sedimented in the absence of F-actin (background sedimentation, Figure 2D).
- Subtract the background sedimentation from the co-sedimented protein (i.e., subtract the values from step 5.13.4 from step 5.13.3) to determine the amount of protein that bound to F-actin.
- Measure the amount of F-actin in each pellet (Figure 2E). Determine the average amount of F-actin per sample and then divide each sample by the average to determine the ratio of F-actin in each sample relative to the average (i.e., the numbers below the bands).
- For each sample, divide the amount of bound protein (calculated in step 5.13.5) by the F-actin actin pellet ratio (step 5.13.6) to adjust for differences in the pellet.
NOTE: This value is the normalized bound protein. - Use the standard curve (step 5.13.2) to calculate the amount (mass) of normalized bound protein (step 5.13.7) in each sample.
NOTE: The protein removed initially (the "Total" sample), as well as the amount loaded (which, unless the entire pellet was loaded, will be some fraction of the pellet), must be accounted for when calculating the total amount of protein that pelleted. - Determine the concentration of bound protein in each sample from the total mass of protein in the pellet (calculated in step 5.13.8) and the volume of the sample. Subtract this value from the starting concentration to determine the amount of free protein. Divide the concentration of bound protein by the concentration of actin (µM/µM of actin) and plot versus the concentration of free protein to generate a binding curve (Figure 1C).
NOTE: Since F-actin is not a single, uniform species it is difficult to extrapolate the molar concentration of F-actin from the G-actin concentration. Use the starting G-actin concentration to determine the amount of bound protein (µM/µM of actin) and estimate the apparent concentration of binding sites in the reaction. The concentration of binding sites is usually less than the concentration of actin monomers in the reaction because not all of the actin polymerizes and because a single actin binding protein molecule can make contact with multiple monomers on the actin filament.
- Using a statistical program, determine the affinity (Kd) and Bmax from the binding curve by using nonlinear least-squares regression.
NOTE: Scatchard plots are discouraged for analyzing binding data, partly because they can obscure whether binding is saturated and because they can distort experimental error10.
Representative Results
We examined αE-catenin homodimer binding to F-actin in the co-sedimentation assay. Since past experiments have shown that the affinity of αE-catenin homodimer for F-actin is around 1 µM and the Bmax near 111, we performed the assay with a low concentration of F-actin (0.2 µM rather than 2 µM; see the Discussion). Since 0.2 µM is below the critical concentration, phalloidin was added to stabilize the F-actin polymerized from rabbit skeletal muscle G-actin (step 3.3). Increasing concentrations of αE-catenin homodimer (0.125-12.0 µM) were incubated in the presence or absence of 0.2 µM F-actin. The samples were centrifuged, and the resulting pellets were analyzed (Figure 1A). As expected, the αE-catenin homodimer co-sedimented with F-actin above background (Figure 1A, compare the F-actin pellet samples to the no-F-actin pellet samples). BSA was run as a negative control (Figure 1B). Bound protein was quantified and plotted over free protein to calculate the affinity of the interaction (Figure 1C). The plotted data best fit a Hill equation. The calculated Kd was 2.9 µM, the Bmax was 0.2, and the Hill coefficient (h) was 4.8. Thus, αE-catenin homodimer binds F-actin cooperatively with a low micromolar affinity, consistent with previous work (a Kd of 2.9 µM versus ~1.0 µM)11.
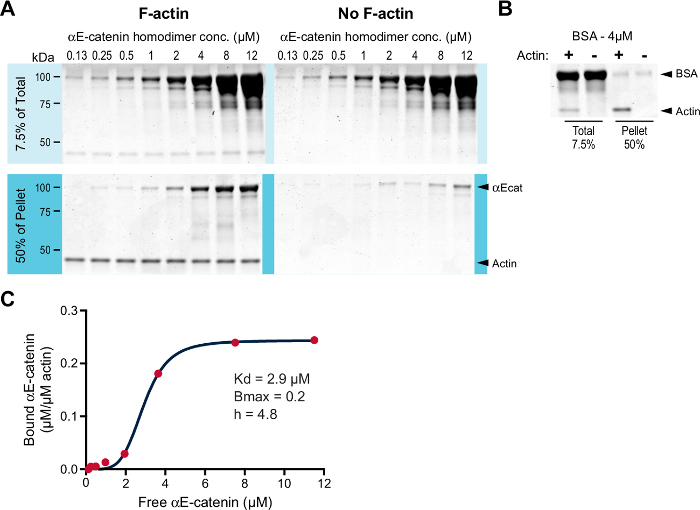
Figure 1: High-speed F-actin co-sedimentation assay. (A) Increasing concentrations (0.125-12.0 µM) of αE-catenin homodimer were incubated with (left panels) or without (right panels) 0.2 µM F-actin stabilized with phalloidin. They were incubated for 30 min at RT and centrifuged. The total (7.5% of the starting material) and pelleted material (50% of the pelleted material) were separated by SDS-PAGE and stained with Coomassie dye. (B) 4 µM BSA was run as a negative control. Total and pellet samples, with (+) or without (-) F-actin, were separated by SDS-PAGE and stained with Coomassie dye. (C) Bound αE-catenin (µM/µM actin) from A was plotted against free αE-catenin (µM), and the data fit to a Hill equation (red line). The Kd, Bmax, and Hill coefficient (h) are listed. Please click here to view a larger version of this figure.
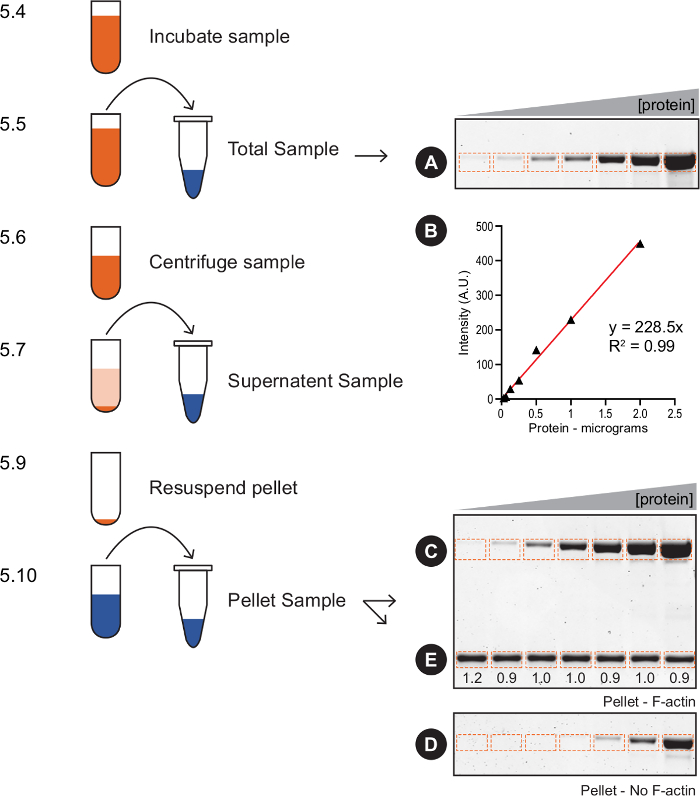
Figure 2: Actin pelleting quantification – flow chart. This schematic outlines key steps in section 5, with examples of Total and Pellet samples (A, C-E) and the standard curve (B) used for quantification. 5.13 steps: 1) Measure the amount of protein of interest in the Total samples (A). 2) Generate a standard curve by plotting the band intensity versus protein mass (B). 3) Measure the amount of protein of interest that co-sedimented with F-actin (C). 4) Measure the amount of protein of interest that pelleted in the absence of F-actin (D). 5) Subtract D from C to determine the amount of protein bound to F-actin. 6) Measure the amount of F-actin in each pellet (E), calculate the average amount of F-actin per sample, and divide each sample by the average (the numbers below show the ratio). 7) For each sample, divide the amount of bound protein (calculated in step 5) by the F-actin pellet ratio (calculated in step 6) to adjust for differences in the pellet. 8) Use the standard curve (B) to calculate the amount (mass) of normalized bound protein in each sample (step 7). 9) Determine the concentration of free protein and bound protein to create a binding curve. Please click here to view a larger version of this figure.
Discussion
The actin co-sedimentation assay is a straightforward technique that can quickly determine if a protein binds F-actin. With some modifications, the technique can also be used to measure the affinity of the interaction. In addition to points raised in the protocol above, the following issues should be considered when designing, conducting, and interpreting the assay.
Protein of Interest
Freshly prepared or frozen protein can be used in the assay. If frozen protein is used, it is highly recommended that the results be compared with fresh (never frozen) protein to ensure that freezing does not affect F-actin binding.
G-actin Source
Many pelleting experiments use G-actin isolated from muscle because of its relative abundance. There are three main actin isotypes in mammals – alpha, beta and gamma – that are remarkably similar (>90% sequence identity). Nonetheless, there are functional differences between the isotypes12,13. If possible, the G-actin isotype used in the binding assay should match the in vivo isotype. For example, if testing a protein expressed in skeletal muscle, alpha-actin is the best choice; if examining a protein expressed in fibroblasts, beta-actin is recommended.
Phalloidin Use
Since phalloidin binds F-actin, it can interfere or even block the binding of some F-actin binding proteins (e.g., phalloidin blocks cofilin from binding to actin filaments)14. Thus, phalloidin should be used with caution and the results compared to non-phalloidin-treated samples when possible.
High Background
It is not uncommon for proteins to sediment in the absence of F-actin (Figure 1A, no F-actin pellet samples). However, high levels of background sedimentation can mask true actin co-sedimentation and make it difficult, if not impossible, to determine if a protein binds F-actin or to measure the affinity of the interaction. Adding polidicanol to the reaction buffer (step 4.1) can significantly reduce the background and is an easy solution. If that does not reduce the background, adjusting the reaction buffer, salt concentration, and/or incubation temperature may help.
Binding Curve
To generate a binding curve, it is necessary to vary the concentration of either the protein of interest or the F-actin over a series of reactions. In practice, it is easier and preferable to maintain F-actin at a fixed concentration and to vary the concentration of the protein of interest. Maintaining F-actin at a fixed concentration (e.g., 2 µM) in the pelleting assay limits non-specific trapping at higher concentrations of F-actin and prevents depolymerization at lower (<0.5 µM) concentrations of F-actin. Depolymerization can be prevented using phalloidin, although this introduces a potential complicating factor into the system (see step 3.3 and above). Maintaining F-actin at a fixed concentration also allows one to compare (and normalize) the F-actin pellet across samples and to identify failed experiments (i.e., where the F-actin pellet is highly variable, preventing analysis across concentrations). Finally, maintaining F-actin at a fixed concentration allows one to determine if the binding to the actin filament is cooperative (Figure 1C).
Saturated Binding
As in all binding experiments, it is critical that the binding to F-actin is saturated and that the concentration of protein plus F-actin plateaus (Figure 1C). Without a plateau, it is not possible to calculate an accurate dissociation equilibrium constant. Thus, it is important to carefully plan the dilution series to be tested and to always include higher concentrations of protein (i.e., at least 5- to 10-fold higher than the expected Kd).
Binding Analysis
In order for the measured dissociation constants to be conclusive, the assay should be performed using an F-actin concentration that allows the concentration of binding sites on F-actin for the protein of interest to be much lower than the affinity. To check whether this criterion was met, estimate the concentration of binding sites from Bmax. For example, if [F-actin] was 2 µM and Bmax = 0.5, then [binding sites] ≈ 1 µM. The Kd should be at least 5- to 10-fold greater than [binding sites]. If the measured Kd is of the same order of magnitude as [binding sites], then it is possible that the observed binding curve represents a titration of high-affinity binding sites rather than a true binding isotherm. If this is observed, repeat the assay using a 10-fold lower F-actin concentration to measure an accurate affinity. For high-affinity interactions, phalloidin stabilization (step 3.3) may be necessary to achieve an F-actin concentration low enough to accurately measure affinity.
Finally, there are fundamental limitations with the co-sedimentation assay that researchers should be aware of when performing and evaluating the assay. Most importantly, the co-sedimentation assay does not produce a true equilibrium constant. The products of binding (i.e., protein plus F-actin) are separated from the reactants during centrifugation, whereupon the products can then dissociate to create a new equilibrium. As a result, the co-sedimentation assay can miscalculate or fail to detect low-affinity interactions. Since many actin-binding proteins have a low (i.e., micromolar) affinity for F-actin, a negative result (i.e., no detectable binding) in the assay does not necessarily mean that a protein does not bind F-actin. As an alternative, TIRF microscopy-based, single-filament binding assays are more sensitive and more accurate for determining a dissociation constant (for reviews on this technique, see references15,16). Despite these limitations, the pelleting assay is within the means of most researchers and is an effective tool to determine if a protein binds F-actin and to measure the affinity of the interaction.
Disclosures
The authors have nothing to disclose.
Acknowledgements
This work was supported by the National Institutes of Health Grant HL127711 to AVK.
Materials
| Sorvall MTX 150 Micro-Ultracentrifuge | ThermoFisher Scientific | 46960 |
| S100-AT3 rotor | ThermoFisher Scientific | 45585 |
| Ultracentrifuge tubes – 0.2 ml | ThermoFisher Scientific | 45233 |
| Actin, rabbit skeletal muscle | Cytoskeleton | AKL99 |
| Bovine Serum Albumin | Sigma | A8531 |
| Polidicanol (Thesit) | Sigma | 88315 |
| Phalloidin | ThermoFisher Scientific | P3457 |
| Dithiothreitol (DTT) | ThermoFisher Scientific | R0862 |
| Adenosine triphosphate (ATP) | Sigma | A2383 |
| Imidazole | Fisher Scientific | O3196 |
| Sodium Chloride (NaCl) | Fisher Scientific | BP358 |
| Magnesium Chloride (MgCl2) | Fisher Scientific | M33 |
| Potassium Chloride (KCl) | Fisher Scientific | P217 |
| Ethylene glycol-bis(β-aminoethyl ether)-N,N,N',N'-tetraacetic acid (EGTA) | Sigma | 3779 |
| Odyssey CLx Imaging System | LI-COR | |
| Coomassie Brilliant Blue R-250 Dye | ThermoFisher Scientific | 20278 |
| Colloidal Blue Staining Kit | ThermoFisher Scientific | LC6025 |
References
- Pollard, T. D. Actin and Actin-Binding Proteins. Cold Spring Harb Perspect Biol. 8 (8), (2016).
- Hansen, M. D., Kwiatkowski, A. V. Control of actin dynamics by allosteric regulation of actin binding proteins. Int Rev Cell Mol Biol. 303, 1-25 (2013).
- Lappalainen, P. Actin-binding proteins: the long road to understanding the dynamic landscape of cellular actin networks. Mol Biol Cell. 27 (16), 2519-2522 (2016).
- Mullins, R. D., Hansen, S. D. In vitro studies of actin filament and network dynamics. Curr Opin Cell Biol. 25 (1), 6-13 (2013).
- Miller, P. W., et al. Danio rerio alphaE-catenin is a monomeric F-actin binding protein with distinct properties from Mus musculus alphaE-catenin. J Biol Chem. 288 (31), 22324-22332 (2013).
- Wickline, E. D., et al. alphaT-Catenin Is a Constitutive Actin-binding alpha-Catenin That Directly Couples the Cadherin.Catenin Complex to Actin Filaments. J Biol Chem. 291 (30), 15687-15699 (2016).
- Simpson, R. J., Adams, P. D., Golemis, E. . Basic methods in protein purification and analysis : a laboratory manual. , (2009).
- Laemmli, U. K. Cleavage of structural proteins during the assembly of the head of bacteriophage T4. Nature. 227 (5259), 680-685 (1970).
- Dyballa, N., Metzger, S. Fast and sensitive colloidal coomassie G-250 staining for proteins in polyacrylamide gels. J Vis Exp. (30), (2009).
- Pollard, T. D. A guide to simple and informative binding assays. Mol Biol Cell. 21 (23), 4061-4067 (2010).
- Hansen, S. D., et al. alphaE-catenin actin-binding domain alters actin filament conformation and regulates binding of nucleation and disassembly factors. Mol Biol Cell. 24 (23), 3710-3720 (2013).
- Perrin, B. J., Ervasti, J. M. The actin gene family: function follows isoform. Cytoskeleton (Hoboken). 67 (10), 630-634 (2010).
- Tondeleir, D., Vandamme, D., Vandekerckhove, J., Ampe, C., Lambrechts, A. Actin isoform expression patterns during mammalian development and in pathology: insights from mouse models. Cell Motil Cytoskeleton. 66 (10), 798-815 (2009).
- Prochniewicz, E., Janson, N., Thomas, D. D., Dela Cruz, E. M. Cofilin increases the torsional flexibility and dynamics of actin filaments. J Mol Biol. 353 (5), 990-1000 (2005).
- Kuhn, J. R., Pollard, T. D. Real-time measurements of actin filament polymerization by total internal reflection fluorescence microscopy. Biophys J. 88 (2), 1387-1402 (2005).
- Hansen, S. D., Zuchero, J. B., Mullins, R. D. Cytoplasmic actin: purification and single molecule assembly assays. Methods Mol Biol. 1046, 145-170 (2013).
