A high-throughput cold physical plasma treatment protocol of liquids and cells is shown. It involves setting up different feed gas compositions for plasma ignition, measuring the plasma's emission spectra, and the subsequent analysis of liquids and cellular activity after plasma treatment.
Method Article
Basic Research in Plasma Medicine - A Throughput Approach from Liquids to Cells
In This Article
Summary
Abstract
In plasma medicine, ionized gases with temperatures close to that of vertebrate systems are applied to cells and tissues. Cold plasmas generate reactive species known to redox regulate biological processes in health and disease. Pre-clinical and clinical evidence points to beneficial effects of plasma treatment in the healing of chronic ulcer of the skin. Other emerging topics, such as plasma cancer treatment, are receiving increasing attention. Plasma medical research requires interdisciplinary expertise in physics, chemistry, and biomedicine. One goal of plasma research is to characterize plasma-treated cells in a variety of specific applications. This includes, for example, cell count and viability, cellular oxidation, mitochondrial activity, cytotoxicity and mode of cell death, cell cycle analysis, cell surface marker expression, and cytokine release. This study describes the essential equipment and workflows required for such research in plasma biomedicine. It describes the proper operation of an atmospheric pressure argon plasma jet, specifically monitoring its basic emission spectra and feed gas settings to modulate reactive species output. Using a high-precision xyz-table and computer software, the jet is hovered in millisecond-precision over the cavities of 96-well plates in micrometer-precision for maximal reproducibility. Downstream assays for liquid analysis of redox-active molecules are shown, and target cells are plasma-treated. Specifically, melanoma cells are analyzed in an efficient sequence of different consecutive assays but using the same cells: measurement of metabolic activity, total cell area, and surface marker expression of calreticulin, a molecule important for the immunogenic cell death of cancer cells. These assays retrieve content-rich biological information about plasma effects from a single plate. Altogether, this study describes the essential steps and protocols for plasma medical research.
Introduction
Reactive species are important redox regulators in disease, including abnormal wound healing1 and cancer.2 Importantly, these species are involved in the pathology as well as its therapeutic resolution.3,4 Cold physical plasma is an ionized gas that expels reactive species of many kinds.5 Since the advent of so-called cold plasmas that operate at body temperature6, cold plasmas can be applied to cells and tissues without thermal harm. By demonstrating the efficacy and safe application of plasma devices in pre-clinical and clinical observations, three have received accreditation as medical devices in Germany.7 Especially with regard to genotoxic safety, several studies have shown the absence of mutagenic events using the first device, an atmospheric pressure argon plasma jet.8,9,10 The other two devices are so-called dielectric barrier discharges (DBD), which operate via a different principle than plasma jet. Specifically, jets allow for scalpel-like treatment of surfaces and cavities whereas DBD plasmas are efficient in treating larger but rather flat tissue areas. Exploiting cellular redox signaling11, the aim of the technique is to utilize plasma-generated reactive species for biomedical applications.12 An especially promising application of clinical plasma therapy is the support of wound healing.13,14,15 Furthermore, plasma was shown to have anticancer effects in animal models.16,17,18
Before validating the efficacy and safety of plasma applications in animal models, or even humans, standardized in vitro research needs to be carried out with plasma devices. These experiments are essential to explore plasma applications and to delineate the mechanisms at work. Moreover, basic research is needed to understand the impact of the composition of reactive species and subsequent biological effects. This study demonstrates how plasma can be integrated into biomedical research to better understand and control its effects on cells. It describes the tuning of the feed gas composition, monitoring of reactive species output, applications of plasma to liquids, cells, and tissues, and the resultant chemical and biological outcomes. Furthermore, examples are provided which instruct on the standardization of plasma treatment and downstream biological assays, with an emphasis placed on plasma medical research done in 96-well plates. This approach has distinct advantages: i) minimization of the number of cells needed per condition, reagent costs, and hands-on time per sample; ii) allowance of greater accuracy of results as duplicate or triplicate treatments can be set up with ease; and iii) facilitation of seamless downstream assaying in 96-well format plate reader, imaging, and flow cytometry experiments.
Protocol
1. Plasma Species Monitoring and Treatment Setup
- Plasma Species Monitoring
- Use an atmospheric pressure plasma jet and a maximum of two standard liters per minute feed gas flux.
- Perpendicular to the plume axis, position the jet in front of an optical emission spectrophotometer, and record photoemission and wavelength (200 - 1,000 nm) using dedicated software.
- Mix 0.5% of nitrogen or oxygen to either dry or humidified (5%) feed gas.
- Repeat optical emission spectroscopy for each gas condition.
- Analyze with software appropriate for graphical display of data.
- Plasma treatment setup
- Fix the jet to a computer-driven xyz-table.
- Identify the position of the wells and generate a computer script to move the jet joined to the table, with the appropriate treatment times, above the center of each well.
- Add 104 of any type of mammalian adherent cells in 100 µL of complete cell culture medium (RPMI1640 with 10% FCS, 2% glutamine, and 1% penicillin/streptomycin) into several wells under a laminar flow hood.
- Allow cellular adhesion to occur overnight at 37 °C in a humidified atmosphere with 5% carbon dioxide.
- Treat the cells with plasma for 20 s at different heights (z-axis) at 250 µm intervals.
- Add 25 µL of propidium iodide in cell culture medium to each well.
- Image the cells under the microscope to determine the specific height that does not induce cell necrosis due to the feed gas pushing the culture medium on top of the cells aside.
NOTE: For longer treatment times, identify liquid evaporation at this particular height, in plasma on and off mode, by weighing the plate before and after plasma treatment to identify the quantity of microliters of doubledistilled water necessary to reestablish osmotic homeostasis in the treated wells. - Prepare a final protocol for the xyz-table with respective treatment times (here: 20 s, 40 s, 60 s plasma and 60 s gas control) and well positions, and have ready multichannel pipettes and reservoirs for liquid handling of 96-well plates in subsequent assays.
2. Analysis of Major Reactive Components in Plasma-treated Liquids
- Analysis of Plasma-Treated Hydrogen Peroxide
- Treat 100 µL of phosphate-buffered saline (PBS) with plasma in triplicate in flat-bottom 96-well plates.
- Prepare a master mix by loading 100 µL of PBS with 10 U of horseradish peroxidase and 5 µM of hydrogen peroxide detection reagent (sufficient for one well; scale up accordingly).
- Add 95 µL of master mix to each well.
NOTE: The previous step should be performed under a clean bench or in a room separate from that of the plasma source as ambient air ozone can decrease the sensitivity of the assay. - In a separate plate, prepare a two-fold dilution series of hydrogen peroxide in PBS with a top concentration of 100 µM in 100 µL PBS.
- Add 5 µL of samples or hydrogen peroxide standards to wells containing the detection reagent.
- Include wells containing detection reagent only for background subtraction after the read-out.
- Incubate the plate in the dark for 15 min at room temperature.
- Place the plate in the microplate reader measuring fluorescence at λex 535 nm and λem 590 nm.
NOTE: If high peroxide concentrations are expected in the samples, the sample dilution needs to be increased or readings need be done with shorter incubation times to avoid saturation of the assay. - Subtract blank values from all samples, calculate the peroxide standard curve, and quantify unknown sample peroxide concentrations from that baseline curve.
- Analysis of Plasma-Treated Nitrite
- Treat 100 µL of PBS with plasma in triplicate in flatbottom 96well plates.
- Prepare a master mix of nitrite detection solution by adding 1 µL of quantification reagent to 99 µL of doubledistilled water (sufficient for one well; scale up accordingly).
- Add 100 µL per well to a clear, flatbottom 96well plate. Scale up as needed for the number of wells.
- Prepare a dilution series of nitrite standards in doubledistilled water.
- Add 10 µL of standards or samples to the master mix in 96well plates.
- Incubate the plate in the dark for 10 min at room temperature.
- Add 5 µL of nitrite quantification developer solution to each well.
- Read fluorescence in a microplate reader at λex 365 nm and λem 450 nm.
- Subtract blank values from all samples, calculate the nitrite standard curve, and quantify unknown sample nitrite concentrations from that baseline curve.
- Analysis of Plasma-Treated Superoxide
- Make a master mix of oxidized cytochrome (1 mg/mL) and catalase (20 µg/mL) in PBS.
- Add 100 µL of master mix to the wells of a clear, flat-bottom 96-well plate.
- Treat the master mix with plasma in triplicate per treatment condition.
- Read absorbance at 550 nm using a microplate reader; graph this data.
- Calculate the amount of superoxide generated using the molar extinction coefficient of cytochrome C and the light path length of liquid within a well.
3. The Biological Response of Cells Exposed to Plasma
- Multidimensional Read-Out of Plasma-Treated Cells: Metabolic Activity
- Use a laminar flow hood for all of the following procedures.
- Seed 104 cells (B16 murine melanoma) in 100 µL fully supplemented cell culture medium per well in flat-bottom 96-well plates.
- Allow cellular adhesion overnight at 37 °C in the humidified atmosphere of the incubator with 5% carbon dioxide.
- Using the xyz-table, treat wells with plasma or gas alone according to a predefined scheme, and add the cells back into the incubator for 20 h.
NOTE: If desired, take off supernatants after 20 h to analyze extracellular products; add 100 µL of fresh medium afterwards. - To each well, add 25 µL of cell culture medium containing 500 µM resazurin (final concentration 100 µM); prepare three wells containing resazurin alone in cell culture medium without cells for background subtraction.
- Incubate for 3 h in the incubator.
- Read fluorescence at λex 535 nm and λem 590 nm in a microplate reader.
- Subtract background fluorescence from all samples, and normalize data to control values.
- Multidimensional Read-Out of Plasma-Treated Cells: Image Analysis
- Use the well plate from 3.1.7 and discard supernatant.
- Add 100 µL of fresh cell culture medium containing 1 µg/mL propidium iodide.
- Put the plate under a microscope with a motorized stage to image each well.
NOTE: Imaging details depend on the experimental question; here, a 20X objective was used in a high-content imaging device to read 3x3 fields of view in each well in a bright field channel, digital phase contrast channel, and fluorescence (propidium iodide) channel, utilizing appropriate excitation light and emission filters. - Use quantitative image analysis software to determine the total cytosolic area in digital phase contrast images of all fields of view imaged in each well.
NOTE: Analyze further parameters if desired, for instance, the number of viable and/or dead cells or mitochondrial activity using dedicated stains. If using other stains than described in this work, make sure that fluorescence stains used for microscopy do not spectrally overlap with the fluorochromes used in subsequent flow cytometry experiments. - Graph the data, and if desired, test for correlation with the values obtained for metabolic activity.
- Multidimensional Read-Out of Plasma-Treated Cells: Flow Cytometry
- For this analysis, use the well plate from step 3.2.5.
- Discard the supernatant and wash twice with 200 µL of PBS containing calcium and magnesium (0.9 mM and 0.5 mM, respectively).
NOTE: Fix and/or permeabilize cells at this stage for further biological readouts not covered in this contribution, such as the staining of intracellular antigen or cell cycle analysis. - To each well, add 50 µL of PBS with calcium and magnesium containing 50 ng/mL anti-mouse calreticulin monoclonal antibodies.
- Incubate for 15 min in the incubator.
- Wash twice with 200 µL of fully supplemented cell culture medium and discard the liquid in the plate.
- Add 100 µL of cell detachment solution to each well, and incubate for 20 min in the incubator.
- Use another set of unstained B16 cells in suspension to setup the flow cytometric acquisition protocol, gating strategy, and gains and voltages of photodetectors.
- Load the plate into a flow cytometer equipped with an auto sampler for 96-well plates.
- Acquire a minimum of 1,000 cells in the forward and side scatter population usually associated with viable cells.
- Use software dedicated for the analysis of flow cytometry, .fcs files to gate the population of interest, and determine the mean fluorescence intensity of calreticulin.
- Graph data, and if desired, test for correlation with the values obtained for metabolic activity, imaging, and/or oxidant deposition.
Results
In this study, a streamlined workflow was described for medical research into the effects of plasma. The multidisciplinary approach utilized here analyzes the basic optical emission profile of the plasma jet, the main reactive components in the liquid, and the biological responses of cells treated with plasma (Figure 1).
To conduct this workflow, a number of components were needed to properly set up the plasma source (Figure 2). The different gases (here mainly argon, oxygen, and nitrogen) were supplied to and controlled by several mass flow controllers. A central panel was used to digitally adjust the mass flow controllers to predetermined feed gas fluxes. To yield specific feed gas compositions, the gases were physically mixed utilizing a panel of valves that combined gases from several mass flow controllers (Figure 2A). The plasma source was switched on, and the plasma effluent was set up in front of a USB-spectrophotometer (Figure 2B) with an optical range of 200 nm to 1,000 nm. For treatment of liquids and cells, an efficient workflow was described using 96-well plates. Multi-well dishes were held in place using a plastic frame that was fixed on the base plate with insertions matched to its imprinted holes (Figure 2C). The entire setup was placed under a laminar flow hood (Figure 2D). This setup included an xyz-table to which the hand-held piece of the plasma jet was mounted. The motor control elements can be located outside the bench, if the latter has sufficiently large cable ports from and to the xyz-table. Importantly, the table was computer-controlled and can be programmed to hover the jet over the center of each well with micrometer precision for the desired amount of time. Moreover, the start position (as in our setup, well A1) was freely chosen (Figure 2E). Together with the plastic plate holder, this allowed for a reproducible plasma treatment with any day-to-day variations solely related to the setup of the liquid and biological experiments.
Optical emission spectroscopy (OES) was used to follow distinct peaks linked to reactive plasma components in different feed gas conditions (Figure 3A). For example, the second positive system of nitrogen with peaks from 330 nm to 380 nm represented reactive nitrogen species, and the peak at 309 nm represented hydroxyl radicals (arrow in Figure 3A). Compared to argon gas alone, the presence of nitrogen species increased with a mixture of nitrogen into the feed gas, whereas the addition of oxygen or humidity diminished or reduced it, respectively. By contrast, the presence of hydroxyl radicals was decreased with oxygen or nitrogen but markedly increased if humidified argon was used as feed gas. For plasma treatment of liquids, the evaporation caused by the argon gas and argon plasma was determined first (Figure 3B). Importantly, both conditions did not yield similar results because plasma also exerts effects on temperature. In line with the OES results of hydroxyl radicals, hydrogen peroxide deposition significantly decreased with oxygen or nitrogen admixture but increased with humidified feed gas (Figure 3C). Moreover, the addition of nitrogen to the feed gas led to significantly higher nitrite concentrations compared to argon plasma-treated liquids (Figure 3D). This workflow might also be employed to investigate the impact of plasma on liquids with different compositions. For example, hydrogen peroxide concentrations seemed to be independent of the presence of fetal calf serum in PBS and RPMI1640 cell culture medium (Figure 3E). In the same samples, the presence of serum decreased nitrite concentrations in PBS and cell culture medium compared to their non-serum containing counterparts (Figure 3F). Most superoxide was produced in the dry argon gas conditions with oxygen and/or nitrogen admixtures significantly quenching superoxide generation, except for the humidified argon-oxygen plasma (Figure 3G).
For plasma treatment of cells in multi-well dishes, the plate containing cells seeded the day before was removed from the incubator and added to the plastic holder. A programmed treatment pattern was applied, evaporation was compensated for, and the plate was placed back into the incubator for 20 h. Note that after this incubation, cell culture supernatants could have been collected into a new, empty 96-well plate and stored at -80 °C for the assessment of proteins of interest. Next, resazurin was added to the cells of each well. Turnover of non-fluorescent resazurin to fluorescent resorufin was only facilitated by active NADPH-generating enzymes and was correlated with overall metabolic activity (Figure 4A). Fluorescence intensities were similar to the visual perception of the plate, and indicated cytotoxic effects of prolonged plasma treatment (Figure 4B). Humidified gas conditions were more harmful than dry gas conditions. The same cells in the plate were utilized for further downstream assays. Cells in the plate were microscopically investigated (Figure 4C). Using imaging software, several wells of the plate were examined for qualitative comparison (Figure 4D). Software allowed the quantification of the total area covered by cells within the fields of view acquired in each well and the resulting data were normalized to respective controls (Figure 4E). A decrease of total cell area was seen in the plasma treatment samples, especially with the humidified feed gas conditions. After imaging, the cells were washed, stained with anti-mouse calreticulin antibodies, detached, and analyzed with flow cytometry (Figure 4F). Mean fluorescence intensities of calreticulin staining in viable cells (Figure 4G) were calculated and compared between samples (Figure 4H). Plasma treatment induced an upregulation of calreticulin on murine melanoma cell surface, which corresponded to the plasma treatment time applied with dry feed gas conditions. For humidified feed gas conditions, 20 s and 40 s of treatment induced a stronger calreticulin exposure compared to the more lethal 60 s treatment time. This suggests there was a non-linear regulation of calreticulin exposure with regard to the amount of oxidants introduced to the cells.

Figure 1: Workflow of plasma medical research from physics to biology. The reactive species output of the atmospheric pressure argon plasma jet is tuned by modulating the feed gas. Selected molecules in the plasma gas phase are monitored using spectroscopy. The plasma is used to treat liquids and investigate oxidant deposition. Cells cultured in microplates are plasma-treated, and biological readouts are performed. Please click here to view a larger version of this figure.

Figure 2: Setup of the plasma research bench. (A) Different gases in stainless steel pipes are driven into several mass flow controllers that are controlled via a central panel. The individual feed gas composition is mixed thereafter using a panel of valves. (B) Some reactive components of the plasma can be monitored using optical emission spectroscopy to investigate differences between various feed gas compositions. (C) For high-throughput plasma research, 96-well microplates are used. To ensure a constant starting point for programmable and automated plasma treatment, the plate is added to a frame guaranteeing the same absolute position of plates from day to day. (D) The plasma jet is fixed to a computer-controlled xyz-table located under a laminar flow hood. All 96 exact locations and the dwell-time of the plasma over each well is written into a program file to guide the movement of the plasma source. The main housing of the plasma jet apparatus as well as the motor controls are located in close proximity. (E) Automated plasma treatment of a 96-well plate. Please click here to view a larger version of this figure.
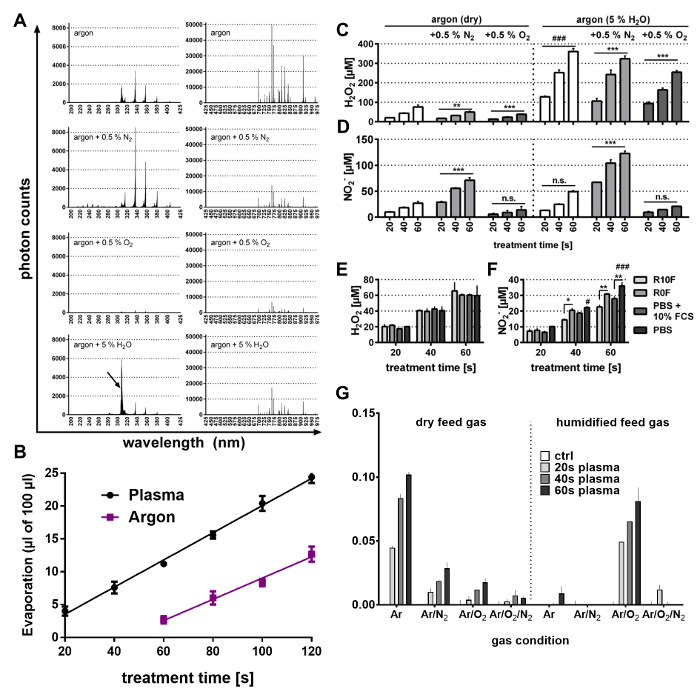
Figure 3: Plasma jet and liquid analysis. (A) Optical emission spectroscopy of different feed gas conditions is shown. The second positive system of nitrogen (330 nm to 380 nm) was increased with admixture of nitrogen, absent in the case of oxygen admixture, and markedly reduced with humidified argon (lefthand panels). The peak of hydroxyl radicals at 309 nm (arrow) decreased in nitrogen and oxygen conditions but markedly increased with humidified argon compared to argon gas alone. (B) Gas exposure of liquids leads to evaporation. The amount of evaporation per well in a 96well plate upon treatment with plasma and argon gas alone was determined by weighing the plate before and after treatment using a fine scale. Evaporation in plasmatreated samples was higher compared to that in argon gastreated samples. (C) Generation of hydrogen peroxide in plasmatreated liquids correlated to some extent with the 309 nm peak of hydroxyl radicals in (A). Humidified (5%) argon plasma increased peroxide concentrations about 4fold. (D) Nitrite was elevated when nitrogen was added to the feed gas, and this effect was increased with humidified argon plasma. The addition of oxygen decreased nitrite generation but not significantly. (E, F) Hydrogen peroxide and nitrite concentrations is shown in different types of liquids, namely RPMI1640 cell culture medium with (R10F) and without (R0F) as well as PBS with and without fetal calf serum (FCS). Peroxide levels did not differ between different media (E) whereas nitrite levels were significantly decreased in presence of serum. (G) Superoxide production was highest for dry argon gas feed gas; admixture of nitrogen, oxygen, or humidified argon gave lower superoxide deposition in the liquid. Data shown (B-G) are the mean +SEM of two to three experiments. Statistical analysis was performed (C, D) using one-way analysis of variance comparing whole group means of dry or humid feed gas conditions against the respective control (** p <0.01; *** p <0.001). Additionally, argon gas-only plasma conditions were compared using whole group mean and the t-test (### p <0.001). Further statistical analysis (F) was performed using t-tests comparing the values of each plasma treatment and medium condition in the samples with FCS and without FCS (* p <0.05; ** p <0.01); also, FCS or non-FCS containing solutions were compared within each plasma treatment time using the t-test (# p <0.05; ## p <0.001). Please click here to view a larger version of this figure.
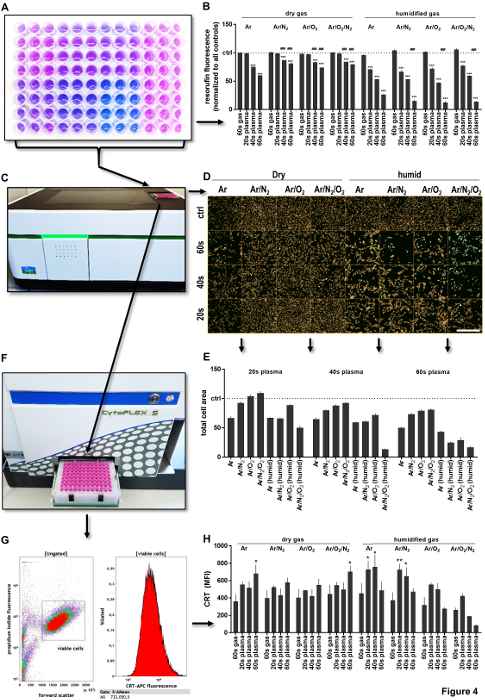
Figure 4: Plasma treatment and its impact on cells. (A) Cells were exposed to plasma and resazurin was added after 20 h to assess metabolic activity. (B) Activity was significantly decreased in plasmatreated samples compared to gas controls. A marked decrease was seen with humidification of the feed gas whereas addition of oxygen and/or nitrogen leads to toxicity in both dry and humid argon gas conditions. (C) Medium containing propidium iodide (PI) was added. (D) An overview is shown of the wells of the plate with digital phase contrast (orange) representing the cytosolic fraction of each cell and PI (green) to identify dead cells. Imaging tools allowed the quantifying of the total area within the field of view of each well covered with cells. (F) Cells were subsequently washed and incubated with antibodies or other cell markers to characterize biological plasma effects using flow cytometry. (G) Gating strategies were employed and marker analysis was performed and compared between samples. Data shown (B, E, H) denote the mean +SEM of one representative of three independent experiments. Scale bar = 200 µm (D). Statistical comparison was performed using two-way analysis of variances (B, H) comparing, for each gas condition, each plasma treatment to its respective gas control (* p <0.05; ** p <0.01; *** p <0.001). Additionally, the values for each condition of nitrogen and/or oxygen admixtures were compared to values of argon gas plasma for dry and humid conditions separately (two-way analysis of variances; ### p <0.001). Please click here to view a larger version of this figure.
Discussion
Basic research is fundamental for developing an understanding of the efficacy of and mechanisms underpinning plasma medicine in preclinical and clinical research. Fundamental research also promotes the investigation of new applications for treatments. While it is well established that plasmas mediate their biological effects via generation of reactive oxygen and nitrogen species19, there are still three main challenges to the field. First, which species are important? This can be partly answered by modulating the feed gas composition of plasmas with optical diagnostics and biological readouts.20 Second, what effects can be seen in biological targets such as cells? This is, at least in part, addressed using cell culture experiments and a number of assays. In eukaryotic cells, effects are pleiotropic including cell cycle arrest21, apoptosis22, necrosis23, and skin cell stimulation24,25,26, as well as a support or decrease of cell motility or metabolic activity27,28,29. The third challenge, relating to these pleiotropic effects, is to identify key molecules that determine the cellular response to plasma-derived oxidants to explain different effects often seen in different cell types. This can be done by omics techniques30,31,32 and/or up or downregulation of target genes using siRNA (redox) signaling inhibitors, antioxidants and antioxidant enzymes, as well as modulation of the plasma's reactive species output.33,34,35 Hence, streamlined assay protocols are needed to test larger sample sets with large numbers of iterations.
This study exemplifies an efficient experimental workflow, from physics to biology, for plasma medical research with regard to the aforementioned challenges. Details on the engineering aspects of the plasma source and plasma generation have been described before.36,37,38 All of these assays are performed in 96well plates, which has a number of advantages. For instance, samples such as cell culture supernatants can be easily carried from assay to collection plates to investigate, for example, protein concentrations via enzyme-linked-immunosorbent-assay. If scientific equipment capable of reading directly from 96-wells is available, such an approach minimizes costs per sample and handsontime and maximizes results by multiplexing different assays from the same sample. The usage of multichannel pipettes additionally speeds up sample handling. In principle, the assay described here can also be carried out using well plate formats with larger well diameters, though this would require additional pipetting steps into other tubes and vessels for downstream assays. Smaller plate types such as 384well plates, however, do not present the geometry suitable for biomedical plasma research using jets with large feed gas fluxes. Specifically, it cannot be guaranteed that only single but not adjacent wells are affected during a treatment.
Liquid analysis is essential to investigate species deposition by the plasma. In expert analyses, a parallel setup of different assays can characterize plasmatreated liquids with regard to different oxidants at the same time. This multiplexing allows developing a differentiated picture of plasmaderived species. The described approach is highly sensitive to investigate hydrogen peroxide concentrations39, which is often necessary but not always sufficient to explain plasma effects.40,41,42 Biologically relevant effects can also be assessed in liquids with a glutathione assay not included here.43 The specific nitrite assay is strongly recommended over conventional Griess-Assays due to 10fold higher assay sensitivity (data not shown). Plasmatreated liquids can also be investigated for the formation of hypochlorous acid using the DTNB-Assay. Yet, previous results did not indicate the formation of that species with our plasma source.19,39,44 After plasma treatment has finished, species deterioration takes place over time. Nitrite reacts to nitrate; also, peroxide is consumed over time. However, these processes take several hours.35 Cytochrome c absorption is stable over several hours as well. Therefore, if processes occur within the first 30 min after treatment, variation in concentrations of the long-lived species described here are negligible. However, care must be taken when investigating certain types of media (e.g., Dulbecco's Modified Eagle Medium) as ingredients can scavenge up to 90% peroxide within 1 h (data not shown) leading to an underestimation of plasma peroxide deposition into liquids.
A multiplex assay is presented which ranges from investigating metabolic activity over cell area (morphology) to cell surface marker expression. A combination of these assays may reveal interesting results. For example, we have previously shown in THP1 monocytes that metabolic activity and cell counts do not decrease in a linear fashion following exposure to plasma.45 Rather, with increasing plasma treatment time, cells were observed that were increased in size and had a higher mitochondrial mass, thus leading to higher metabolic rates on a percell basis. Essentially, the combination of multiplate reader, microscopy, and flow cytometry multiplexes information on cellular responses following plasma treatment. In melanoma cells, we here focus on cytotoxic effects and their immunogenicity mediated by calreticulin.46 In principle, many other questions can be addressed with this approach linking metabolic activity with imaging and flow cytometry results. For example, cell differentiation (e.g. macrophage polarization), mitochondrial membrane potential, cell cycle analysis, cell motility, biomechanics, or micronucleus formation for analysis of genotoxicity can also be investigated in plasma-treated cells. Multicolor flow cytometry allows for even more applications in different cell populations at the same time. This includes, for example, the analysis of the phosphorylation status of signaling proteins such as transcription factors, mRNA quantification, measurement of intracellular cytokines, and/or assessment of total reduced thiols on a single cell level. Additional biologically relevant information that is available for each sample aids in further developing the picture of plasma redox effects to better understand current and future plasma applications.
Disclosures
The authors have nothing to disclose.
Acknowledgements
Funding from the German Federal Ministry of Education and Research (BMBF grant numbers 03Z22DN11 and 03Z22DN12) is gratefully acknowledged.
Materials
| Name | Company | Catalog Number | Comments |
|---|---|---|---|
| accutase | BioLegend | 423201 | |
| amplex Ultra Red detection kit (includes horse-radish peroxidase and H2O2) | Thermo | A36006 | |
| argon gas | Air Liquide | N50 | |
| B16F10 murine melanoma cells | ATCC | CRL-6475 | |
| catalase | Sigma | C30 | |
| cell culture incubator | Binder | CB210 | |
| cell culture plastic | NUNC | 156545 | |
| cytochrome c, oxidized | Sigma | C2037 | |
| data analysis | GraphPad software | prism 7.03 | |
| fetal bovine serum | Sigma | batch-tested | |
| fine scale | any with resolution of 0.01mg | ||
| flow cytometer | Beckman-Coulter | CytoFlex S | |
| flow cytometry data analysis | Beckman-Coulter | Kaluza 1.5a | |
| Glutamine | Sigma | G7513 | |
| imaging quantification software | PerkinElmer | Harmony 4.5 | |
| laminar flow hood | Thermo | Maxisafe 2020 | |
| mass flow controller | MKS | G-series | |
| Measure-iT nitrite detection kit | Thermo | M36051 | |
| microscope | PerkinElmer | Operetta CLS | |
| optical emssion spectroscopy | Avantes | AvaSpec-DDDD-2-USB2 | |
| penicilin/streptomycin | Thermo | 15140122 | |
| pipettes | Eppendorf/Brand | single/multi chanel | |
| plate reader | Tecan | M200pro | |
| propidium iodide | BioLegend | 421301 | |
| resazurin | VWR | B21187.06 | |
| RPMI1640 cell culture media | PanbioTech | P04-16500 | |
| xyz table | CNC step | HIGH-Z S-400/T |
References
- Sen, C. K. The general case for redox control of wound repair. Wound Repair Regen. 11 (6), 431-438 (2003).
- Acharya, A., Das, I., Chandhok, D., Saha, T. Redox regulation in cancer: a double-edged sword with therapeutic potential. Oxid Med Cell Longev. 3 (1), 23-34 (2010).
- Sen, C. K. Wound healing essentials: let there be oxygen. Wound Repair Regen. 17 (1), 1-18 (2009).
- Cui, X. Reactive oxygen species: the achilles' heel of cancer cells. Antioxid Redox Signal. 16 (11), 1212-1214 (2012).
- Graves, D. B. The emerging role of reactive oxygen and nitrogen species in redox biology and some implications for plasma applications to medicine and biology. Journal of Physics D-Applied Physics. 45 (26), 263001(2012).
- Weltmann, K. D., et al. Atmospheric-pressure plasma sources: Prospective tools for plasma medicine. Pure Appl Chem. 82 (6), 1223-1237 (2010).
- Bekeschus, S., Schmidt, A., Weltmann, K. -D., von Woedtke, T. The plasma jet kINPen - A powerful tool for wound healing. Clinical Plasma Medicine. 4 (1), 19-28 (2016).
- Wende, K., et al. Risk assessment of a cold argon plasma jet in respect to its mutagenicity. Mutat Res Genet Toxicol Environ Mutagen. 798-799, 48-54 (2016).
- Kluge, S., et al. Investigating the Mutagenicity of a Cold Argon-Plasma Jet in an HET-MN Model. PLoS One. 11 (9), 0160667(2016).
- Schmidt, A., et al. One Year Follow-Up Risk Assessment in SKH-1 Mice and Wounds Treated with an Argon Plasma Jet. Int J Mol Sci. 18 (4), 868(2017).
- Hanschmann, E. M., Godoy, J. R., Berndt, C., Hudemann, C., Lillig, C. H. Thioredoxins, glutaredoxins, and peroxiredoxins--molecular mechanisms and health significance: from cofactors to antioxidants to redox signaling. Antioxid Redox Signal. 19 (13), 1539-1605 (2013).
- Weltmann, K. D., von Woedtke, T. Plasma medicine-current state of research and medical application. Plasma Phys Controlled Fusion. 59 (1), 014031(2017).
- Metelmann, H. R., et al. Experimental Recovery of CO2-Laser Skin Lesions by Plasma Stimulation. Am J Cosmet Surg. 29 (1), 52-56 (2012).
- Brehmer, F., et al. Alleviation of chronic venous leg ulcers with a hand-held dielectric barrier discharge plasma generator (PlasmaDerm((R)) VU-2010): results of a monocentric, two-armed, open, prospective, randomized and controlled trial (NCT01415622). J Eur Acad Dermatol Venereol. 29 (1), 148-155 (2015).
- Isbary, G., et al. Successful and safe use of 2 min cold atmospheric argon plasma in chronic wounds: results of a randomized controlled trial. Br J Dermatol. 167 (2), 404-410 (2012).
- Brulle, L., et al. Effects of a non thermal plasma treatment alone or in combination with gemcitabine in a MIA PaCa2-luc orthotopic pancreatic carcinoma model. PLoS One. 7 (12), 52653(2012).
- Mirpour, S., et al. Utilizing the micron sized non-thermal atmospheric pressure plasma inside the animal body for the tumor treatment application. Sci Rep. 6, 29048(2016).
- Utsumi, F., et al. Effect of indirect nonequilibrium atmospheric pressure plasma on anti-proliferative activity against chronic chemo-resistant ovarian cancer cells in vitro and in vivo. PLoS One. 8 (12), 81576(2013).
- Jablonowski, H., von Woedtke, T. H. Research on plasma medicine-relevant plasma-liquid interaction: What happened in the past five years. Clinical Plasma Medicine. 3 (2), 42-52 (2015).
- Reuter, S., et al. From RONS to ROS: Tailoring Plasma Jet Treatment of Skin Cells. Ieee Transactions on Plasma Science. 40 (11), 2986-2993 (2012).
- Gherardi, M., et al. Atmospheric Non-Equilibrium Plasma Promotes Cell Death and Cell-Cycle Arrest in a Lymphoma Cell Line. Plasma Processes and Polymers. 12 (12), 1354-1363 (2015).
- Bundscherer, L., et al. Viability of human blood leucocytes compared with their respective cell lines after plasma treatment. Plasma Medicine. 3 (1-2), 71-80 (2013).
- Hirst, A. M., et al. Low-temperature plasma treatment induces DNA damage leading to necrotic cell death in primary prostate epithelial cells. Br J Cancer. 112 (9), 1536-1545 (2015).
- Arndt, S., et al. Effects of cold atmospheric plasma (CAP) on ss-defensins, inflammatory cytokines, and apoptosis-related molecules in keratinocytes in vitro and in vivo. PLoS One. 10 (3), 0120041(2015).
- Korolov, I., Fazekas, B., Szell, M., Kemeny, L., Kutasi, K. The effect of the plasma needle on the human keratinocytes related to the wound healing process. Journal of Physics D-Applied Physics. 49 (3), 035401(2016).
- Schmidt, A., von Woedtke, T., Bekeschus, S. Periodic Exposure of Keratinocytes to Cold Physical Plasma: An In Vitro Model for Redox-Related Diseases of the Skin. Oxid Med Cell Longev. 2016, Harmful and Beneficial Role of ROS (HBR) 9816072(2016).
- Schmidt, A., Bekeschus, S., von Woedtke, T., Hasse, S. Cell migration and adhesion of a human melanoma cell line is decreased by cold plasma treatment. Clinical Plasma Medicine. 3 (1), 24-31 (2015).
- Kalghatgi, S., Friedman, G., Fridman, A., Clyne, A. M. Endothelial cell proliferation is enhanced by low dose non-thermal plasma through fibroblast growth factor-2 release. Ann Biomed Eng. 38 (3), 748-757 (2010).
- Schmidt, A., Bekeschus, S., Wende, K., Vollmar, B., von Woedtke, T. A cold plasma jet accelerates wound healing in a murine model of full-thickness skin wounds. Exp Dermatol. 26 (2), 156-162 (2017).
- Wende, K., et al. Proteomic Tools to Characterize Non-Thermal Plasma Effects in Eukaryotic Cells. Plasma Medicine. 3 (1-2), 81-95 (2013).
- Schmidt, A., et al. Redox-regulation of activator protein 1 family members in blood cancer cell lines exposed to cold physical plasma-treated medium. Plasma Processes and Polymers. 13 (12), 1179-1188 (2016).
- Landsberg, K., et al. Use of Proteomics to Investigate Plasma-Cell Interactions. Plasma Medicine. 1 (1), 55-63 (2011).
- Xu, D., et al. Intracellular ROS mediates gas plasma-facilitated cellular transfection in 2D and 3D cultures. Sci Rep. 6, 27872(2016).
- Ishaq, M., et al. Atmospheric gas plasma-induced ROS production activates TNF-ASK1 pathway for the induction of melanoma cancer cell apoptosis. Mol Biol Cell. 25 (9), 1523-1531 (2014).
- Winter, J., et al. Tracking plasma generated H2O2 from gas into liquid phase and revealing its dominant impact on human skin cells. Journal of Physics D-Applied Physics. 47 (28), 285401(2014).
- Dunnbier, M., et al. Ambient air particle transport into the effluent of a cold atmospheric-pressure argon plasma jet investigated by molecular beam mass spectrometry. Journal of Physics D-Applied Physics. 46 (43), 435203(2013).
- Schmidt-Bleker, A., Bansemer, R., Reuter, S., Weltmann, K. -D. How to produce an NOx- instead of Ox-based chemistry with a cold atmospheric plasma jet. Plasma Processes and Polymers. 13 (11), 1120-1127 (2016).
- Weltmann, K. D., et al. Atmospheric Pressure Plasma Jet for Medical Therapy: Plasma Parameters and Risk Estimation. Contributions to Plasma Physics. 49 (9), 631-640 (2009).
- Bekeschus, S., et al. Hydrogen peroxide: A central player in physical plasma-induced oxidative stress in human blood cells. Free Radic Res. 48 (5), 542-549 (2014).
- Girard, P. M., et al. Synergistic Effect of H2O2 and NO2 in Cell Death Induced by Cold Atmospheric He Plasma. Sci Rep. 6, 29098(2016).
- Bekeschus, S., et al. Neutrophil extracellular trap formation is elicited in response to cold physical plasma. J Leukoc Biol. 100 (4), 791-799 (2016).
- Girard, F., et al. Formation of reactive nitrogen species including peroxynitrite in physiological buffer exposed to cold atmospheric plasma. Rsc Advances. 6 (82), 78457-78467 (2016).
- Bekeschus, S., von Woedtke, T., Kramer, A., Weltmann, K. -D., Masur, K. Cold Physical Plasma Treatment Alters Redox Balance in Human Immune Cells. Plasma Medicine. 3 (4), 267-278 (2013).
- Wende, K., et al. Identification of the biologically active liquid chemistry induced by a nonthermal atmospheric pressure plasma jet. Biointerphases. 10 (2), 029518(2015).
- Bekeschus, S., et al. Redox Stimulation of Human THP-1 Monocytes in Response to Cold Physical Plasma. Oxid Med Cell Longev. 2016, 5910695(2016).
- Obeid, M., et al. Calreticulin exposure dictates the immunogenicity of cancer cell death. Nat Med. 13 (1), 54-61 (2007).
Reprints and Permissions
