Chromatin looping plays a significant role in gene regulation; however, there have been no technological advances that allow for selective and reversible modification of chromatin loops. Here we describe a powerful system for chromatin loop re-organization using CRISPR-dCas9 (CLOuD9), demonstrated to selectively and reversibly modulate gene expression at targeted loci.
Method Article
CRISPR-Mediated Reorganization of Chromatin Loop Structure
* These authors contributed equally
In This Article
Summary
Abstract
Recent studies have clearly shown that long-range, three-dimensional chromatin looping interactions play a significant role in the regulation of gene expression, but whether looping is responsible for or a result of alterations in gene expression is still unknown. Until recently, how chromatin looping affects the regulation of gene activity and cellular function has been relatively ambiguous, and limitations in existing methods to manipulate these structures prevented in-depth exploration of these interactions. To resolve this uncertainty, we engineered a method for selective and reversible chromatin loop re-organization using CRISPR-dCas9 (CLOuD9). The dynamism of the CLOuD9 system has been demonstrated by successful localization of CLOuD9 constructs to target genomic loci to modulate local chromatin conformation. Importantly, the ability to reverse the induced contact and restore the endogenous chromatin conformation has also been confirmed. Modulation of gene expression with this method establishes the capacity to regulate cellular gene expression and underscores the great potential for applications of this technology in creating stable de novo chromatin loops that markedly affect gene expression in the contexts of cancer and development.
Introduction
The relationship between chromatin folding in the nucleus and the specific organization of the genome has garnered significant interest in recent years, as it has been shown to be closely associated with gene expression1,2. While the precise relationship between gene activity and modulation of chromatin structure remains unclear, it has been hypothesized that the interactions between chromosomal contacts as a result of dynamic three-dimensional chromatin organization serve a gene regulatory function3. Indeed, such an effect has been well demonstrated at the human globin gene locus, where the locus control region (LCR) regulates the activity of the globin genes in a developmentally specific manner by creating a chromatin loop between the two regions4. However, in both this and other regions, it is unclear whether chromatin looping is a cause or consequence of alterations in gene expression.
Until now, the challenges in studying this phenomenon remained unresolved. For example, other attempts at inducing chromatin loops involved modifying the linear DNA sequence or complicated procedures requiring an abundance of background knowledge on specific elements that facilitate looping5,6,7,8. Additionally, while previous work has suggested that chromatin loops drive gene expression in a specific and restricted context7,8, the level at which chromatin looping affects transcription globally is uncertain. Though interest in the impact of long-range looping on gene expression has grown continually in recent years, unanswered questions about establishing and retaining chromatin contacts to change gene activity persist.
The technology that we have engineered employs the nuclease deficient clustered regularly interspaced short palindromic repeats (CRISPR)-CRISPR-associated protein 9 (dCas9), to allow for the broadly applicable targeting of any genomic loci9. This technology eliminates the complex issues related to modifications of the linear DNA sequence and is accessible without significant prior knowledge of particular looping components. Most notably, the tool is universal and broadly applicable to chromatin loops recognized in development as well as in a variety of diseases, such as cancer. The power of CLOuD9 is demonstrated by reversibly altering the structure of loops to effectively modulate gene expression.
Protocol
1. gRNA Design
- Select a standard gRNA design tool to design the guide RNAs10. Use complementary pairs of the previously developed CLOuD9 constructs9 (i.e., at least 1 S. aureus (CSA) and 1 S. pyogenes (CSP) construct) for each experiment.
- Within the selected online design tool, use the Protospacer Adjacent Motif (PAM) sequence "NGG" with a guide length of 20 bp for CSP and the PAM sequence "NNGRRT" with a guide length of 21 for CSA.
- Choose guides based on specificity score and design guides on both strands to maximize chances of obtaining a working guide.
- Order 2 oligonucleotides per guide from an oligo manufacturer: for the forward oligo, add "caccg" to the 5' end of the guide sequence, and for the reverse oligo, add "aaac" to the 5' end and "c" to the 3' end before ordering.
- Initially, design 3-5 gRNAs for each region of interest, spread over a 250-1000 bp region. Assess the gRNA targeting efficiency as follows:
- Clone identified gRNAs into an active Cas9 plasmid (see step 3) and transiently transfect into 293T cells (see step 4)11.
- Grow cells for 2-3 d in Dulbecco's Modified Eagle Medium (DMEM) with 10% fetal bovine serum (FBS) and 1% penicillin-streptomycin (pen strep), then harvest and extract genomic DNA12.
- Amplify targeted regions by polymerase chain reaction (PCR). Run products on a 1.5% agarose gel and purify appropriate bands.
- Perform a T7 endonuclease assay as described in the Guschin, et al. protocol13,14.
NOTE: Efficient guides are those determined to cut DNA at the target site.
2. Cell Culture
- Maintain cells in a healthy and actively dividing state.
- For K562s, culture in Roswell Park Memorial Institute (RPMI) 1640 media with 10% FBS and 1% pen strep.
- Grow K562s in a 25 cm2 canted neck flask for maintenance and adjust the cell density to 400,000 cells per mL each day.
- After K562s have been transduced with CLOuD9 constructs, add 2 µg/mL puromycin and 100 µg/mL hygromycin to maintenance media.
- For 293Ts, culture in Dulbecco's Modified Eagle Medium (DMEM) with 10% FBS and 1% pen strep.
- Grow 293Ts in 10 cm2 plates and split when confluent.
- For K562s, culture in Roswell Park Memorial Institute (RPMI) 1640 media with 10% FBS and 1% pen strep.
3. Plasmid Preparation and gRNA Insertion15
Note: Plasmid maps are available in the appendix and primers utilized in the example experiments are available in Supplementary Table 1.
- Mix 5 µg of the lentiviral CRISPR plasmid with 3 µL of BsmBI, 3 µL of Alkaline Phosphatase, 6 µL of 10x Buffer, and 0.6 µL of freshly prepared 100 mM DTT. Bring the total volume to 60 µL with ddH2O and incubate at 37 °C for 30 min to digest and dephosphorylate the plasmid.
- Gel purify the digested plasmid and elute in ddH2O.
- Mix 1 µL of each of the paired guides at 100 µM with 1 µL of 10x T4 Ligation Buffer, 6.5 µL of ddH2O, and 0.5 µL T4 PNK, to reach 10 µL total volume. Incubate at 37 °C for 30 min, then 95 °C for 5 min, then ramp down to 25 °C at 5 °C/min.
Note: This will anneal the pair of guides. - Dilute the annealed guides (from step 3.3) 1:200 in ddH2O.
- Mix 1 µL of the digested plasmid from step 3.2 with 0.5 µL of the diluted ligated guides from step 3.4, 2.5 µL of 2x Buffer, 1 µl of ddH2O, and 0.5 µL of Ligase, to make a 5.5 µL total reaction. Incubate this at room temperature for 10 min to ligate the guides to the BsmBI digested plasmid.
- Transform the newly ligated plasmid from step 3.5 into Stbl3 bacteria and amplify using any plasmid preparation method.
4. Lentivirus Production
- Count 750,000 293T cells per well for a six-well plate using a hemocytometer and seed them in DMEM with 10% FBS and 1% pen strep. Use one well for each construct.
- 24 h after seeding, change media to fresh antibiotic-free DMEM with 10% FBS.
- In one tube, dilute 11 µL of lipid-based transfection reagent with 150 µL of the OptiMEM medium, per reaction11.
- In a separate tube, dilute 2 µg of the CLOuD9 lentiviral vector plasmid from step 3.6, 0.35 µg of pMDLg/pRRE, 1 µg of pRSV-Rev, and 0.65 µg of pMD2.G with 150 µL of the OptiMEM medium, per reaction11.
- For each reaction, add the diluted lentiviral plasmid mixtures to the diluted lipid-based transfection reagent at a 1:1 ratio, and incubate for 5 min11.
- Add the entire volume of each mixed complex from step 4.5 into the respective wells of the antibiotic-free 293T cells from step 4.2.
- 48 h later, collect viral production media by pipetting into a fresh tube and spin down at 300 x g for 5 min. After centrifugation, move the supernatant to a fresh tube to remove residual cell debris.
- Use viral production media immediately for the transduction of target cells or freeze at -80 °C for future use.
5. Lentivirus Transduction of Cells
- Add 250 µL of each viral construct of interest (comprised of complementary CLOuD9 plasmids) to a 15 mL conical tube containing 80,000 cells for the CLOuD9 application.
- Bring the total volume of media in each conical to 1 mL with antibiotic-free media, and add polybrene to a final concentration of between 1-8 µg/mL (the maximum concentration of polybrene tolerated by the cell type utilized will need to be determined experimentally).
- Spin cells at 800 x g for 30 min at room temperature, then resuspend by pipetting without removing the viral supernatant. Move the entire cell suspension to a cell culture plate.
- 24 h post-transduction, spin cells down at 300 x g for 5 min at room temperature.
- Aspirate viral supernatant and resuspend cells in regular cell culture media.
- On the next day, add puromycin (1 µg/mL for 293T cells) and hygromycin (25 µg/mL for 293T cells) to the cell culture medium to select for doubly transduced cells. Experimentally determine the appropriate concentrations of puromycin and hygromycin for a given cell type prior to beginning the experiments.
- Keep cells in selection media for at least 3 d before any downstream experiments and maintain in selection media for the duration of all experiments.
6. Cell Dimerization and Wash Out
- Add 1 mM Abscisic Acid (ABA) or an equivalent volume of dimethyl sulfoxide (DMSO) for controls to cell culture to dimerize the CLOuD9 selected and transduced cells. Use ABA within 6 months of date of receipt, keep cold, and protect it from light throughout use. 2 mM ABA can be utilized if needed.
- Change media daily to provide fresh ABA (or DMSO for controls) for the duration of the experiments.
NOTE: No limit on the length of dimerization has yet been observed.
- Change media daily to provide fresh ABA (or DMSO for controls) for the duration of the experiments.
- Reverse dimerization through the removal of media containing ABA and washing cells with enough phosphate buffered saline (PBS) to cover the surface of the plate, twice. Thereafter, culture cells in ABA-free media to maintain an un-dimerized state.
7. Immunoprecipitation and Co-immunoprecipitations
NOTE: Make all buffers fresh and immediately prior to use.
- Following completion of dimerization experiments, collect and spin down cells, then aspirate supernatant.
- Crosslink and freeze down cells
- Make a fresh stock of 1% formaldehyde in PBS at room temperature using fresh materials. For every 2 million cells, gently resuspend with 1 mL of 1% formaldehyde at room temperature for exactly 10 min, while rotating.
NOTE: Use a minimum volume of 10 mL for crosslinking less than 10 million cells. - Quench crosslinking with the addition of glycine to a final concentration of 0.125 M, followed by incubation for 5 min at room temperature, while rotating.
- Spin down cells and wash 1-2x with ice-cold PBS. Cell pellets can then be snap frozen in liquid nitrogen and stored at -80 °C or used immediately.
NOTE: Heat will reverse formaldehyde crosslinks. If rushed, cells can be stored directly in -80 °C without the snap freeze.
- Make a fresh stock of 1% formaldehyde in PBS at room temperature using fresh materials. For every 2 million cells, gently resuspend with 1 mL of 1% formaldehyde at room temperature for exactly 10 min, while rotating.
- Prepare antibody/bead conjugate
Note: Optimizing conditions for chosen antibody (i.e, testing different lysis buffers for cell lysis and performing IP) may be worthwhile. Two common buffers, Farnham lysis buffer and Modified RIPA buffer, can have a significant effect on the IP efficiency and sonication efficiency. All buffer compositions can be found in the Table of Materials. Additionally, keep in mind that chromatin sonication may take several hours to complete.- Resuspend beads by vortexing briefly as appropriate for the chosen antibody.
- Transfer an appropriate amount of beads for the experiment to a 1.5 mL tube. As a starting point, use 20 µL of beads for every 1 µg of antibody. Do not add antibody yet.
NOTE: Use 10 µg antibody with 200 µL of beads for 1 mg of total lysate as a starting point, unless it is known that the antibody is more or less efficient than this would imply. For low abundance proteins, this ratio may need to be adjusted. - If using Farnham lysis buffer, wash 3x in IP dilution buffer. If using RIPA lysis buffer, wash 3x in RIPA lysis buffer.
- Resuspend beads in a final volume of the same buffer from step 7.3.3 (either IP dilution or RIPA buffer) that is >1x and <5x the initial volume. i.e. For 100 µL initial bead volume, use between 100 and 500 µL final resuspension volume.
- Add antibody to washed beads now at an appropriate concentration. For a good HA or Flag antibody to IP CLOuD9 constructs, use antibodies at 1:50 (µg protein: µg protein lysate) and incubate between 8+ h and overnight at 4 °C, while rotating. Alternatively, incubate for 2-4 h at room temperature.
- Remove the supernatant from beads and discard.
- Wash beads 3x with the Wash buffer.
- Resuspend in a minimal volume of the buffer utilized for overnight incubation with the antibody (IP dilution or RIPA buffer). Keep cold until combined with protein lysate.
- Sonicate Chromatin
- First lyse cells with the addition of Swelling buffer to cell pellets on ice for 10 min, flicking cells every few min to prevent settling.
NOTE: Generally, 500 µL of Swelling buffer is added to 25 million cells and scaled from there, but do not use less than 500 µL buffer for <25 million cells. - Dounce manually both clockwise and counterclockwise, 13x each.
- Then spin nuclei down at 4 °C for 5 min at 1,500 x g. Aspirate the supernatant completely and repeat to remove remaining supernatant, then weigh the cell pellet in mg.
- Add protease inhibitor to nuclei lysis buffer (Farnham buffer or RIPA buffer, above, choose one).
- Add 10x amount of nuclei lysis buffer to pelleted nuclei to resuspend (for example, add 1 mL of nuclei lysis buffer to a 0.100 g pellet). Briefly vortex and lyse for 10 min on ice.
NOTE: Keep in mind the size of the sonication tube. Ideal volume is often <1 mL, so samples may need to be divided if pellets are very large.- For Co-IP, sonicate nuclei briefly to solubilize material and quench SDS to a level that permits immunoprecipitation with 2-3 volumes of dilution buffer, then proceed to step 7.4.6. For very sensitive antibodies, add more dilution buffer to further reduce the concentration of SDS.
NOTE: Stop sonication when lysate clears; it will change from an opaque/translucent white to completely transparent. Keep samples as cold as possible and do not over sonicate. - For ChIP, thoroughly sonicate DNA to obtain 150-1000 bp DNA fragments, then proceed to step 7.4.6.
- For Co-IP, sonicate nuclei briefly to solubilize material and quench SDS to a level that permits immunoprecipitation with 2-3 volumes of dilution buffer, then proceed to step 7.4.6. For very sensitive antibodies, add more dilution buffer to further reduce the concentration of SDS.
- Spin out insoluble material at maximum speed for 10 min at 4 °C.
- Transfer soluble material to a fresh tube.
- For Co-IP, measure the concentration of protein and proceed to the pulldown in step 7.5.
- For ChIP, remove a 10 µL aliquot of cleared lysate and add 40 µL IP elution buffer and 6 µL 5 M NaCl to that for a total of 56ul. Boil for 15 min at 95 °C, add 5-10 µL of 3 M NaOAc pH 5, and clean up on a PCR purification column. Measure the concentration of DNA by measuring the absorbance at 260 nm and standardize across samples. Then proceed to pulldown in step 7.5.
NOTE: Extra lysate can be snap frozen at -80 °C and used at a later time, but best results are obtained from the fresh lysate. If freezing, do not freeze/thaw lysate more than once.
- First lyse cells with the addition of Swelling buffer to cell pellets on ice for 10 min, flicking cells every few min to prevent settling.
- Pulldown
- Transfer an appropriate amount of protein lysate to a fresh tube. If using Farnham lysis buffer, dilute in 2.1 volumes of IP dilution buffer (above).
- Set aside 100 µL of supernatant for input control, and store at 4 °C until the next day.
- Add bead/antibody conjugate from step 7.3.8 to samples now.
- Rotate samples at 4 °C overnight and ensure there is enough volume for liquid movement in 1.5 mL tubes.
- Wash and Elute
- After overnight rotation, save the supernatant as the nonbinding fraction. Then wash beads 3-5x in IP dilution buffer.
- Prepare IP elution buffer at room temperature, without inhibitors.
- Elute complexes with 50 µL elution buffer shaken on a vortex at 67 °C for 15 min. Transfer elution to a new tube and repeat with another 50 µL. Combine them both for a total 100 µL elution.
NOTE: If there is too much background from this elution procedure, heat can be reduced or eliminated during shaking/incubation. This generally reduces the yield of target protein but does significantly decrease the background.
- Reverse crosslinks by heating at 67 °C for >4 h.
NOTE: This is not strictly necessary for Co-IPs but can be helpful.- For Co-IP, to ensure full dimerization between the targets of interest, run eluates on an SDS-page gel and probe with antibodies against the HA tag or Flag tag, as indicated, all at 1: 1,000. Then continue to step 8.
- For ChIP-qPCR, to ensure correct localization and targeting of each CRISPR-dCas9 component, clean elution product on a column and elute in 10 µL. Perform real-time quantitative polymerase chain reaction (qPCR) of purified DNA. Primers utilized in the presented data are available in Supplementary Table 1. Then continue to step 8.
8. RNA Extraction and Quantitative PCR
- To investigate the CLOuD9-induced changes in gene expression, first, isolate and purify total RNA from both control cell pellets and dimerized cell pellets.
- Make complementary DNA (cDNA) from the purified RNA by reverse transcription17 and perform qPCR analyses. Primers are available in Supplementary Table 1.
9. Chromosome Conformation Capture Assay
- To observe changes in the frequency of genomic loci contacts induced by CLOuD9, perform chromosome conformation capture (3C) assays8.
- Quantify 3C ligation products in two sets of duplicates for each of three biological replicates by quantitative real-time PCR. Normalize samples to the 3C signals from the tubulin locus. Primers are available in Supplementary Table 1.
Results
CLOuD9 induces reversible β-globin promoter-LCR looping. Appropriate use of the CLOuD9 system induces reversible contact of the complementary CSA and CSP CLOuD9 constructs through addition or removal of ABA to cell culture media (Figure 1a). CSA and CSP constructs (Figure 1b) are localized to appropriate genomic regions using standard CRISPR gRNAs. Considering the vast documentation of the human globin locus as well as the frequent chromosomal folding and rearrangement that occurs there during development, this region was chosen to demonstrate the utility of the CLOuD9 system. Additionally, the K562 cell line was selected because it has been shown to consistently express high levels of the fetal γ-globin gene, as opposed to the β-globin gene that is typically expressed in healthy adult erythroid lineage cells. By using the K562 cells, the ability of CLOuD9 to modify gene expression can be examined by attempting to restore expression of the β-globin gene in this cell line.
Prior to induction of dimerization, chromatin immunoprecipitation-quantitative PCR (ChIP-qPCR) was utilized to ensure accurate localization and targeting of each CLOuD9 component (Supplementary Figure 1). Additionally, co-immunoprecipitation (Co-IP) with and without ABA verified CSA and CSP dimerization in the presence of the ligand as well as reversibility in the absence of the ligand (Figure 1c and Supplementary Figure 2). 24 h after adding ABA, greater contact between β-globin and the LCR appeared as measured by chromosome conformation capture (3C) in the cells with both dimerization parts, but not the controls containing only two CSA or CSP constructs, thus validating the specificity of the chromatin change for the targeted sites (Figure 1c and Supplementary Figures 3,4). Creating the LCR-β-globin interaction did not completely eliminate the endogenous LCR-globin contact, but instead, added to the original contact, as previously reported8. Increases in β-globin/LCR contacts were observed for up to 72 h of dimerization, regardless of the exact region within the targeted LCR and β-globin promoter region (Supplementary Figures 5,6). Lastly, the reversibility of the system was confirmed with 3C after removing ABA, which showed a complete renewal of the endogenous conformation (Figure 1d and Supplementary Figures 3-6).
We considered that the success shown in the K562 cells may be a result of the globin locus location in a region of euchromatin (Figure 1d), so a second cell line was utilized to explore this idea. The CLOuD9 system was applied to HEK 293T cells in regions that are heterochromatic and do not express globin genes (Figure 1e). The result was similar to what was observed in K562s; more β-globin LCR associations were measured by 3C after 24 h with ABA (Figure 1e and Supplementary Figure 3), providing evidence for CLOuD9's robust ability to function in different cellular environments, despite the original chromatin state or conformation.
Additional loci were tested to ensure the broad applicability of CLOuD9, including the Oct4 promoter and a distal 5' enhancer within 293T cells. Previously, there has been no detectable Oct4 expression in this cell line and further, no endogenous contacts described. Evidence of Oct4 expression in embryonic stem cells resulting from contact with the distal 5' enhancer motivated this experiment, and the same outcome was observed at the β-globin locus18. Contact between the Oct4 distal enhancer and promoter was identified in the CLOuD9 enabled cells, but not the control cells (Figure 1f). Additionally, it was observed that the Oct4 promoter and distal 5' enhancer interaction also prompted a 3' enhancer to contact the Oct4 promoter. This event is consistent with evidence that the 3' enhancer interacts with the Oct4 promoter/5' distal enhancer complex during endogenous gene activation10.
CLOuD9 induces context specific alterations at gene loci. After confirming that the CLOuD9 system does indeed induce chromosomal contacts at gene loci, we sought to examine the loops' effect on gene expression. It has been documented that transcription for the globin and Oct4 genes are contingent on the contacts between the LCR and globin gene loci and between the distal 5' enhancer and Oct4 promoter, respectively1,11. Thus, we hypothesized that using the CLOuD9 system to drive chromatin loop formation in each of these regions would result in compelling gene expression.
In both loci, RT-qPCR demonstrated that ABA induced chromatin loops drove increases in Oct4 expression in 293T cells, and in β-globin expression in K562 cells, though not in 293Ts (Figure 2a). Though the addition of ABA to cell culture for as little as 24 h increased β-globin expression significantly, expression continued to increase steadily up to 72 hours and was reversible upon ABA washout (Figure 2a). All of the K562 cells except for the controls followed this trend, no matter where the dimerization components were located in the LCR and β-globin promoter regions (Figure 2a and Supplementary Figures 7,8). In support of these findings, ChIP-qPCR of H3K4me3 and RNA Pol-II at the β-globin locus in K562s and 293Ts corresponded with observed alterations in transcription (Figure 2c-f).
CLOuD9 establishes stable chromatin loops. Though short-term loop induction with CLOuD9 clearly followed expectations, whether long-term induction of looping had differential effects remained to be observed. To investigate this, cells were cultured in the presence of ABA for 10 days. While both K562s and 293Ts exhibited increased contact frequency between the β-globin locus and the LCR relative to controls (Figure 3a, b and Supplementary Figures 9,10), alterations in β-globin expression were still only observed in K562 cells (Figure 3c). Interestingly, however, it was observed that long-term dimerization in K562s, where transcription was strongly upregulated, was no longer reversible (Figure 3a and Supplementary Figures 9-11). However, in 293Ts, where no alteration in transcription was observed following long-term dimerization, induced alterations in chromatin contacts remained reversible (Figure 3b and Supplementary Figure 9).
Overall, only a small decrease in gene expression was observed after 10 days of ABA removal, which remained significantly higher than gene expression levels prior to dimerization (Figure 3c). In keeping with this, K562 cells, but not 293T cells, showed sustained alterations in H3K4me3 and RNA Pol-II at the β-globin locus by ChIP-qPCR, compared to controls, even after 10 days of ABA removal (Figure 3d-f). Thus, our results indicate that the stability of the chromatin loop implies more sustainable gene expression.

Figure 1: CLOuD9 induces reversible β-globin promoter-LCR looping. (a) Addition of abscisic acid (ABA, green) brings two complementary CLOuD9 constructs (CLOuD9 S. pyogenes (CSP), CLOuD9 S. aureus (CSA), red and blue, respectively) into proximity, remodeling chromatin structure. Removal of ABA restores the endogenous chromatin conformation. (b) CLOuD9 constructs combine CRISPR-dCas9 technology from S. aureus and S. pyogenes with reversibly dimerizeable PYL1 and ABI1 domains. (c) Timeline of CLOuD9 dimerization experiments. (d) 3C assay measuring β-globin locus-wide crosslinking frequencies in K562 cells after 24 h of treatment with ABA (red) and subsequent washout (blue) showing reversibility of induced β-globin/LCR contacts (highlighted in grey). Orange arrowheads indicate specific CLOuD9 construct target regions. The EcoRI fragment containing hypersensitivity sites 1-4 of the LCR (black bar) was used as the anchor region. Its crosslinking frequency with other indicated EcoRI fragments (names on the top of the graph) were assessed. The human β-globin genes and LCR hypersensitivity sites are depicted on the bottom of the graph with chromosomal position coordinates. Data from ChIP-seq of H3K4me3 and H3K9me3 demonstrate that this region is euchromatic in K562s. (e) Similar reversible changes in chromatin structure are seen in HEK 293T cells, despite evidence from H3K4me3 and H3K9me3 ChIP-seq data that the globin region is heterochromatic in this cell type. (f) 3C assay measuring Oct4 locus-wide crosslinking frequencies in 293T cells after 72 h of treatment with ABA (red) showing induced Oct4/distal enhancer contacts (highlighted in grey). Orange arrowheads indicate specific CLOuD9 construct target regions. The MboI fragment containing the Oct4 promoter (black bar) was used as the anchor region. Its crosslinking frequency with other indicated MboI fragments (names on the top of the graph) were assessed. The human Oct4 regions are depicted on the bottom of the graph with chromosomal position coordinates. All of the 3C results were obtained from at least three independent experiments. 3C values were normalized to tubulin. For β-globin, interaction frequencies between the anchor fragment and the fragment encompassing the β/HS fragment were set to zero. For Oct4, interaction frequencies between the anchor fragment and a negative control fragment outside of the Oct4 interacting region were set to zero. Error bars indicate s.d. n=3. This figure has been modified from Figure 1 in Morgan, Stefanie L., et al.9. Please click here to view a larger version of this figure.
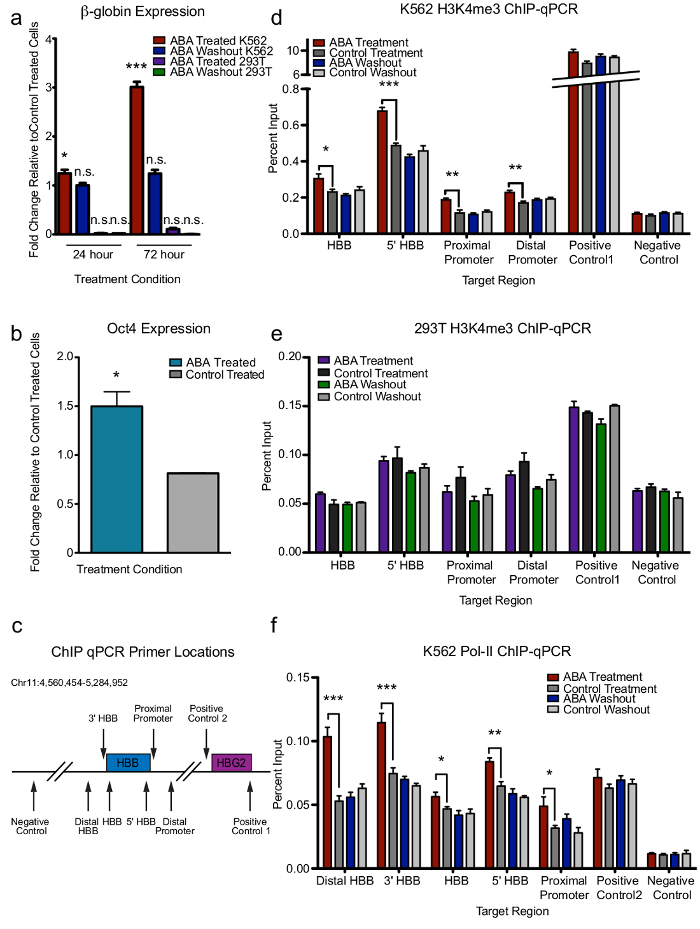
Figure 2: CLOuD9 induces context specific alterations in gene expression and chromatin state. (a) CLOuD9-induced chromatin looping at the β-globin locus results in the reversible induction of β-globin expression in K562s but not in 293Ts. Significance given relative to control treated cells. Two-tailed student's t-tests *P<0.05, t = 3.418, df = 5; ***P<0.0001, t = 10.42 df = 5; n.s. non-significant. Error bars indicate s.d. n = 3. (b) Induction of Oct4 expression was observed in 293Ts following CLOuD9-induced looping at the same locus. Significance is given relative to control treated cells. Two-tailed student's t-tests *P<0.05, t = 4.562, df = 2. Error bars indicate s.d. (c) Schematic of ChIP-qPCR primer locations along the β-globin gene body. (d,e) ChIP- qPCR demonstrates reversible alterations in H3K4me3 at the β-globin locus in K562s but not in 293Ts following CLOuD9-induced looping. Two-tailed student's t-tests *P<0.05, **P<0.001, ***P<0.0001. Error bars indicate s.d. (f) CLOuD9 mediated alterations in β-globin transcription in K562s correspond with increases in RNA Pol-II occupancy across the entirety of the β-globin gene body. Two-tailed student's t-tests *P<0.05, **P<0.001, ***P<0.0001. Error bars indicate s.d. This figure has been modified from Figure 2 in Morgan, Stefanie L., et al.9. Please click here to view a larger version of this figure.
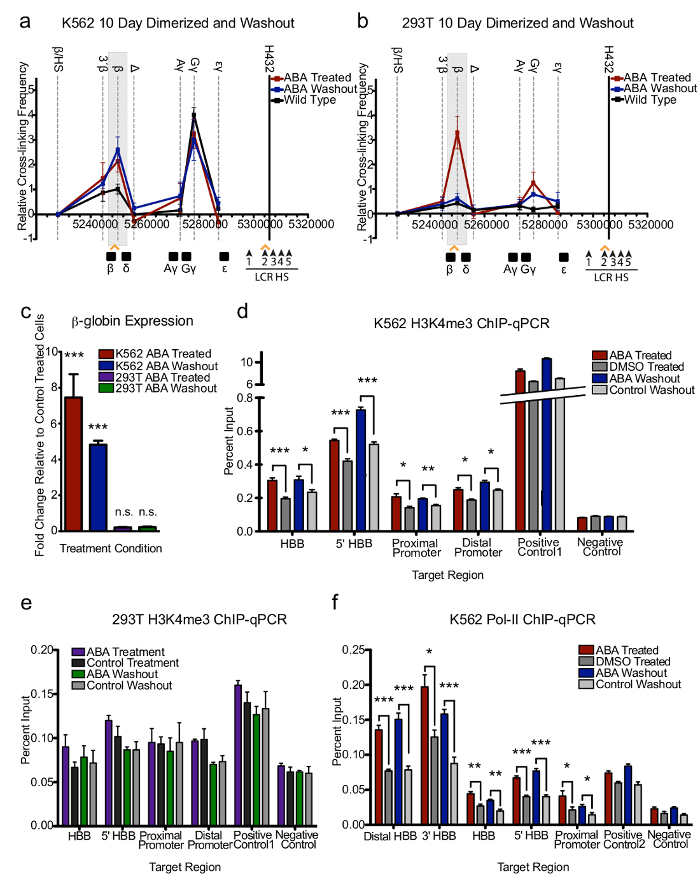
Figure 3: CLOuD9 establishes stable chromatin loops that sustain robust gene expression following long-term dimerization. (a,b) 3C assay demonstrates that in K562s but not 293Ts, CLOuD9-induced chromatin looping becomes irreversible after 10 days of ABA treatment, even when ABA is removed for up to 10 additional days. All 3C results were obtained from at least three independent experiments. 3C values were normalized to tubulin, and interaction frequencies between the anchor fragment and the fragment encompassing the β/HS fragment were set to zero. Error bars indicate s.d. n = 3. (c) Loop stabilization in K562s results in persistent expression of β-globin, even following 10 days of ABA washout. No changes in β-globin expression are observed in 293Ts. Significance given relative to control treated cells. Two-tailed student's t-tests ***P<0.0001, t = 5.963, df = 5; n.s. non-significant (d) ChIP-qPCR showing increases in H3K4me3 marks over the β-globin locus in response to CLOuD9-induced looping are sustained following 10 days of ligand washout in K562s. Two-tailed student's t-tests *P<0.05, **P<0.001, ***P<0.0001. (e) No significant alterations in H3K4me3 signals following long-term dimerization were observed by ChIP-qPCR in 293Ts. (f) Increased RNA Pol-II occupancy of the β-globin locus following long-term loop induction was maintained in K562s following 10 days of ligand washout. Two-tailed student's t-tests *P<0.05, **P<0.001, ***P<0.0001. All error bars indicate s.d. This figure has been modified from Figure 3 in Morgan, Stefanie L., et al.9. Please click here to view a larger version of this figure.
Supplementary Figure 1: CLOuD9 constructs localize to their intended target regions. Chromatin immunoprecipitation and quantitative PCR of CLOuD9 constructs demonstrate correct localization to their intended genomic loci. This figure has been modified from Supplementary Figure 1 in Morgan, Stefanie L., et al.9. Please click here to download this figure.
Supplementary Figure 2: CLOuD9 constructs reversibly associate in response to ABA treatment. Co-immunoprecipitations demonstrating the association of the dCas9 proteins following 72 h of ABA treatment is reversed following subsequent 72 h of ligand washout. This figure has been modified from Supplementary Figure 2 in Morgan, Stefanie L., et al.9. Please click here to download this figure.
Supplementary Figure 3: Control treatment induces no changes in chromatin contacts. Treatment with DMSO, a control agent, for 24 hours induces no changes in the endogenous chromatin conformation by 3C in either K562 cells or HEK 293Ts. 3C values were normalized to tubulin, and interaction frequencies between the anchor fragment and the fragment encompassing the β/HS fragment were set to zero. Error bars indicate SD. n = 3. This figure has been modified from Supplementary Figure 3 in Morgan, Stefanie L., et al.9. Please click here to download this figure.
Supplementary Figure 4: Control CLOuD9 transduced cells show no alterations in chromatin looping. Directing two CLOuD9 constructs to either the LCR or the β-globin promoter induces no significant changes in chromatin structure by 3C following ABA treatment relative to control treatment. 3C values were normalized to tubulin, and interaction frequencies between the anchor fragment and the fragment encompassing the β/HS fragment were set to zero. Error bars indicate SD. n = 3. This figure has been modified from Supplementary Figure 4 in Morgan, Stefanie L., et al.9. Please click here to download this figure.
Supplementary Figure 5: CLOuD9 chromatin looping remains reversible after 72 hours of dimerization. 3C assay in K562s demonstrates reversibility of CLOuD9 induced β-globin/LCR contacts after 72 hours of ABA treatment. 3C values were normalized to tubulin, and interaction frequencies between the anchor fragment and the fragment encompassing the β/HS fragment were set to zero. Error bars indicate SD. n = 3. This figure has been modified from Supplementary Figure 5 in Morgan, Stefanie L., et al.9. Please click here to download this figure.
Supplementary Figure 6: CLOuD9 induced β-globin/LCR looping is not impacted by globin target site. Directing CSA and CSP constructs to alternate regions of the LCR or the β- globin promoter results in similar reversible changes in loop induction by 3C following 72 hours of ABA treatment. 3C values were normalized to tubulin, and interaction frequencies between the anchor fragment and the fragment encompassing the β/HS fragment were set to zero. Error bars indicate SD. n = 3. This figure has been modified from Supplementary Figure 6 in Morgan, Stefanie L., et al.9. Please click here to download this figure.
Supplementary Figure 7: CLOuD9 induced alterations in gene expression are sustained regardless of globin target site. Directing CSA and CSP constructs to alternate regions of the β- globin promoter and LCR has no impact on induction of gene expression following 72 h of dimerization. However, while some impact on the strength of gene expression following long-term (10 day) dimerization was observed, high levels of β-globin relative to control treated cells were sustained following subsequent ligand washout for 10 additional days. Significance is given relative to control treated cells. **p < 0.001, t = 10.25, df = 5; ***p < 0.0001, left to right t = 8.697, df = 6, t = 40.31, df = 7; n.s. non-significant. All error bars indicate SD. This figure has been modified from Supplementary Figure 7 in Morgan, Stefanie L., et al.9. Please click here to download this figure.
Supplementary Figure 8: Control CLOuD9 transduced cells show no alterations in β-globin expression. Directing two CLOuD9 constructs to either the LCR or the β-globin promoter induces no significant changes in β-globin expression following ABA treatment relative to control treatment. Significance is given relative to control treated cells. n.s. non-significant. This figure has been modified from Supplementary Figure 8 in Morgan, Stefanie L., et al.9. Please click here to download this figure.
Supplementary Figure 9: Long-term control treatment induces no changes in chromatin contacts. Treatment with DMSO, a control agent, for 10 days induces no change in endogenous chromatin conformation by 3C in either K562 cells or HEK 293Ts. 3C values were normalized to tubulin, and interaction frequencies between the anchor fragment and the fragment encompassing the β/HS fragment were set to zero. Error bars indicate SD. n = 3. This figure has been modified from Supplementary Figure 9 in Morgan, Stefanie L., et al.9. Please click here to download this figure.
Supplementary Figure 10: Long-term CLOuD9 induced β-globin/LCR looping is not impacted by globin target site. Directing CSA and CSP constructs to alternate regions of the LCR or the β-globin promoter results in similarly sustained loop induction as demonstrated by 3C following 10 days of ABA treatment and 10 days of subsequent ligand washout. 3C values were normalized to tubulin, and interaction frequencies between the anchor fragment and the fragment encompassing the β/HS fragment were set to zero. Error bars indicate SD. n = 3. This figure has been modified from Supplementary Figure 10 in Morgan, Stefanie L., et al.9. Please click here to download this figure.
Supplementary Figure 11: CLOuD9 constructs irreversibly associate in response to long-term ABA treatment. Co-immunoprecipitations demonstrating irreversible association of the CSA and CSP dCas9 proteins following 10 days of ABA treatment and 10 subsequent days of ligand washout. This figure has been modified from Supplementary Figure 11 in Morgan, Stefanie L., et al.9. Please click here to download this figure.
Supplementary Table 1: List of primer sequences for gRNAs, qRT-PCR, 3C, and ChIP qPCR. This table has been modified from Supplementary Table 1 in Morgan, Stefanie L., et al.9. Please click here to download this table
Discussion
The most critical steps in CLOuD9 chromatin looping are: 1) Designing or using the correct gRNAs, 2) changing media daily on CLOuD9-transduced cells, including ABA or DMSO, 3) maintaining freshness of ABA, and 4) performing accurate and careful assessments of chromatin conformation.
The limits of CLOuD9 primarily reside in the ability to design guides to the target region of choice. Guide RNAs perform the important task of localizing the dCas9 components to target DNA regions to be dimerized and the efficacy of the guides are based on their specific target site. Without the proper gRNA components, the CLOuD9 system will not be able to form reversibly induced loops. Thus, by designing multiple guides for each region of interest and spreading the guides over a region of 250-1000 bp, at least one successful guide will be ensured. Guide location is also integral to accurate results. It is important to avoid guides located in transcription factor binding sites or other critical regions to prevent background effects such as up or down regulation of transcription. Additionally, the precise location of the CLOuD9 construct can slightly impact transcription of the target gene. This emphasizes the importance of testing multiple pairs of guides for each target region, to identify the most robust pair for experimental purposes. Further, in each pair of target regions, the CSA construct should be targeted with gRNAs for S. aureus, and the CSP construct should be targeted with gRNAs for S. pyogenes for targeting specificity.
To ensure accurate results and correct dimerization, it is also important to maintain the freshness of the cellular environments following the transduction of the CLOuD9 constructs. Daily media change and the addition of fresh dimerizer (or control) ensures that the complementary constructs will remain in proximity and preserve the altered chromatin conformation. Furthermore, guaranteeing the ABA is fresh and has been stored appropriately according to the manufacturer's protocol (opened within 6 months, kept cold, protected from light) is essential to obtaining authentic results.
Notably, the ABA dimerizer for CLOuD9 was used with the ABI and PYL dimerization proteins, rather than the more commonly utilized FRB and FKBP system. The necessity of a rapalog for the FRB/FKBP system would have limited the applicability of CLOuD9, due to the toxicity to cancer cells. The alternative ABI/PYL system circumvented this limitation, effectively enabling CLOuD9 to be more broadly utilizable.
Collectively, we have developed CLOuD9, a unique and robust technology that can forcibly but reversibly create contacts between long-range target genomic loci. Through inducing chromatin loops, we also demonstrate that CLOuD9 can be utilized to modify gene expression in the appropriate cellular context. The adaptability of the technology allows for the unrestricted study of the interactions between any two genomic loci, without requiring prior knowledge of the looping regions or looping mechanisms. In addition, CLOuD9's unique demonstrated reversibility enables further examination of the looping mechanisms in disease and development. While the on-target effects of chromatin looping have been demonstrated clearly, there is yet to be data offering insight into the effects of off-target looping and the subsequent impact on the on-target loops.
Our data illustrates only a few applications of this tool but implies the major underlying idea that chromatin arrangement is indicative of gene expression. Our technology can be used to study and reveal the nuances of chromatin structure in gene regulation, thereby improving the overall comprehension of the role of chromatin folding in transcription of genes. A better understanding of the subtleties of transcriptional dynamics can lead the way in research and treatment of cancer, hereditary diseases, and congenital disorders, in which distinct chromatin assembly undoubtedly alters gene expression20,21,22,23. Subsequent work utilizing the CLOuD9 technology will illuminate further details about the arrangement and dynamics of chromatin domains and how they drive folding to sustain stable gene expression in both development and disease.
Disclosures
The authors have nothing to disclose.
Acknowledgements
We thank H. Chang, T. Oro, S. Tavazoie, R. Flynn, P. Batista, E. Calo, and the entire Wang laboratory for technical support and critical reading of the manuscript. S.L.M. has been supported in this work through the NSFGRF (DGE-114747), NDSEGF (FA9550-11-C-0028), and the National Cancer Institute (1F99CA222541-01). K.C.W. is supported by a Career Award for Medical Scientists from the Burroughs Wellcome Fund, and is a Donald E. and Delia B. Baxter Foundation Faculty Scholar.
Materials
| Name | Company | Catalog Number | Comments |
|---|---|---|---|
| RPMI 1640 media | Life Technologies | 11875-119 | For K562 cell culture |
| DMEM media | Life Technologies | 11995-065 | 1X, for 293T cell culture |
| lentiCRISPR v2 | Addgene plasmid | #52961 | For CLOuD9 plasmid development |
| pRSV-Rev | Addgene plasmid | #12253 | For lentivirus production |
| pMD2.G | Addgene plasmid | #12259 | For lentivirus production |
| pMDLg/pRRE | Addgene plasmid | #12251 | For lentivirus production |
| Lipofectamine 2000 | Thermo Fisher Scientific | 11668-019 | For lentivirus production |
| anti-HA antibody | Cell Signaling | 3724 | For immunoprecipitation |
| anti-Flag antibody | Sigma | F1804 | For immunoprecipitation |
| DNeasy Blood and Tissue Kit | Qiagen | 69504 | For DNA extraction |
| TRIzol | Life Technologies | 15596-018 | For RNA extraction |
| RNeasy Kit | Qiagen | 74106 | For RNA extraction |
| Superscript VILO | Life Technologies | 11754-050 | For cDNA |
| SYBR Green I MasterMix | Roche | 4707516001 | For qPCR analysis |
| Light Cycler 480II | Roche | For qPCR analysis | |
| anti-H3K4me3 antibody | AbCam | ab8580 | For ChIP-qPCR |
| anti-RNA Pol-II antibody | Active Motif | 61083 | For ChIP-qPCR |
| EDTA free protease inhibitor | Roche | 11873580001 | For protein extraction |
| 4-12% Tris Glycine gel | Biorad | Any size, For western blot | |
| anti-Rabbit HRP antibody | Santa Cruz | sc-2030 | For western blot |
| anti-mouse HRP antibody | Cell Signaling | 7076S | For western blot |
| K562 and H3K293 ChIP-Seq data | Encode | ENCSR000AKU | For ChIP-seq analysis |
| K562 and H3K293 ChIP-Seq data | Encode | ENCSR000APE | For ChIP-seq analysis |
| K562 and H3K293 ChIP-Seq data | Encode | ENCSR000FCJ | For ChIP-seq analysis |
| K562 and H3K293 ChIP-Seq data | GEO | GSM1479215 | For ChIP-seq analysis |
| Dynabeads Protein A for Immunoprecipitation | Thermo Fisher Scientific | 10001D | For immunoprecipitation |
| Dynabeads Protein G for Immunoprecipitation | Thermo Fisher Scientific | 10004D | For immunoprecipitation |
| RNA Clean & Concentrator-5 | Zymo Research | R1015 | For RNA purification |
| Pierce 16% Formaldehyde Methanol-free | Thermo Fisher Scientific | 28908 | For crosslinking |
| PX458 Plasmid | Addgene | 48138 | Suggested active Cas9 plasmid for gRNA cloning, but any active Cas9 plasmid will do |
| QIAquick PCR Purification Kit | Qiagen | 28104 | For PCR purification |
| FastDigest BsmBI | Thermo Fisher Scientific | FD0454 | For cloning guide RNAs |
| FastAP | Thermo Fisher Scientific | EF0651 | For cloning guide RNAs |
| 10X FastDigest Buffer | Thermo Fisher Scientific | B64 | For cloning guide RNAs |
| QIAquick Gel Extraction Kit | Qiagen | 28704 | For cloning guide RNAs |
| 10X T4 Ligation Buffer | NEB | B0202S | For cloning guide RNAs |
| T4 PNK | NEB | M0201S | For cloning guide RNAs |
| 2X Quick Ligase Buffer | NEB | B2200S | For cloning guide RNAs |
| Quick Ligase | NEB | M2200S | For cloning guide RNAs |
| Buffers | |||
| Farnham lysis buffer | 1% Tris-Cl pH 8.0, 1% SDS, 1% protease inhibitor water solution (non-EDTA), and 1 mM EDTA in water | ||
| Modified RIPA buffer | 1% NP40/Igepal, 0.5% sodium deoxycholate, 0.1% SDS, 1 mM EDTA, and 1% protease inhibitor water solution (non-EDTA) in PBS pH 7.8 or 7.4 | ||
| IP dilution buffer | 0.01% SDS, 1.1% Triton-X 100, 1.2 mM EDTA, 16.7 mM Tris-HCl pH 8.0, 167 mM NaCl, 0.1x protease inhibitor | ||
| Wash buffer | 100 mM Tris pH 9, 100 mM LiCl, 1% NP-40, and 1% sodium deoxycholate | ||
| Swelling buffer | 0.1 M Tris pH 7.5, 10 mM potassium acetate, 15 mM magnesium acetate, 1% NP-40 | ||
| Dilution buffer | 0.01% SDS, 1.1% Triton X-100, 1.2 mM EDTA, 16.7 mM Tris pH 8 and 167 mM NaCl | ||
| IP elution buffer | 1% SDS, 10% NaHCO3 |
References
- Krivega, I., Dean, A. Chromatin looping as a target for altering erythroid gene expression. Ann. N.Y. Acad. Sci. 1368, 31-39 (2016).
- Matharu, N., Ahituv, N. Minor loops in major folds: Enhancer-promoter looping, chromatin restructuring, and their association with transcriptional regulation and disease. PLoS Genet. 11, e1005640(2015).
- Dekker, J., Martí-Renom, M. A., Mirny, L. A. Exploring the three-dimensional organization of genomes: interpreting chromatin interaction data. Nat. Rev Genet. 14, 390-403 (2013).
- Kim, A., Dean, A. Chromatin loop formation in the b-globin locus and its role in globin gene transcription. Mol Cells. 34, 1-5 (2012).
- Petrascheck, M., et al. DNA looping induced by a transcriptional enhancer in vivo. Nucleic Acids Res. 33, 3743-3750 (2005).
- Ameres, S. L., et al. Inducible DNA-loop formation blocks transcriptional activation by an SV40 enhancer. EMBO J. 24, 358-367 (2005).
- Deng, W., et al. Controlling Long-Range Genomic Interactions at a Native Locus by Targeted Tethering of a Looping Factor. Cell. 149, 1233-1244 (2012).
- Deng, W., et al. Reactivation of developmentally silenced globin genes by forced chromatin looping. Cell. 158, 849-860 (2014).
- Morgan, S. L., et al. Manipulation of Nuclear Architecture through CRISPR-Mediated Chromosomal Looping. Nature Communications. 8, 13 July (2017).
- Haeussler, M., et al. Evaluation of off-target and on-target scoring algorithms and integration into the guide RNA selection tool CRISPOR. Genome Biol. 17 (1), 148(2016).
- Lipofectamine 2000 Reagent. , Invitrogen by Life Technologies. (2013).
- DNeasy Blood & Tissue Kit Handbook. , QIAGEN. (2006).
- Determining Genome Targeting Efficiency using T7 Endonuclase I (M0302). , New England BioLabs. (2016).
- Guschin, D. Y., et al. A rapid and general assay for monitoring endogenous gene modification. Methods Mol Biol. 649, 247-256 (2010).
- Shalem, O., Sanjana, N. E., et al. Genome-scale CRISPR-Cas9 knockout screening in human cells. Science. , 83-87 (2014).
- RNeasy Mini Handbook. , QIAGEN. (2012).
- SuperScript VILO cDNA Synthesis Product Information Sheet. , Thermo Fisher Scientific Inc. (2015).
- Theunissen, T. W., et al. Systematic identification of culture conditions for induction and maintenance of naive human pluripotency. Cell Stem Cell. 15, 471-487 (2014).
- Mokry, M., et al. Integrated genome-wide analysis of transcription factor occupancy, RNA polymerase II binding and steady state RNA levels identify differentially regulated functional gene classes. Nucleic Acids Res. 40, 148-158 (2012).
- Drier, Y., et al. An oncogenic MYB feedback loop drives alternate cell fates in adenoid cystic carcinoma. Nat Genet. 48, 265-272 (2016).
- Ryan, R. J. H., et al. Detection of enhancer-associated rearrangements reveals mechanisms of oncogene dysregulation in B-cell lymphoma. Cancer Discov. 5, 1058-1071 (2015).
- Montavon, T., et al. A regulatory archipelago controls Hox genes transcription in digits. Cell. 147, 1132-1145 (2011).
- Lupianez, D. G., et al. Disruptions of topological chromatin domains cause pathogenic rewiring of gene-enhancer interactions. Cell. 161, 1012-1025 (2015).
Reprints and Permissions
