Here, we describe an in situ hybridization assay which enables sensitive and specific detection of sequences as short as 50 nucleotides with single-nucleotide resolution at the single-cell level. The assay, which can be performed manually or automatically, can enable visualization of splice variants, short sequences, and mutations within the tissue context.
Method Article
Visualizing Genetic Variants, Short Targets, and Point Mutations in the Morphological Tissue Context with an RNA In Situ Hybridization Assay
In This Article
Summary
Abstract
Because precision medicine is highly dependent on the accurate detection of biomarkers, there is an increasing need for standardized and robust technologies that measure RNA biomarkers in situ in clinical specimens. While grind-and-bind assays like RNAseq and quantitative RT-PCR enable highly sensitive gene expression measurements, they also require RNA extraction and thus prevent valuable expression analysis within the morphological tissue context. The in situ hybridization (ISH) assay described here can detect RNA target sequences as short as 50 nucleotides at single-nucleotide resolution and at the single-cell level. This assay is complementary to the previously developed commercial assay and enables sensitive and specific in situ detection of splice variants, short targets, and point mutations within the tissue. In this protocol, probes were designed to target unique exon junctions for two clinically important splice variants, EGFRvIII and METΔ14. The detection of short target sequences was demonstrated by the specific detection of CDR3 sequences of T-cell receptors α and β in the Jurkat T-cell line. Also shown is the utility of this ISH assay for the distinction of RNA target sequences at single-nucleotide resolution (point mutations) through the visualization of EGFR L858R and KRAS G12A single-nucleotide variations in cell lines using automated staining platforms. In summary, the protocol shows a specialized RNA ISH assay that enables the detection of splice variants, short sequences, and mutations in situ for manual performance and on automated stainers.
Introduction
High-throughput transcriptomic technologies such as microarrays and next-gen RNA sequencing (RNAseq) have exponentially improved the discovery of RNA biomarkers with diagnostic, prognostic, and predictive clinical value for various diseases including cancer1,2. To advance the use of these biomarkers in precision medicine, there is a high need for standardized and robust technologies that can measure RNA biomarkers within the tissue context of clinical samples. While widely established grind-and-bind assays like RNAseq and quantitative RT-PCR enable highly sensitive gene expression measurements, the required tissue homogenization and RNA isolation imply the loss of in vivo cell-type specificity and morphological information3. Conventional in situ RNA detection methodologies lack the sensitivity and specificity required to reliably measure rare or low-expressing RNA biomarkers within the tissue context4.
A commercial in situ hybridization (ISH) assay (e.g., the RNAscope assay) is one technology that has tackled these challenges and also enables the highly sensitive and specific visualization of single RNA molecules greater than 300 nucleotides within the tissue morphological context. This type of assay uses a unique oligonucleotide probe design of approximately 6–20 double-Z probe pairs combined with an advanced hybridization-based signal amplification5.
This study describes a specialized RNA ISH assay, BaseScope, complementary to the previously designed commercial technology that can detect RNA target sequences as short as 50 nucleotides at single nucleotide resolution. This assay addresses the intricate complexities of the transcriptome and is applicable for the accurate detection of exon junctions, short target sequences, and point mutations in the tissue context (Table 1) using as little as one double-Z probe pair. This report demonstrates the complete assay protocol and its use in the detection of splice variants, CDR3 sequences for T-cell receptor clones, and single-nucleotide mutations in FFPE cell lines and tumor tissues.
Protocol
The human tumor samples used in this study were deidentified and acquired from commercial sources in accordance with the local ethical guidelines for human research.
1. Sample, Equipment, and Reagent Preparation
- FFPE Sample Preparation
- Tissues
- Immediately following dissection, fix the tissue (cut into blocks of 3–4 mm in thickness) in 10% neutral-buffered formalin (NBF) for 16–32 h at room temperature (RT).
NOTE: Fixation time will vary depending on tissue type and size. - Wash the sample with 1x phosphate-buffered saline (PBS) and dehydrate using a standard ethanol (EtOH) series (70% EtOH for 30–60 min, 80% EtOH for 30–60 min, 90% EtOH for 30–60 min, 95% EtOH for 30–60 min, 3x 100% for EtOH 30–60 min) followed by xylene.
- Embed the sample in paraffin using standard procedures6 and trim the paraffin blocks as needed to remove excess paraffin.
NOTE: Block size will vary depending on the tissue sample size, but a typical size is 0.75 x 0.75 inches2 or smaller.
- Immediately following dissection, fix the tissue (cut into blocks of 3–4 mm in thickness) in 10% neutral-buffered formalin (NBF) for 16–32 h at room temperature (RT).
- Cell lines
- Collect and pellet cells according to the recommended methods for the specific cell line.
- Fix cells in 10% formaldehyde at RT for 24 h on a rotator.
- Prepare cells as a pellet in prewarmed processing gel (e.g., Histogel). Allow the pellet to solidify by placing the gel-cell pellet onto a piece of parafilm on ice, and let it sit for 2–3 min. Submerge the gel-cell pellet in 1x PBS.
- Dehydrate and embed the cell pellets as described in step 1.1.1.
- Section preparation
- Cut the embedded tissue/cells into 5 ± 1 μm sections using a microtome, mount the sections on electrostatically adhesive glass slides, and air-dry them overnight at RT.
NOTE: The slides can be stored at RT under desiccation for up to 3 months. - Place the slides in a slide rack and bake the mounted tissue slides in a circulating air oven at 60 °C for 1 h before performing the assay.
NOTE: Use the slides immediately or store them at RT with desiccants for up to 1 week. Prolonged storage may result in RNA degradation.
- Cut the embedded tissue/cells into 5 ± 1 μm sections using a microtome, mount the sections on electrostatically adhesive glass slides, and air-dry them overnight at RT.
- Tissues
- Equipment preparation
- Set the hybridization oven to 40 °C. Thoroughly wet the humidifying paper and remove any residual dH2O. Insert the paper into the humidity control tray, and insert the tray into the hybridization oven to prewarm for at least 30 min before use.
- Reagent preparation
- Fill two clearing agent dishes with 200 mL of xylene and fill two staining dishes with 200 mL of 100% EtOH, which will be used for deparaffinization of sections.
- Prepare 200 mL of commercially available 1x target retrieval reagent by adding 180 mL of dH2O to 20 mL of 10x target retrieval reagent. Place two slide holders in a steamer. Fill one slide holder with 200 mL of 1x target retrieval reagent and fill the other slide holder with 200 mL of dH2O. Heat both solutions to a boil using the steamer.
- Warm 50x wash buffer to 40 °C for 10–20 min. Prepare 3 L of 1x wash buffer by diluting 60 mL of prewarmed 50x wash buffer with 2.94 L of dH2O.
- In a fume hood, prepare 50% Gill’s Hematoxylin counterstaining solution by adding 100 mL of Gill’s Hematoxylin to 100 mL of dH2O. In the fume hood, prepare bluing reagent (0.02% (w/v) ammonia water) by adding 1.43 mL of 28–30% ammonium hydroxide to 250 mL of dH2O.
- Prewarm target probes at 40 °C for 10 min prior to probe hybridization and bring the amplifying reagents (AMP 0–6) to RT.
2. RNA In Situ Hybridization Assay
- Deparaffinization and dehydration
- After baking as described in step 1.1.3.2 (optional stopping point 1), deparaffinize the sections in xylene for 5 min with agitation. Deparaffinize again in fresh xylene for 5 min. Dehydrate in 100% EtOH for 2 min with agitation, and repeat again in fresh 100% EtOH for 2 min.
- Air dry the slides for 5 min at 60 °C in a circulating air oven or at RT until they are completely dry (optional stopping point 2).
- Sample pretreatments
- Incubate the sections with ~4 drops of ready-to-use hydrogen peroxide for 10 min at RT to quench the endogenous peroxidase activity. Decant the solution from the slides and rinse them twice with dH2O.
- Incubate the sections with 200 mL of the target retrieval reagent for 15–30 min at 100 °C in a steamer.
NOTE: Incubation time may vary depending on tissue type. In this protocol, target retrieval was performed for 15 min for both tumor samples and cell pellets. - Decant the solution from the slides, rinse twice with dH2O, dip in 100% EtOH for 3 min, and dry the slides at 60 °C in a circulating air oven or at RT until completely dry.
- Draw a hydrophobic barrier around the section using a hydrophobic pen, approximately 0.75 x 0.75 inches2.
NOTE: It is not recommended to draw a smaller barrier. For larger sections, a larger barrier will need to be drawn. - Let the barrier dry completely for 1 min, or leave overnight at RT (optional stopping point 3).
- Place the slides in a slide holder and place the slide holder in the humidity control tray. Add ~4 drops of Protease III to each slide and incubate them for 15–30 min at 40 °C in the hybridization oven for protein digestion.
Note: Incubation time may vary depending on the tissue type. In this protocol, protease digestion was performed for 30 min for tumor samples and 15 min for cell pellets. - Decant the solution from the slides and rinse them twice with dH2O.
- Probe hybridization
- Add ~4 drops of the appropriate ready-to-use probe solution to cover the entire section. If using larger sections, add ~5–6 drops.
- Hybridize the probes for 2 h at 40 °C in the hybridization oven. Decant the solution from the slides and wash the slides in 200 mL of 1x wash buffer for 2 min at RT with occasional agitation. Repeat the washing procedure in this step.
- Signal amplification
- Incubate the sections with ~4 drops of AMP 0 per slide at 40 °C in the hybridization oven for 30 min. Decant the solution and wash the slides in 200 mL of 1x wash buffer for 2 min at RT with occasional agitation. Repeat the washing procedure in this step.
- Incubate the sections with ~4 drops of AMP 1 per slide at 40 °C in the hybridization oven for 15 min. Decant the solution and wash the slides in 200 mL of 1x wash buffer for 2 min at RT with occasional agitation. Repeat the washing procedure.
- Incubate the sections with ~4 drops of AMP 2 per slide at 40 °C in the hybridization oven for 30 min. Decant the solution and wash the slides in 200 mL of 1x wash buffer for 2 min at RT with occasional agitation. Repeat the washing procedure.
- Incubate the sections with ~4 drops of AMP 3 per slide at 40 °C in the hybridization oven for 30 min. Decant the solution and wash the slides in 200 mL of 1x wash buffer for 2 min at RT with occasional agitation. Repeat the washing procedure.
- Incubate the sections with ~4 drops of AMP 4 per slide at 40 °C in the hybridization oven for 15 min. Decant the solution and wash the slides in 200 mL of 1x wash buffer for 2 min at RT with occasional agitation. Repeat the washing procedure.
- Incubate the sections with ~4 drops of AMP 5 per slide at RT for 30 min. Decant the solution and wash the slides in 200 mL of 1x wash buffer for 2 min at RT with occasional agitation. Repeat the washing procedure.
- Incubate the sections with ~4 drops of AMP 6 per slide at RT for 15 min. Decant the solution and wash the slides in 200 mL of 1x wash buffer for 2 min at RT with occasional agitation. Repeat the washing procedure.
- Signal detection
- Prepare the Fast Red dye working solution. For one slide with a 0.75 x 0.75 inches2 barrier, add 2 μL of the Fast Red-B dye to 120 μL of Fast Red-A into a tube and mix well.
NOTE: Depending on the size of the hydrophobic barrier and number of slides, volumes of the Fast Red working solution will vary. - Decant the excess liquid from the slides and add the Fast Red dye working solution to the slides. Incubate the slides for 10 min at RT in the tray with a cover to avoid light exposure.
NOTE: Use the Fast Red working solution within 5 min of preparation, and do not expose it to direct sunlight or UV light. - Decant the Fast Red solution and rinse the slides twice with tap water. Place the slides back in a slide rack.
- Prepare the Fast Red dye working solution. For one slide with a 0.75 x 0.75 inches2 barrier, add 2 μL of the Fast Red-B dye to 120 μL of Fast Red-A into a tube and mix well.
- Counterstaining
- Counterstain the tissue sections with 50% Gill’s Hematoxylin solution for 2 min at RT. Wash the slides with tap water and repeat this several times until the slides are clear, while the sections remain purple. Dip the slides into 0.02% ammonia water for bluing (dip 2–3 times). Replace the ammonia water with tap water and wash the slides 3–5 times.
- Slide mounting
- Dry the slides in a circulating air oven at 60 °C for 15 min or at RT until completely dry. Place 1–2 drops of mounting reagent on each slide and place coverslips over each section. Avoid any trapping of air bubbles. Air dry the slides for at least 5 min.
NOTE: The Fast Red substrate is alcohol-sensitive. Do not dehydrate the slides in alcohol.
- Dry the slides in a circulating air oven at 60 °C for 15 min or at RT until completely dry. Place 1–2 drops of mounting reagent on each slide and place coverslips over each section. Avoid any trapping of air bubbles. Air dry the slides for at least 5 min.
- Visualization
- Observe the slides under a standard brightfield microscope.
Results
The in situ hybridization assay workflow:
The workflow is depicted in Figure 1 and consists of four parts: permeabilization of cells or tissues with target retrieval and protease solutions, hybridization of the probes to the target RNA, signal amplification, and visualization of the signal. The signal can also be quantified using digital imaging software systems or in a semi-quantitative manner based on the number of dots per cell. The manual procedure described in Figure 2 has also been fully automated in commercial auto-staining systems.
Representative staining for exon junction detection (EGFRvIII splice variant): EGFRvIII is a variant of the epidermal growth factor receptor that arises from an in-frame genomic deletion of exons 2 to 7, leading to constitutively active oncogenic signaling7. The assay was used to identify EGFRvIII status in FFPE glioblastoma (GBM) tumor samples. Single double-Z probes were designed to span the exon junctions in order to detect either WT, mutant, or both transcripts (Figure 3A). The WT EGFR probes span the junctions of either exons 1 and 2 (E1/E2) or exons 7 and 8 (E7/E8), while the EGFRvIII-specific probes span the junction of exons 1 and 8 (E1/E8). A common probe that spans the junction of exons 8 and 9 (E8/E9) was also used to detect total EGFR (both WT and EGFRvIII transcripts). All the probes were then used to determine EGFR status in FFPE GBM samples. The two representative examples shown in Figure 3B were taken from a larger study. EGFR status was confirmed by an independent method, RT-PCR. Both WT probes detected signal in both samples, indicating that the two samples express WT EGFR (Figure 3B). However, the mutant probe only showed signal detection in the EGFRvIII+ sample, confirming that this sample is indeed positive for the EGFRvIII variant (Figure 3B, left panels). Conversely, the mutant probe did not detect signal in the EGFRvIII- sample (Figure 3B, right panels). Taken together, these results demonstrate that the exon junction assay can identify EGFRvIII status in GBM FFPE tumor samples.
Representative staining for short targets:
The CDR3, or complementary determining region 3, is a highly variable domain in T-cell receptors. Typically, the CDR3 sequence are quite short; for example, the CDR3 α and β sequences from the Jurkat T-cell line are 51 and 48 nucleotides in length, respectively (Figure 4A). To identify the specific CDR sequences expressed in Jurkat cells, antisense probes for CDR3 α and β that are expressed in the Jurkat T-cell line were generated, in addition to sense probes for CDR3 α and β to serve as negative control probes. All the probes were then tested in FFPE-prepared Jurkat cells with the assay. Robust staining was observed with anti-sense probes for both CDR3 α and β in the Jurkat cells, whereas sense probes detected little to no signal (Figure 4B). These results demonstrate the ability of the short target assay to discern between highly variable but short CDR sequences for T-cell receptor clones.
Representative staining for point mutation EGFR L858R:
Point mutation probes were developed to detect single nucleotide variations and small insertions or deletions (INDELs) in the tumor context. Figure 5A demonstrates the ability for in situ detection of the point mutation EGFR L858R (2573T>G). Two probes were designed: one to detect the L858R mutated EGFR sequence, and another to detect the EGFR L858 WT sequence. Both probes were tested in two FFPE-prepared cell lines: H2229, which only expresses EGFR L858 WT; and H1975, which is heterozygous for the EGFR L858R mutation. The L858R mutant probe detected signal only in the H1975 cell line but not in the H2229 cell line. However, the WT probe detected signal in both cell lines. Similarly, Figure 5B visualizes in situ detection of the point mutation KRAS G12A (35 G>C). Two probes were designed to detect the KRAS G12A MT and KRAS G12 WT sequences and then tested on the HuT78 cell line (which only expresses KRAS G12 WT) and the SW116 cell line (which is heterozygous for the KRAS G12A mutation). While the KRAS G12 WT probe detected signal in both cell lines, the KRAS G12A probe only detected signal in the SW116 cell line. Taken together, these data demonstrate the technical capability of the point mutation assay in detecting single nucleotide polymorphisms in the cell and tissue context.
Representative staining for the automated in situ assay:
Automated assays allow for a greater number of samples to be run more reliably, minimizing inter-user variability and hands-on time and generating consistently reproducible results. Therefore, an automated version of the assay was developed. To demonstrate automated staining with this assay, detection of the splice variant METΔ14 was examined. This variant is the result of exon 14 in the MET gene being skipped during pre-mRNA splicing, which leads to constitutive activation and oncogenic transformation of the MET receptor8,9. To specifically detect the METΔ14 variant, two exon junction probes were designed: one that spans the junction of exons 13 and 15 (E13/E15) to detect the METΔ14 variant transcript, and another that spans the junction of exons 14 and 15 (E14/E15) to detect the WT MET transcript (Figure 6A). Both probes were then tested in 2 FFPE-prepared cell lines: H596, which expresses the METΔ14 variant, and A549, which expresses the WT MET gene. Both probes showed mutually exclusive expression patterns, with the E13/E15 probe only detecting signal in the H596 cells and the E14/E15 probe only detecting signal in the A549 cells (Figures 6B and 6C). Lastly, the probe for dapB showed no signal, indicating no background signal (Figures 6B and 6C). Overall, this data demonstrates specific detection of the MET variant METΔ14 in situ utilizing the automated BaseScope assay.
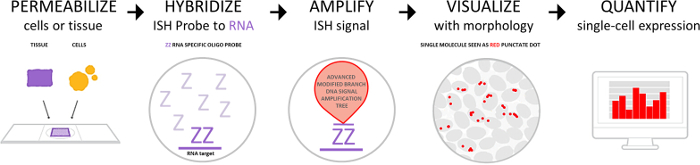
Figure 1: The assay workflow. The workflow consists of 4 major steps: pretreatment to permeabilize cells or tissue, probe hybridization to target RNA, signal amplification, and signal detection by visualization under brightfield or fluorescent microscope. Individual dots can be quantified using a digital image analysis platform. Please click here to view a larger version of this figure.
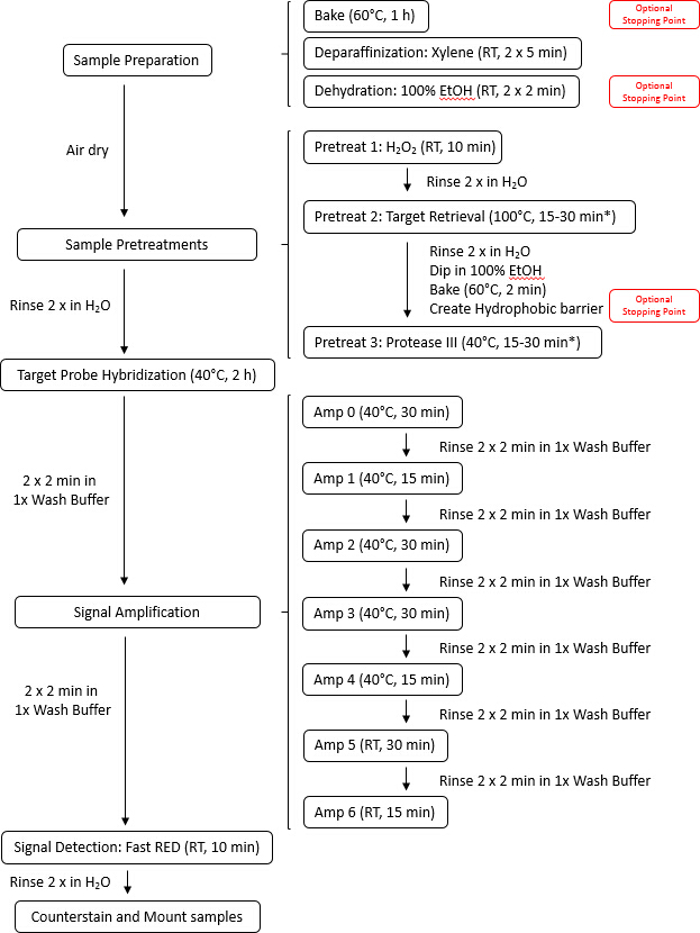
Figure 2: Illustration of the manual assay protocol. The entire assay can be completed in 9 h. Pretreatment times may vary depending on tissue type, so it is advised to consult Appendix A in the user manual for tissue pretreatment recommendations regarding incubation time. Please click here to view a larger version of this figure.
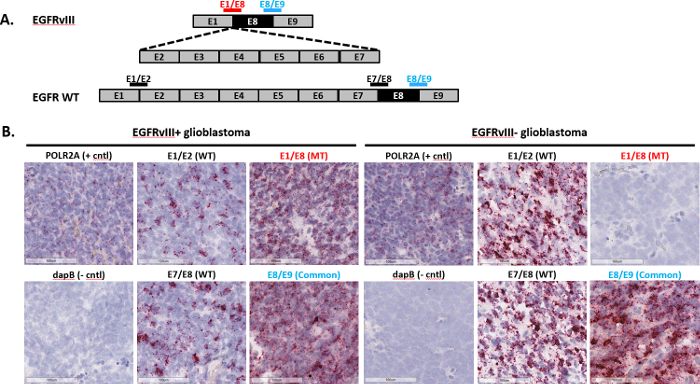
Figure 3: Representative images of exon junction detection. (A) Shown here are the exon organization for EGFR WT and EGFRvIII transcripts and a schematic depicting double-Z exon junction probes that straddle the junction to detect EGFR WT or EGFRvIII. (B) The exon junction assay was performed on two FFPE glioblastoma samples using the probes listed in (A), as well as a positive control probe, POLR2A, and negative control probe, dapB. Please click here to view a larger version of this figure.
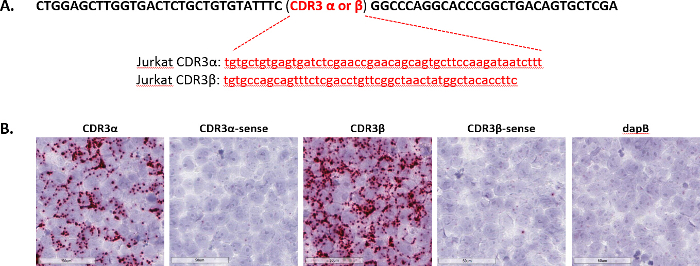
Figure 4: Representative images of short target sequence detection. (A) Shown here are CDR3 sequences in Jurkat cells. The sequence in black is a flanking common sequence and the sequence in red is unique to either CDR3α or CDR3β. Single double-Z short target sequence probes were designed against these sequences. (B) The short target assay was performed on Jurkat cells prepared as an FFPE cell pellet using anti-sense or sense probes targeting the sequences in (A), and dapB was used as a negative control. Please click here to view a larger version of this figure.
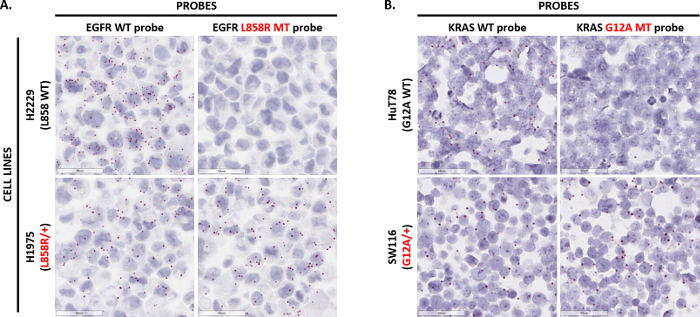
Figure 5: Representative images of point mutation detection. (A) The assay was performed on H2229 cells (homozygous for EGFR L858) and H1975 cells (heterozygous for the EGFR L858R mutation) prepared as an FFPE cell pellet using single double-Z point mutation probes targeting the EGFR L858 WT sequence or EGFR L858R mutated sequence. (B) The point mutation assay was performed on HuT78 cells (homozygous for KRAS G12A) and SW116 cells (heterozygous for the KRAS G12A mutation) prepared as an FFPE cell pellet using single double-Z point mutation probes targeting the KRAS G12 WT sequence or KRAS G12A mutated sequence. Please click here to view a larger version of this figure.
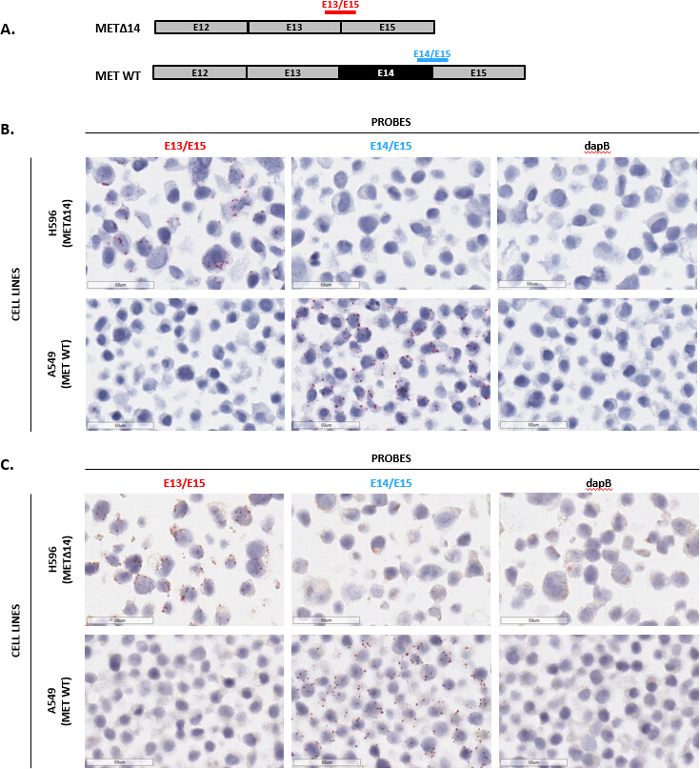
Figure 6: Representative images of automated staining with the exon junction assay. (A) Shown here is the exon organization for MET WT and METΔ14 transcripts and a schematic depicting single double-Z exon junction probes that straddle the junction to detect MET WT or METΔ14. (B) and (C) The automated exon junction assay was performed on H596 cells (expressing METΔ14) and A549 cells (expressing MET WT) prepared as an FFPE cell pellet using the probes listed in (A), as well as negative control probe dapB. Please click here to view a larger version of this figure.
| Exon Junction | Short Sequence | Point Mutation |
| Splice variant/isoform | Sequences between 50 and 300 nt | Point mutation |
| Circular RNA (circRNA) | Highly homologous sequences | Short indel |
| Gene fusion | CDR3 sequence for TCR clones | Gene editing |
| Gene knockout (KO) | Pre-miRNA | |
| Small nucleolar RNA (snoRNA) | ||
| Gene editing |
Table 1: Applications of the in situ assay. There are 3 main categories for applications of this assay: exon junction, short target sequence, and point mutation. Listed in each column are some specific application examples for each category.
Discussion
In this report, the novel ISH assay protocol and its applications were discussed in detail. The assay allows for the direct visualization of exon junctions, short-target and highly homologous sequences, and point mutations in the tissue context. The assay is based on RNAscope technology5 and is therefore capable of single molecule detection. However, due to an advanced amplification system, the signal can be detected with probes containing as little as one double-Z pair or with a target template length of just 50 nucleotides. Because the probes may be as short as a single double-Z in length, this allows for the detection of exon junctions, short-target and highly homologous sequences, and point mutations (Table 1).
For successful performance of the assay, there are several technical recommendations. First, tissues should be fixed in fresh 10% neutral-buffered formalin (NBF) at room temperature for 16–32 h10. Underfixation (<16 h) or overfixation (>32 h) will impair performance of the assay and may require additional optimization. Second, to ensure optimal control of temperature and humidity, which are required for robust probe hybridization and signal amplification, the slide processing system and hybridization oven should be used for protocol steps 2.3 to 5 (protease pretreatment, probe hybridization, signal amplification, and signal detection). Third, excess residual buffers should be properly decanted before each step throughout the protocol (but not so much so that the tissue sections dry out). If the slides dry out, significant non-specific signal will develop. Fourth, depending on the tissue type, pretreatment optimization may be necessary. Using the wrong protease or performing for a suboptimal length of time may result in under- or over-digestion and will negatively affect the signal. Lastly, it is important to always run positive and negative controls with the test probes. Negative control probes ensure that there is no background signal, and positive control probes ensure that the assay has been done correctly and that the RNA quality in the sample is optimal for interpreting test probe results. If there is no signal with the positive control probe, then the RNA quality in the sample is likely suboptimal and a signal may not be seen with the test probe.
In addition to the manual assay, the ability to perform the assay on automated stainers was also demonstrated (Figure 6). This automated ISH assay yields a high signal-to-noise ratio and is applicable for the same applications as shown in Table 1; however, benefits of an automated assay include standardization of assay conditions, minimization of inter-user variability and hands-on time, and allowance for high-throughput screening of tissue samples in a reliable manner.
While immunohistochemistry (IHC) and qRT-PCR allow for detection of splice variants (particularly EGFRvIII), in FFPE clinical specimens, these techniques can lack the necessary specificity and do not offer insight into the spatial resolution of the splice variant expression, respectively11,12. A key advantage of the assay in this protocol is its highly sensitive and specific visualization of splice junctions while preserving the morphological tissue context. Here, the assay's ability to precisely target unique exon junctions for several splice variants, including EGFRvIII and METΔ14, was demonstrated (Figures 3 and 6). In addition, the assay has been shown to detect the splice variant AR-V7 in prostate cancer, multiple isoforms of ErbB4 in the brain, and confirmation of knockout of circular RNA Cdr1as in the mouse brain3,13,14.
Short target sequence detection by this ISH assay allows for visualization of RNA sequences as short as 50 nucleotides in length, as demonstrated by the detection of CDR3 sequences derived from Jurkat cells (Figure 3). The assay can also detect gene sequences that are highly homologous to other family members or species, as shown by Revêchon et al., who used the short target assay to detect human progerin expressed in mouse subcutaneous white adipose tissue15. In addition, small nucleolar RNA (snoRNA), CRISPR-mediated gene editing, and precursor-microRNA can be detected in situ with the short target assay. More recently, Fu et al. combined this ISH assay with IHC to identify precise cells in the retina expressing the pre-miRNA mir125b16.
Mutation profiling in tumors is critical for studying the progression of tumors and for developing targeted therapies. While mutation profiling can be achieved via high-throughput sequencing, this technology cannot fully address intratumoral heterogeneity or link genetic alterations with cellular morphology17,18. The detection of point mutations using this ISH assay allows for distinction of RNA target sequences at a single-base resolution, as validated by the detection of EGFR L858R and KRAS G12A single nucleotide variations in cell lines (Figure 5). Furthermore, Baker et al. used the point mutation assay to target multiple mutations in the BRAF, KRAS, and PIK3CA oncogenes in colorectal cancer18. They were able to identify and spatially map rare mutant subclones of tumor cells, ultimately showing how they contribute to intra-tumor heterogeneity.
In summary, a specialized RNA ISH assay has been developed. This methodology allows for the detection of splice variants, short sequences, and mutations in situ. It is sensitive, specific, quantifiable, and adaptable to performance both by manual methods and on automated stainers.
Disclosures
All authors are employed by Advanced Cell Diagnostics, Inc.
Materials
| Name | Company | Catalog Number | Comments |
|---|---|---|---|
| HybEZ Oven (110 or 220 VAC) or HybEZ II Oven (110 or 220V) | ACD | 310010 or 310013 (HybEZ™), 321710 or 321720 (HybEZ™ II) | |
| HybEZ Humidity Control Tray (with lid) | ACD | 310012 | |
| ACD EZ-Batch Slide Rack (20 slide capacity) 1 rack 310017 | ACD | 310017 | |
| HybEZ Humidifying Paper | ACD | 310015 | |
| ImmEdge Hydrophobic Barrier Pen (required) | Vector Laboratory | H-4000 | |
| SuperFrost Plus Slides (required) | Fisher Scientific | 12-550-15 | |
| 10% neutral-buffered formalin (NBF) | MLS | / | MLS Major Laboratory Supplier in North America. For other regions, please check Catalog Numbers with your local lab supplier. |
| Paraffin wax | MLS | / | MLS Major Laboratory Supplier in North America. For other regions, please check Catalog Numbers with your local lab supplier. |
| Microtome | MLS | / | MLS Major Laboratory Supplier in North America. For other regions, please check Catalog Numbers with your local lab supplier. |
| Gill’s Hematoxylin I | American Master Tech Scientific/MLS | HXGHE1LT | MLS Major Laboratory Supplier in North America. For other regions, please check Catalog Numbers with your local lab supplier. |
| Xylene | Fisher Scientific/MLS | X3P-1GAL | MLS Major Laboratory Supplier in North America. For other regions, please check Catalog Numbers with your local lab supplier. |
| Tissue-Tek Vertical 24 Slide Rack | American Master Tech Scientific/MLS | LWSRA24 | MLS Major Laboratory Supplier in North America. For other regions, please check Catalog Numbers with your local lab supplier. |
| Tissue-Tek Staining Dishes | American Master Tech Scientific/MLS | LWT4457EA | MLS Major Laboratory Supplier in North America. For other regions, please check Catalog Numbers with your local lab supplier. |
| Tissue-Tek Clearing Agent Dishes, xylene resistant | American Master Tech Scientific/MLS | LWT4456EA | MLS Major Laboratory Supplier in North America. For other regions, please check Catalog Numbers with your local lab supplier. |
| 100% alcohol (EtOH) | American Master Tech Scientific/MLS | ALREACS | MLS Major Laboratory Supplier in North America. For other regions, please check Catalog Numbers with your local lab supplier. |
| VectaMount Permanent Mounting Medium (required) | Vector Labs | H-5000 | |
| Cover Glass, 24 mm x 50 mm | Fisher Scientific/MLS | 12-545-F | MLS Major Laboratory Supplier in North America. For other regions, please check Catalog Numbers with your local lab supplier. |
| Ammonium hydroxide, 28–30% | Sigma-Aldrich/MLS | 320145-500mL | MLS Major Laboratory Supplier in North America. For other regions, please check Catalog Numbers with your local lab supplier. |
| Carboy (>3L) | MLS | / | MLS Major Laboratory Supplier in North America. For other regions, please check Catalog Numbers with your local lab supplier. |
| Oster Steamer Model 5712, Black and Decker Steamer HS3000, or the Braun Multiquick FS 20 Steamer | / | / | |
| Digital thermometer | MLS | / | MLS Major Laboratory Supplier in North America. For other regions, please check Catalog Numbers with your local lab supplier. |
| Water bath or incubator, capable of holding temperature at 40 +/– 1 °C | MLS | / | MLS Major Laboratory Supplier in North America. For other regions, please check Catalog Numbers with your local lab supplier. |
| Pipettors and tips, 1–1,000 μL | MLS | / | MLS Major Laboratory Supplier in North America. For other regions, please check Catalog Numbers with your local lab supplier. |
| Distilled water | MLS | / | MLS Major Laboratory Supplier in North America. For other regions, please check Catalog Numbers with your local lab supplier. |
| Tubes (various sizes) | MLS | / | MLS Major Laboratory Supplier in North America. For other regions, please check Catalog Numbers with your local lab supplier. |
| Fume hood | MLS | / | MLS Major Laboratory Supplier in North America. For other regions, please check Catalog Numbers with your local lab supplier. |
| Graduated cylinder | MLS | / | MLS Major Laboratory Supplier in North America. For other regions, please check Catalog Numbers with your local lab supplier. |
| Parafilm | MLS | / | MLS Major Laboratory Supplier in North America. For other regions, please check Catalog Numbers with your local lab supplier. |
| Paper towel or absorbent paper | MLS | / | MLS Major Laboratory Supplier in North America. For other regions, please check Catalog Numbers with your local lab supplier. |
| Microcentrifuge | MLS | / | MLS Major Laboratory Supplier in North America. For other regions, please check Catalog Numbers with your local lab supplier. |
| Microscope and accessories | MLS | / | MLS Major Laboratory Supplier in North America. For other regions, please check Catalog Numbers with your local lab supplier. |
| Drying oven, capable of holding temperature at 60 +/– 1 °C | MLS | / | MLS Major Laboratory Supplier in North America. For other regions, please check Catalog Numbers with your local lab supplier. |
| Formaldehyde | MLS | / | MLS Major Laboratory Supplier in North America. For other regions, please check Catalog Numbers with your local lab supplier. |
| Histogel | Fisher Scientific/MLS | 22-110-678 | |
| BaseScope Reagent Kit - RED | Advanced Cell Diagnostics | 322900 | |
| BaseScope Hs-EGFR-E1E2 | Advanced Cell Diagnostics | 701701 | |
| BaseScope Hs-EGFR-E1E8 | Advanced Cell Diagnostics | 701711 | |
| BaseScope Hs-EGFR-E7E8 | Advanced Cell Diagnostics | 701721 | |
| BaseScope Hs-EGFR-E8E9 | Advanced Cell Diagnostics | 701731 | |
| BaseScope Hs-MET-E14E15 | Advanced Cell Diagnostics | 701811 | |
| BaseScope Hs-MET-E13E15 | Advanced Cell Diagnostics | 701801 | |
| BaseScope Hs-KRAS-G12A | Advanced Cell Diagnostics | 705491 | |
| BaseScope Hs-KRAS-G12-nt35WT | Advanced Cell Diagnostics | 705531 | |
| BaseScope Hs-EGFR-L858R | Advanced Cell Diagnostics | 705451 | |
| BaseScope Hs-EGFR-L858WT | Advanced Cell Diagnostics | 705461 | |
| BaseScope Control Probe Pack Human | Advanced Cell Diagnostics | 322975 |
References
- Bolha, L., Ravnik-Glavač, M., Glavač, D. Circular RNAs: Biogenesis, Function, and a Role as Possible Cancer Biomarkers. International Journal of Genomics. 2017, 6218353(2017).
- Yamada, A., Yu, P., Lin, W., Okugawa, Y., Boland, C. R., Goel, A. A RNA-Sequencing approach for the identification of novel long non-coding RNA biomarkers in colorectal cancer. Scientific Reports. 8 (1), 575(2018).
- Erben, L., He, M. X., Laeremans, A., Park, E., Buonanno, A. A Novel Ultrasensitive In Situ Hybridization Approach to Detect Short Sequences and Splice Variants with Cellular Resolution. Molecular Neurobiology. , Epub ahead of print (2017).
- Mahmood, R., Mason, I. In-situ hybridization of radioactive riboprobes to RNA in tissue sections. Methods in Molecular Biology. 461, 675-686 (2008).
- Wang, F., et al. RNAscope: a novel in situ RNA analysis platform for formalin-fixed, paraffin-embedded tissues. Journal of Molecular Diagnostics. 14 (1), 22-29 (2012).
- Paraffin processing of tissue. Protocols Online. , Available from: https://www.protocolsonline.com/histology/sample-preparation/paraffin-processing-of-tissue/ (2016).
- An, Z., Aksoy, O., Zheng, T., Fan, Q. W., Weiss, W. A. Epidermal growth factor receptor and EGFRvIII in glioblastoma: signaling pathways and targeted therapies. Oncogene. , Epub ahead of print (2018).
- Frampton, G. M., et al. Activation of MET via diverse exon 14 splicing alterations occurs in multiple tumor types and confers clinical sensitivity to MET inhibitors. Cancer Discovery. 5 (8), 850-859 (2015).
- Awad, M. M., et al. MET Exon 14 Mutations in Non-Small-Cell Lung Cancer Are Associated With Advanced Age and Stage-Dependent MET Genomic Amplification and c-Met Overexpression. Journal of Clinical Oncology. 34 (7), 721-730 (2016).
- Hammond, M. E., et al. American Society of Clinical Oncology/College of American Pathologists guideline recommendations for immunohistochemical testing of estrogen and progesterone receptors in breast cancer. Archives of Pathology and Laboratory Medicine. 134 (6), 907-922 (2010).
- Gan, H. K., Cvrljevic, A. N., Johns, T. G. The epidermal growth factor receptor variant III (EGFRvIII): where wild things are altered. Federation of European Biochemical Societies Journal. 280 (21), 5350-5370 (2013).
- Wheeler, S. E., Egloff, A. M., Wang, L., James, C. D., Hammerman, P. S., Grandis, J. R. Challenges in EGFRvIII detection in head and neck squamous cell carcinoma. Public Library of Science One. 10 (2), e0117781(2015).
- Zhu, Y., et al. Novel Junction-specific and Quantifiable In Situ Detection of AR-V7 and its Clinical Correlates in Metastatic Castration-resistant Prostate Cancer. European Urology. , Epub ahead of print (2017).
- Piwecka, M., et al. Loss of a mammalian circular RNA locus causes miRNA deregulation and affects brain function. Science. , Epub ahead of print (2017).
- Revêchon, G., et al. Rare progerin-expressing preadipocytes and adipocytes contribute to tissue depletion over time. Scientific Reports. 7 (1), 4405(2017).
- Fu, Y., et al. Functional ectopic neuritogenesis by retinal rod bipolar cells is regulated by miR-125b-5p during retinal remodeling in RCS rats. Scientific Reports. 7 (1), 1011(2017).
- Yates, L. R., et al. Subclonal diversification of primary breast cancer revealed by multiregion sequencing. Nature Medicine. 21 (7), 751-759 (2015).
- Baker, A. M., et al. Robust RNA-based in situ mutation detection delineates colorectal cancer subclonal evolution. Nature Communications. 8 (1), 1998(2017).
Reprints and Permissions
