

Summary
This protocol describes a new behavioral test—the human approach test in the pigs' home pen—to detect functional deficits in laboratory pigs after subconcussive traumatic brain injury.
Abstract
Traumatic brain injury (TBI) incidences have increased in both civilian and military populations, and many researchers are adopting a porcine model for TBI. Unlike rodent models for TBI, there are few behavioral tests that have been standardized. A larger animal requires more invasive handling in test areas than rodents, which potentially adds stress and variation to the animals' responses. Here, the human approach test (HAT) is described, which was developed to be performed in front of laboratory pigs' home pen. It is noninvasive, but flexible enough that it allows for differences in housing set-ups.
During the HAT, three behavioral ethograms were developed and then a formula was applied to create an approach index (AI). Results indicate that the HAT and its index, AI, are sensitive enough to detect mild and temporary alterations in pigs' behavior after a mild TBI (mTBI). In addition, although specific behavior outcomes are housing-dependent, the use of an AI reduces variation and allows for consistent measurements across laboratories. This test is reliable and valid; HAT can be used across many laboratories and for various types of porcine models of injury, sickness, and distress. This test was developed for an optimized manual timestamping method such that the observer consistently spends no more than 9 min on each sample.
Introduction
Human mTBI is often defined by functional deficits despite the absence of global structural changes or significant edema within the brain1,2,3. Indeed, in some mTBI patients, the characteristic feature of this injury is a change in their psychological state in the absence of any neuroanatomical changes4,5. We utilized a porcine model of mTBI6 because pig's brains are both anatomically and physiologically closer to humans than rodents7, and corresponding measurements could provide a relevant set of common data elements with humans.
In recent years, the porcine model has gained the interest of neurotrauma scientists and mTBI stakeholders for preclinical investigations; however, unlike rodent models of TBI, there are only a few standardized behavioral tests published that allow for the assessment of the laboratory pig's affective state (i.e., psychological state)7,8,9,10. A long-term goal for our laboratory is to develop several, complementary behavioral toolsets that are sensitive enough to measure when the pigs are experiencing subclinical sickness or when animals are in a prepathological stress-related state.
Repeated behavioral tests that measure the change of affective state in a laboratory pig may be good candidates for distinguishing an animal with a prepathological condition from healthy animals. For example, in-pen HATs were used for the commercial pig production to help farmers select healthy pigs with good temperament or modify management and housing strategies that caused distress, injury, and sickness11,12. These tests were used to quantify the motivation and overall affective state of one pig or a group of pigs13.
Our laboratory and other researchers measured motivation in pigs by quantifying three categories of behaviors: 1) exploratory states that are expressed through nonnutritive oral behaviors (NNOB), where the pig uses its mouth, snout, or face to sniff, lick, chew, and root a substrate, or they chomp without a substrate14,15; 2) spatial relationships of the pig to an object or being16; 3) nose direction, which is used instead of eye contact because pigs have monocular17, but near-sighted vision, and they prioritize their sense of smell over vision18. If a healthy pig associates humans with rewarding stimuli, they express a high frequency of NNOB, direct their nose towards the human, and seek to gain closer proximity to the human11,16. However, after sickness, injury, or a distressful experience, motivation to seek even pleasurable stimuli is reduced, and thus, these measurable behaviors are likely reduced19. Swine behavior researchers noted that anhedonia, the lack of motivation to experience pleasurable stimuli, is recognizable and measurable in pigs within their home environments20. Thus, repeated HATs (before and after treatment) may serve as a sensitive measure to distinguish laboratory pigs treated with subconcussive mTBI from sham-treated (anesthesia-only) subjects. Anhedonia is one affective state that TBI patients may experience21. The HAT used here has the potential in helping to streamline the translation of behavioral findings from an animal model to clinical work. HATs can be administered daily over the course of an experiment, which may also help standardize laboratory pigs' care for optimizing animal welfare and husbandry22.
Here, using the HAT, the behavioral differences resulting from mTBI in mini-swine are probed. Minimizing behavioral variability was achieved by the utilizing noninvasive measures of the HAT and allowing the pigs to acclimate to their home pens, routine management, and a daily treat. Traditionally, a test arena is used to measure behaviors (e.g., open-field test). An in-pen test can be helpful in laboratories that have limited space. Moving and handling pigs in a test arena can cause a stress response (distress or eustress) and potentially add to the variation of the responses to the test. An in-pen test removes that handling component, and therefore, likely reduces variation from handling-stress17. For these reasons stated above, we developed a daily, in-pen HAT for this mTBI model.
Standardized and quantified measures that appropriately define the affective state of the animal are important aspects in developing a new behavior test. In addition, tests should be repeatable across multiple laboratories. Here, for developing this protocol, the HAT was tested in three laboratories' different housing systems. Three subethograms were created to timestamp specific behaviors from sample videos. Next, a weighted formula was created to incorporate the three ethograms and allow for the use of HATs across multiple laboratories. Although this test was developed and used specifically for mini-swine treated with subconcussive mTBI, the methods and protocol developed here will have applications for distinguishing the difference between a subclinically injured/sick or distressed pig and a healthy pig.
Behavior outcomes can be influenced by single vs. group housing, free-space allowance, the type of floor used, the type of fence used, the location of feeding and water, the defecation area, and the environmental enrichment location. Therefore, three housing types was examined (Figure 1): housing type A was at Kansas State University (Manhattan, KS); housing type B and C were at Virginia Tech University (Arlington, VA). The individual Institutional Animal Care and Use Committee (IACUC) at each location approved the use of the facilities and procedures.
For developing the ethogram of housing type A (Figure 1A), Minnesota-cross mini-swine (boars = 7, gilt = 1; National Swine Research Resource Center, Columbia, MO; age = 25.6 ± 3.66 [mean ± standard deviation (SD)] weeks) were housed indoors in single pens with animal-friendly flooring (IACUC #3881). The pigs used for this protocol were in good health did not have treatments applied. For developing the protocol for housing type B, Yucatan mini-pigs (age = 25.3 ± 2.80 weeks [mean ± SD] were single-housed (Figure 1B) at Virginia Tech facilities (IACUC #15-060). Animal treatments are described elsewhere29 and included the induction of subconcussive mTBI using blast-wave overpressure or sham controls (anesthesia only). For developing the protocol of housing type C, five female Göttingen mini-pigs (age = 23.7 ± 1.18 weeks [mean ±SD]) were pair-housed at Virginia Tech in a large pen (Figure 1C; IACUC #15-060). The first two housing environments are typical laboratory housing or contain single-housed pigs. Housing type C is an atypical housing environment that can house two or more pigs and may be considered more of an enriched environment than standard laboratory housing. This protocol can be used across housing types if the following methods are followed.
Protocol
The individual IACUC at each location (Kansas State University and Virginia Tech University) approved the use of facilities and procedures.
1. Set-up of the Cameras and Pens and the Establishment of a Routine
- Prior to placing the animals in their pens, fix cameras at a 90° angle over each pen (see Table of Materials for a suggested camera system).
- Record animals continuously at 30 frames/s (fps), either for the duration of the study or only during the test sessions.
- Fix bowls, waterers, mats, and toys with bolts and chains.
- Place sound machines that continuously play white or pink noise (e.g., the sound of waterfalls) in the pigs’ facility.
NOTE: External sudden noises (e.g., doors opening and shutting) can cause a startle reflex during the sessions23,24. - Randomize or stratify treatments by pen across the facility.
- Set up an established animal husbandry routine. This will help the pigs to know when to expect humans to clean the pens, feed and handle them, and perform the test.
- Use a familiar treat to allow the pigs to associate humans with a reward.
- Use a clicker during the reward to allow the pigs to associate the clicking sound with a reward. Do not use vocalizations and visual signals to familiarize the pigs with the reward (see Table of Materials).
- Conduct the sessions before the morning meal or before placing a new feed for ad libitum fed pigs.
2. Identification of the Pigs
- Make subjects identifiable on the video feed, even if they are single-housed.
- Make sure observers remain blind to treatments and unbiased during timestamping with a marking system that is not related to treatments. Use a medical grade tape (see Table of Materials) that is adhered to a strip of duct tape of a specific color, round shape, and pattern.
- Use one round patch to mark the top of the pig and one down each side (see Figure 1, green and blue markers).
- Smear tag cement (less than 0.35 g) on the tape corners to help increase the adherence longevity.
NOTE: Too much tag cement will not dry very quickly, causing the tape to fall off prematurely. - Troubleshoot and customize the marking strategy during the acclimation period so that official tests are performed efficiently and without added stress to the pigs.
- Use data collection sheets to keep track of the markings and subject identification (see Supplementary File 1 for an example data sheet).
NOTE: To remove tape, do not rip the tape off because it will cause pain if any hair is pulled out. It can either slough off on its own, a water-based lubricant can help dislodge it, or it can be shaved off with clippers. If the tape comes off at unwanted times, prepare extra marking tape and reapply it while the pig is eating a meal rather than restraining the pig.
3. HAT Sessions
- Have the test-humans wear the same hat, coveralls, boots, odors, etc. every time the session is conducted.
- Conduct sessions daily, at least 3x, before the treatment and, then, daily thereafter.
- The pig can be in any area in its pen before starting the session. To start the session, ask the test-human to drop the treat in the bowl or in front of the pen and click the clicker 3x.
- The test-human needs to place their hands out of the pig’s sight and stand stationary during the test. Have another researcher mark the start of the session on the data sheet and start a timer. After 120 s, the researcher silently signals to the test-human to move to the next subject and restart the test.
4. Establishment of HAT Ethograms for Software
- Construct ethograms (see Figures 1 and 2 and Supplementary Video 1) under one project using specialized software.
NOTE: Spatial behaviors are the location of the animal relative to the human. In the ethograms, the spatial relationships must be customized to the animal’s pen and published every time a novel pen set-up is used (Figure 1). Within this category, behaviors are considered mutually exclusive. The space is divided into four areas, with varying levels of approach (Figure 1). The areas are standardized across housing types. Closest, or climb (Cl) means that pigs may climb on the fence to gain access to the human; therefore, climbing is considered a spatial behavior that indicates the pig is most actively seeking human contact. Close (Co) denotes the area within 61 cm of the human. Mid (M) is the area within 61-122 cm from the human. Far (F) is the area of 123 cm or more from the human. - Structural behaviors focus on the orientation of the whole body or parts of the body (Figure 2). Create two structural categories: 1) the pig-nose position and 2) the active state of the pig. Use Figure 2A to identify directionality (direction 1 denotes the pig directs its nose towards the human; direction 2 means the pig directs its nose away from the human).
- Divide activity behaviors (Figure 2B) into three mutually exclusive states of approach: NNOB, stand or walk without NNOB, and resting without NNOB (see the color coding in the ethograms in the video).
NOTE: NNOB is used to describe when a pig is using its mouth, snout, or face to lick, sniff, chew, bite, rub, or root a nonnutritive object to seek out either familiarity or novel opportunities. Therefore, when it is in this active state, it is interested in the human, and in an approach-state. If overhead cameras are used at 90° angles, the pig’s nose position and head movement are indicators of NNOB. Occasionally, pigs will chomp or sham-chew; the nose can be seen but the head moves up and down. Stand or walk without NNOB is used to the describe when the pig is in the upright position, the head is still, and the nose is not touching a substrate or chomping, which means it is in less of an approach state. Resting without NNOB is used the describe when the pig is resting by lying or sitting, which is the least approach state under this category of behaviors.
5. Timestamping of the Videos for Efficiency and Reliability
- Based on the start-times recorded by the data collector, edit the footage into exact, 3 min sessions. The method for timestamping will take 9 min per session.
- Only use up to two trained observers to timestamp the videos.
NOTE:: If two observers are used, the intra-observer variation should be quantified, evaluated, adjusted, and then reported as a Pearson correlation coefficient after the observers have timestamped the same sample video (for methods, see Martin and Bateson25). - Set the playback speed at 1x regular speed (i.e., 30 fps). Do not pause, rewind, or timestamp frame by frame.
- Timestamp each category of mutually exclusive behaviors separately.
- Timestamp spatial behaviors. Restart the video.
- Timestamp structural behaviors. Restart the video.
- Timestamp for structural/nose position behaviors.
- Use the duration of each behavior outcome (see Supplementary Videos 2 and 3) for summarizing data. The duration measurements need to be converted to a percentage of time per category.
6. Approach Index
- Apply the formula (Figure 3) so that each structural and the spatial behavior is combined to create an AI (Figure 3, Figure 4). The AI is used in addition to reporting behaviors and categories separately as figures (Figure 5) or in tabular form.
NOTE: See Table of Materials for software details. Within each category, behavior durations are first converted to percentages (the duration of the behaviors divided by the total duration of the test session). Each behavior is weighted based on the level of approach (Figure 3). Avoidance behaviors (the percentage of time in the far area, resting, with the nose turned away) are multiplied by 0. Moderate-approach behaviors (the percentage of time in the middle area, turned towards the human, and standing with the head still) are multiplied by 1. The greatest level of approach behaviors (the percentage of time in the close and closest area and showing NNOB) are multiplied by 2. Then, each category is further weighted 3, 2, and 1 for spatial, nose orientation, and activity, respectively. A constant (0.10) is applied to create a percentage scale. For example, if the pig faces the human, is in the close/closest area, and performs NNOB during the entire test session, note that the AI is 100% (the red pig in Figure 3). In contrast, if the pig is in the far area, is not facing the human, and remains in the rest position during the entire test session, the AI is 0% (the black pig in Figure 3). Pigs in the close zone can have the same AI as a pig performing NNOB in the mid area if they are turned away from the human and standing with their head still (the orange pigs in Figure 3).
Representative Results
Three housing types (A, B, and C; see Figure 1) were used in three different laboratories for HATs. Structural behavior categories and head and body orientation were used in HATs across all laboratories and experiments as presented in Figure 2. Table 1 represents the data collected from all three housing types and descriptive statistics that were performed using the data obtained from pretreated healthy pigs during the HAT. Next, a formula was developed to calculate an AI from the data obtained during HATs (see Figure 3). The results indicate that the use of an AI reduced variation (Table 1) in the data collected. This is an important finding because less variable data will allow for the use of less experimental animals to detect smaller differences.
For Table 1, descriptive statistics were obtained using the PROC UNIVARIATE procedure (see Table of Materials for specific software information). To compare the outcome of each lab's housing type behavior, the MIXED procedure with a repeated measures model was used. The pig was treated as a random variable. The first-order autoregressive type was selected as the covariance structure. Least square means were separated using the Tukey-Kramer adjustment method. The significance was defined as P ≤ 0.05.
Next, it was determined if the same person or a different human experimenter should be used for every test session of the HAT. To compare the unfamiliar behavior responses to the familiar responses, the MIXED procedure with a repeated measures model was used. The pig was treated as a random variable. The first-order autoregressive type was selected as the covariance structure. Least square means were separated using the Tukey-Kramer adjustment method. The significance was defined as P ≤ 0.05. We found that there was no difference in the AI when a familiar human was used compared to when an unfamiliar human was used during the testing (see data in Table 2). If the pigs never had any adverse interactions with people, they typically generalized and associated all people positively with food26.
The acclimation period for the HAT protocol was determined from the approach indices of the pigs from housing type A (336 test sessions). The HAT started on day 8 after arrival and was performed twice by the familiar human (who spent the previous week handling the pigs) and by an unfamiliar human (who had had no previous contact with the pigs). To determine the effect of time on the outcomes of the HAT, the MIXED procedure with a repeated measures model was used. The pig was treated as a random variable. The first-order autoregressive type was selected as the covariance structure. Least square means were separated using the Tukey-Kramer adjustment method. The significance was defined as P ≤ 0.05. As stated above, the data did not detect a difference between the responses from familiar or unfamiliar human exposure (Table 2). However, the acclimation period was determined based on days 9, 11, and 13 displaying AIs that were significantly lower than all other days. The baseline should include a minimum of three measurements after acclimation, but we recommend six sessions to calculate an AI mean as a covariate in the models.
To determine if HAT methods could distinguish mTBI-treated pigs from sham-treated pigs, HAT data from 12 pigs 1 day before (-1) and 3 days after they were treated with either anesthesia29 only (sham) or anesthesia and blast-wave exposure using a shockwave tube29 to a peak psi of 47.4 ± 13.6 SD for a length of 4.7 ± 0.9 ms SD (blast). The data were analyzed by restricted likelihood ANOVA using the mixed model procedure in a statistical software program. This analysis determined differences between treatment, time, and their interactions. The maximum SEM from the model is reported, and P < 0.05 was considered significant. The AI encompasses all behaviors (Figure 3). On days 1 and 2 after treatment, the AI measure distinguished mTBI pigs from sham pigs (P < 0.05; Figure 4). Behaviors can be analyzed and presented within their mutually exclusive categories (Figure 5). The close spatial behavior measure distinguished blast pigs from sham pigs on days 1 and 2 after treatment (P < 0.05; Figure 5A). Likewise, nose direction, resting time, and NNOB measurements distinguished sham pigs from blast pigs on days 1 and 2 after treatment (Figure 5B and 5C).

Figure 1: Spatial category of behaviors of three different laboratory housing types. The ethogram is set up in relation to the human (footprints), and in relation of pig size to the amount of free space. The greatest level of approach for this category of behaviors is when the pig attempts to climb on the panel closest to the human (Cl; closest or climb). A trained observer timestamps "close" (Co; 0-61 cm from the human), "mid" (M; 61-122 cm from the human), and "far" (F; 123+ cm from the human) when the pig's ears or more are in those spatial areas. Each laboratory pen was set up with one or two bowls for twice-daily feedings, waterer (W), and a toy. (A) Each 50 kg boar was single-housed in 190 cm x 114 cm pens with grated flooring. (B) Each 50 kg boar was housed on a black mat with grated flooring and a drain in the back of the pen. (C) Boars of approximately 10 kg were pair-housed in 274 x 366 cm pens, with concrete flooring, a mat, a drain, and fixed bowls and toys. The color strips (e.g., green and blue) represent the marking strategy. All pigs in the diagram are marked with green or blue patches as examples for marking and identifying pigs on videos. Please click here to view a larger version of this figure.

Figure 2: Structural behavior categories employed in all three laboratories and experiments. (A) For the head orientation category, the pig was facing either towards or away from the human or moving object. (B) For the body orientation category, the pig's head was either down, performing nonnutritive oral behaviors (NNOB); in the upright position, standing or walking, but the head not moving or down; in a resting-state, which includes sitting or lying down. Please click here to view a larger version of this figure.
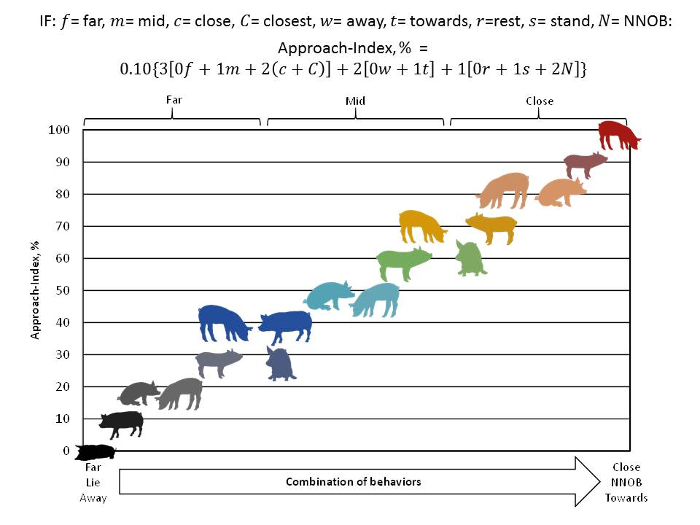
Figure 3: Approach index formula and diagram. The approach index was developed to place all combinations of behaviors on a scale of 0 to 100, with 0 being the pig in the least approach state (in the far section, nose turned away, lying with its head still) and 100 in the close section, nose pointing towards the human, performing NNOB. A software program (see Table of Materials for more information) was used to measure the behaviors so that they aligned linearly. Each pig structure represents a data point that linearly aligns from each category. Within each category, the behavior durations are first converted to percentages (the duration of the behaviors divided by the total duration of test session). Then, each behavior is weighted based on the level of approach. Avoidance behaviors (the percentage of time in the far area, resting, with the nose turned away) are multiplied by 0. Moderate approach behaviors (the percentage of time in the middle area, turned towards the human, and standing with the head still) are multiplied by 1. The greatest level of approach behavior (the percentage of time in the close and closest areas, performing NNOB) is multiplied by 2. Then, each category is further weighted 3, 2, and 1 for spatial, nose orientation, and activity, respectively. A constant (0.10) is applied to scale the data across the full range from 0 to 100 percent. A heat-map-like color scheme is used to represent the pig in the most approach state vs. the pig in the least approach state (black). Please click here to view a larger version of this figure.

Figure 4: Approach index of pigs treated with blast-wave exposure. This figure shows the approach index of pigs 1 day before (-1) and 3 days after they were treated with either anesthesia only (sham, n = 6) or anesthesia and blast-wave exposure to a peak psi of 47.4 ± 13.6 SD for a length of 4.7 ± 0.9 ms SD. The error bars represent SEM. The P-values for treatment = 0.032, for time = 0.033, and for treatment x time = 0.012. The data were analyzed by restricted likelihood ANOVA using the mixed model procedure in a statistical software program. This analysis determined differences between treatment, time, and their interactions. The maximum SEM from the model is reported, and *P < 0.05 is considered significant. Please click here to view a larger version of this figure.

Figure 5: Stacked bar method of displaying behaviors. These panels show a stack-bar method of displaying behaviors for (A) the spatial behavior, (B) the nose direction, and (C) the activity of pigs 1 day before (-1) and 3 days after they were treated with either anesthesia only (sham, n = 6) or anesthesia plus blast-wave exposure to a peak psi of 47.4 ± 13.6 SD for a length of 4.7 ± 0.9 ms SD. Housing type B was used for this experiment. All mutually exclusive behaviors can be represented in each stacked bar chart. (A) The treatment x time P-values for spatial behaviors are far = 0.060, mid = 0.110, *close = 0.014, closest = 0.557; (B) the treatment x time P-values for nose direction are < 0.001*; (C) the treatment x time P-values for the activity are > 0.10; the treatment P-values were rest = *0.046, stand = 0.584, and *NNOB = 0.042. The pooled SEMs were (A) 7.5%, (B) 9.6%, and (C) 9.7%. Each behavioral outcome was analyzed by restricted likelihood ANOVA using the mixed model procedure in a statistical software program (see Table of Materials for the specific program) and, then, were combined in a chart. The analyses determined the differences between treatment, time, and their interactions. The maximum SEM from the model is reported, and *P < 0.05 was considered significant. Please click here to view a larger version of this figure.
| ANOVA stats for across housing types | Descriptive stats for all healthy pig data | No. experimental Units | |||||||||||||||||||
| Housing Type | P- | No. | Quantiles, % | to detect Δ% from control1 | |||||||||||||||||
| A | B | C | SEM | values | Obs. | μ | SD | CV% | SEM | Min | 25 | 50 | 75 | Max | 25 | 50 | 75 | 100 | 200 | ||
| Approach-Index, % | 75.4 | 69.2 | 76.6 | 5.5 | 0.318 | 288 | 74 | 17 | 23 | 1 | 0 | 70 | 80 | 84 | 99 | 18 | 4 | 3 | 3 | 3 | |
| Pen location duration, % | |||||||||||||||||||||
| Far | 8.5a | 5.3a | 23.0b | 4.8 | 0.008 | 288 | 10 | 20 | 200.1 | 1.2 | 0 | 0 | 0 | 10 | 100 | -- | 336 | 149 | 84 | 21 | |
| Mid | 18.9 | 46 | 13.75 | 16.2 | 0.066 | 288 | 23 | 29 | 125 | 1.7 | 0 | 2 | 10 | 32 | 100 | 526 | 131 | 58 | 33 | 8 | |
| Close | 72.4a | 43.9b | 62.4a | 12.8 | 0.032 | 288 | 23 | 29 | 123.9 | 1.7 | 0 | 47 | 78 | 93 | 100 | 509 | 127 | 57 | 32 | 8 | |
| Closest (climb) | 0 | 8.9 | 0 | 3.1 | 0.001 | 288 | 67 | 32 | 47.8 | 1.9 | 0 | 46 | 80 | 95 | 100 | 74 | 19 | 8 | 5 | 3 | |
| Close + Closest | 72.5 | 53 | 62.3 | 14.9 | 0.311 | 288 | 68 | 32 | 46.6 | 1.9 | 0 | 46 | 78 | 93 | 100 | 74 | 19 | 8 | 5 | 3 | |
| Activity duration, % | |||||||||||||||||||||
| Lie/sit with head still | 5.6a | 0.0b | 17.0c | 1.8 | 0.001 | 288 | 1.3 | 5 | 393.7 | 0.3 | 0 | 1 | 3 | 7 | 59 | -- | -- | 579 | 326 | 82 | |
| Stand/walk with head still | 48.3a | 63.6a,b | 83.5b | 10 | 0.006 | 288 | 52 | 43 | 82.1 | 2.5 | 1 | 7 | 47 | 100 | 100 | 226 | 57 | 25 | 14 | 4 | |
| NNOB | 81.5 | 57.7 | 71.1 | 13.3 | 0.109 | 288 | 77 | 28 | 36.4 | 1.7 | 0 | 66 | 91 | 98 | 100 | 44 | 11 | 5 | 3 | 3 | |
| Head direction, duration, % | |||||||||||||||||||||
| Away | 24.7a | 17.4a | 50.7b | 4.5 | 0.001 | 288 | 26 | 21 | 79.3 | 1.2 | 0 | 10 | 22 | 39 | 92 | 212 | 53 | 24 | 13 | 3 | |
| Towards | 75.3 a | 82.6 a | 49.3 b | 4.5 | 0.001 | 288 | 74 | 21 | 27.8 | 1.2 | 8 | 62 | 79 | 90 | 100 | 26 | 6 | 3 | 3 | 3 | |
Table 1: Baseline HAT measurements were examined for all housing types to create this data set. Behavior outcomes were analyzed by restricted likelihood ANOVA using the MIXED procedure of a statistical analysis software. These analyses determined the differences between the behavior duration and approach index of each laboratory housing type. The maximum SEM from the model is reported, and P < 0.05 was considered significant. In addition, the UNIVARIATE procedure of the statistical analysis software was used for descriptive statistics. The confidence value (CV) % was then entered into an experimental unit calculator27 and the conditions for the expected differences between two treatments were examined.
| Treatment | P-Values | |||||
| Familiar | Unfamiliar | SEM | TRT | Time | TRT*Time | |
| Approach-Index, % | 84.8 | 84.4 | 3.06 | 0.766 | 0.002 | 0.661 |
| Pen location duration, % | ||||||
| Far | 10.7 | 10.1 | 3.49 | 0.844 | 0.008 | 0.522 |
| Mid | 18.7 | 17.6 | 3.38 | 0.717 | 0.014 | 0.918 |
| Close | 70.4 | 72.3 | 5.25 | 0.617 | <0.001 | 0.895 |
| Activity duration, % | ||||||
| Lie or sit, No NNOB | 5.8 | 5.8 | 0.8 | 0.995 | <0.001 | 0.901 |
| Stand or walk, no NNOB | 5.5 | 5.5 | 1.4 | 0.995 | <0.001 | 0.524 |
| NNOB | 82.1 | 83.3 | 4.12 | 0.722 | 0.0029 | 0.617 |
| Head direction, duration, % | ||||||
| Away | 23.9 | 23 | 2.81 | 0.725 | <0.001 | 0.329 |
| Towards | 76.1 | 77 | 2.8 | 0.725 | <0.001 | 0.329 |
Table 2: An experiment was performed on seven pigs from housing type A. Two sessions were performed each day. For each session, one familiar (female) or one of seven (three males and four females) unfamiliar humans was used in HATs. The same familiar person went first, and seven unfamiliar people were used. An ANOVA model for statistical analysis software was examined for treatment (familiar or unfamiliar), time (day), and their interactions.
Supplementary Video 1: Observer software set-up with subtitles. Please click here to download this file.
Supplementary Video 2: Data export with subtitles. Please click here to download this file.
Supplementary Video 3: Data analysis with subtitles. Please click here to download this file.
Supplementary File 1: Example data collection sheet. Please click here to download this file.
Discussion
Mild injuries to the brain that do not result in overt anatomical and structural changes detectable with state-of-the-art imaging can be difficult to identify and treat28. However, patients with mTBI are especially vulnerable to additional insult that can cause significant damage to the brain, and therefore, it is important for this population to be identified. Behavioral tests developed in a mini-pig model of mTBI are especially relevant to human mTBI patients because pigs have a similar physiology as humans and express similar affective states, such as anhedonia8,9,10,20. Here, we have developed a noninvasive, in-pen behavioral test (the HAT), and have shown that it is sensitive enough to distinguish mTBI pigs from sham pigs. In addition, a weighted index (the AI) was developed for behaviors observed during the HAT that are ubiquitous across housing and pig types.
Modifications and Troubleshooting:
The methodologies for the HAT were established based on ethology guidelines25 and several trial-and-error strategies for improving the reliability, repeatability, and validity of the test6. Reliability measures helped identify the strengths and limitations of the test. Reliability defines the extent to which the measurement is repeatable and consistent and free from random errors28,29. We have previously reported on the intra- and interobserver reliability of the HAT, and with the additional structural ethograms, reliabilities are similarly high (Pearson's R2 > 0.90) for duration6. Frequency and latency measures require trained observers, whereas duration measures are less observer-dependent, and therefore, more reliable across laboratories30.
Reliability within a laboratory and repeatability across laboratories is dependent on methods. In our laboratory, the video system recorded continuously, the files were initially stored as 5-minute files, and some HAT sessions occurred over two files. Fewer mistakes were made when the exact time from the data sheet was used to clip and combine the videos. Before developing the ethogram, observers were allowed to pause, stop, and rewind the video footage to timestamp all of the behaviors in the entire ethogram. This method not only caused variation in timestamping each sample, ranging from 3 min to 20 min, but the between- and within-observer reliability was also poor for most behaviors. Therefore, we set the playback speed, and had observers timestamp each category at a time. Therefore, when reliability was low in just one category, observers independently retimestamped just the category rather than the entire ethogram, after they consulted the definitions and footage together. The set playback and category methods allowed for a consistent prediction of how much time was needed to timestamp each sample. For projects that span longer than a month, routine reviewing of the coded videos and within-observer reliability is important to measure.
Another factor that reduces reliability and repeatability is the video set-up. Initially, a handheld camera and a tripod were used, which were moved from pen to pen. When this method was used, the pigs needed to be introduced to the tripod and camera before the HAT; otherwise, the pigs appeared to react to the tripod and movement more than to the test-human. In addition, nonoverhead camera angles limited the observer's view during timestamping and the depth perception of space increased the within- and between-observer variation in the spatial behavior measures; therefore, we developed the protocol with fixed cameras. When this method is used, extra care is needed to make sure the camera is placed correctly before each test, and more time is needed for the set-up in between each pig's session. However, we learned that the continuous video overhead system needed to start its initial recording at midnight at least 24 h before the first HAT. The timestamp display for many video systems are not accurate and in sync down to the frame; therefore, we no longer rely on the display times. The midnight starts allowed for the exact frame-capturing and video editing, and the timestamp display was not used.
In addition, the acclimation of the pigs and setting up a routine was important when troubleshooting this test. In footage of pigs that were not well acclimated to their environments, pacing was observed during the HAT. This is an indicator that the pig may be in an agitated state31 rather than in an exploratory state32. Acclimation periods of three or more weeks may reduce the number of pigs that pace in an experiment. However, if pacing persists throughout all the sampling periods, this ethogram may need to be adjusted to include walks and standing still.
Validity is the extent to which a measurement represents the intended scope of the question being asked25. When first developing the HAT, we used only a spatial ethogram. Definitions of spatial ethogram behavior describe accurately and specifically the proximity to the human subjects and they tell the observer directly how much space the pig leaves between itself and a human. However, once these methods are needed to be applied to a new laboratory set-up, we recognized that spatial ethograms are laboratory specific. Pen dimensions and the placement of other objects influence the outcome of the spatial ethogram; therefore, a diagram with measurements and specifics of the pen will need to be published if the pen set-up has not been previously reported. In addition to reporting on the pen environment, the structural behaviors were added to the ethogram. Unlike spatial behaviors, structural behaviors can be evaluated more easily across laboratories; these behaviors have validity because they specifically describe the pig's level of active state. When a pig is resting, it is likely not motivated to approach and is unable to change positions to approach as quickly as a standing pig. Similarly, a pig displaying NNOB is in an exploratory state, but a pig with its head still while standing is more likely in a catatonic state. The nose orientation helps with validity because the nose, ears, and then eyes are what the pig uses to gather information about the human.
Limitations of the Technique:
A potential concern with this technique is the variability in the pigs' responses to the test-human. In addition, pigs will look at the test-human's hands, which can cause unintentional cueing by that person. Therefore, these limitations were expressed through the experimentally testing of 1) the pigs' responses to a familiar human and unfamiliar humans, and 2) standardizing that, after the pellet is dropped, the test-human stands still and places their hands out of the pig's sight. Data showed that there were no treatment or treatment x time differences during the HAT (Table 2), suggesting that the HAT could be administered by either familiar or unfamiliar humans. Other researchers suggest that pigs tend to generalize about humans based on previous interactions11,12,13; therefore, a pig's previous experiences with humans need to be positive. This challenge can also be remedied with a vigilant experimental design; for each block, a sufficient number of experimental units represented for each treatment of interest is needed.
In this study, although there were only two experienced observers timestamping all the videos for all three housing types, there were differences among the housing types for specific behavior outcomes (Table 1). For example, pigs in housing type B entered the closest area more often than those in housing types A and C. This is likely due to a difference in the pen material; in housing type B, the front of the pen was a chain-linked gate with horizontal bars that allowed the pig to climb the gate during the HAT. Housing types A and C, on the other hand, had vertical bars and fewer horizontal surfaces for the pigs to climb on. This variability can be remedied by adding the duration spend in the close and closest areas before comparing them across housing types (Table 1; P > 0.10). However, pigs in housing type C spent more time in the far area than those in housing types A and B (Table 1; P < 0.05), which was likely due to the placement of waterers in the back of the pen rather than at the front of the pen. This is a limitation that can be remedied if laboratories choose to standardize the placement of waterers, bowls, and toys and make sure that they are fixed so that the pig does not move the object into another area.
This test has great accessibility for laboratories of all types, but, as mentioned previously, the manually stamped spatial ethogram and measurements will vary more across laboratories. Nonetheless, the body- and head-structural ethograms are ubiquitous. Laboratories that have access to validated, automated tracking for pigs may benefit by having the spatial ethogram tracked automatically rather than manually because the distance moved and the rate of movement may be additional outcomes of behavior measures from the HAT. The limitations from the in-pen set-up and traditional technologies rather than test areas and automatic tracking technologies may be remedied by adapting the AI formula. The AI provides standardized measurements and terminology for how individual pigs use their pen space and express interest in a human. This calculation, derived from common behavior measures, is sensitive to porcine models of subconcussive mTBI and, possibly, other states of subclinical injury or sickness. In addition, the AI reduces random variations during experimentation and may be more easily compared across experiments and laboratories than methods that rely on more experiment-specific measurements. The structural behaviors provided the foundation for this formula, because these behaviors are standard measurements across treatments, whereas the spatial behaviors are dependent on the pen set-up, number of pigs in a pen, and tracking system. For example, we observed that when two healthy pigs are tested in a pen, they will perform similar spatial behaviors by approaching together, but the pig that follows the first may orient its nose more towards its pen mate than towards the human and express more NNOB, because the pig who leads serves as the sentinel. Nonetheless, the AI aids in reducing this variation even from paired behaviors.
Although the AI is an excellent toolset for standardizing the test across laboratories, researchers may still want to examine test-specific behavior outcomes within a laboratory or experiment, especially if they have enough power (i.e., experimental units and repeated tests) in a single experiment. Therefore, Table 1, containing all behavior outcomes, the variance, the distribution, and a calculated test for the number of animals for each specific behavior, was included here. For example, if researchers have pen environments that allow pigs to consistently climb during the HAT and they know their treatment causes over a 75% difference in climbing behaviors, then they can justify animal numbers based on the variance measured. If new behaviors are added to the ethogram, scientists will need to justify which behaviors are indicative of approach or withdrawal before incorporating them into the index. For example, if most of the animals within an experiment pace along the walls of the pen (i.e., thigmotaxis)32, the duration of this behavior could be incorporated into the body-structural ethogram category. The behavior could be represented in the detailed stacked bar graph (i.e., Figure 5) or tabular form, and then, it can be summed up with stand-still before applying the index calculation. The AI, therefore, can represent behaviors that are ubiquitous across laboratories, but additional unique behaviors can still be represented separately.
Significance with Respect to Existing Methods:
The existing methods for the HAT were established for pigs on commercial farms to assess animal welfare. Here, a protocol for laboratory pigs has been established, which can help researchers to assess animal welfare and distinguish mTBI pigs from sham-treated pigs. An alternative traditional test could be to use an open-field test. This test was previously used to assess pig emotionality and welfare33. Open-field tests were originally designed for testing the affective states of rodents by measuring their natural aversion to open space and light. In contrast, healthy pigs may view the same stimuli as appetitive10, and after a sickness, injury, or stress treatment, they likely express fear. This test requires more laboratory space and will require pigs to acclimate to being handled and placed in an open-field arena. If laboratories have space and protocols for handling the pigs are in place, repeated HAT sessions, in addition to one open-field test, may help further distinguish treated animals from sham-treated animals.
Critical Steps Within the Protocol:
The first three steps in the protocol are the most critical for successful HAT measures. The sessions per pig only take 3 min; however, adequate preparation will help make this test reliable. As stated above, the camera location and recording set-up is crucial for clarity and replication. Improper camera angles can limit the observer's vision, which will add errors to the measurements. Another often overlooked step is fixing the objects in the pen. The pig will move unfixed objects, and this may affect its motivation to approach the human. The set-up and managing system are important because pigs need to be acclimated to their environments before they can perform the test consistently. Pigs that are not well-acclimated to their home pens or routine or are experiencing stress will defecate in other areas rather than at the back of the pen34. The defecation area may affect their motivation to approach. From the camera view, the observer should be able to identify individual pigs; however, it is important that the marking scheme does not provided information about the animal's treatment, as this will bias the observer25.
Identifying pigs is very important for obtaining the correct behavioral data for the right pig, even when they are single-housed. Pigs are often moved for their treatments, and a marking reinsures the observer that they are watching the same pig after it has been removed and placed back in its pen. Pigs can be housed in pairs, as in housing type C, and therefore, it becomes very important to identify the pigs. Livestock marking paints and markers require daily application; therefore, this protocol requires the use of a medical grade tape and a smear of tag cement. The tape sticks best to pigs with longer hair. Pigs with short hair and dry skin will slough off the tape more often than pigs with longer hair.
Future Applications:
In summary, the noninvasive in-pen HAT test described here is sensitive enough to detect mild and temporal dependent changes in pigs after mTBI. Moreover, we have developed a weighted index called the AI to evaluate changes in pigs housed in different pen types, as well as in different types of pig. Although the HAT has been used to detect changes in pigs exposed to mTBI, this behavioral test can be useful for detecting measurable behavioral changes in animals experiencing stress or prepathological conditions.
Disclosures
The authors have nothing to disclose.
Acknowledgments
The authors would like to acknowledge funding from the Office of Naval Research (Grant #12166253). In addition, the authors kindly thank the animal care staff, veterinarians, and students at Kansas State University and Virginia Tech for their support during the animal work. The authors would also like to thank Nadège Krebs for her technical assistance, and students Shelby Stair, Sarah Greenway, and Mikayla Goering for their technical assistance and additional animal care.
Materials
| Name | Company | Catalog Number | Comments |
| Dome 3.0 Megapixel Cameras with 2.8-12 mm lens set between 2.8-3.2 mm | Points North Surveillance, Auburn, ME | CDL7233S | Lower mm lenses are needed for low-profile pens |
| Manfrotto 244 friction arm kit | B&H Photo | B&H # MA244; MFR # 244 | To mount and secure cameras at a 90° angle |
| Video Recording System | Points North Surveillance, Auburn, ME | NVR-RACK64 | NVR is customized |
| Colored and patterned duct tape attached to a double-sided medical grade tape | MBK Tape Solutions, Chatsworth, CA | 3M 1522H | Sustainable marking of pigs |
| Approach Index Formula generator | Dinasym, Manhattan, KS | Approach Formula | Company will customize macros for specific lab needs |
| Geovision Software | Points North Surveillance, Auburn, ME | Geovision | Software to edit video time into 180 s clips |
| Clicker | Petco | Good2Go Dog Training Clicker | |
| Reward treat (feed pellet, carob chip, raisin, marshmallow) | Variable | N/A | Depending on previous exposure, adult pigs are very neophobic when new food is introduced. Limit-fed pigs can be fed a few pellets of feed. |
| Statistical Analysis System (SAS) | SAS Institute, Cary, North Carolina | SAS 9.0 | Our laboratories preference for analyzing mixed models and repeated measures |
| Observer 11.5 software | Noldus Information Technology, Leesburg, VA | Observer 11.5 | Software to manually timestamp video clips |
References
- Iverson, G. L. Outcome from mild traumatic brain injury. Current Opinion in Psychiatry. 18 (3), 301-317 (2005).
- Taber, K. H., Warden, D. L., Hurley, R. A. Blast-related traumatic brain injury: what is known? The Journal of Neuropsychiatry and Clinical Neurosciences. 18 (2), 141-145 (2006).
- White, H., Venkatesh, B. Traumatic brain injury. Oxford Textbook of Neurocritical Care. Smith, M., Kofke, W. A., Citerio, G. 210, University Press. Oxford. (2016).
- Greve, K. W., et al. Personality and neurocognitive correlates of impulsive aggression in long-term survivors of severe traumatic brain injury. Brain Injury Journal. 15 (3), 255-262 (2001).
- Janusz, J. A., Kirkwood, M. W., Yeates, K. O., Taylor, H. G. Social Problem-Solving Skills in Children with Traumatic Brain Injury: Long-Term Outcomes and Prediction of Social Competence. Child Neuropsychology. 8 (3), 179-194 (2002).
- Luo, Y. Swine Applied Ethology Methods for a Model of Mild Traumatic Brain Injury (Master's Thesis). , Available from: http://hdl.handle.net/2097/35760 (2017).
- Kornum, B. R., Knudsen, G. M. Cognitive testing of pigs (Sus scrofa) in translational biobehavioral research. Neuroscience & Behavioral Reviews. 35 (3), 437-451 (2011).
- Bauman, R. A., et al. An Introductory Characterization of a Combat-Casualty-Care Relevant Swine Model of Closed Head Injury Resulting from Exposure to Explosive Blast. Journal of Neurotrauma. 26, 841-860 (2009).
- Friess, S., et al. Repeated traumatic brain injury affects composite cognitive function in piglets. Journal of Neurotrauma. 26, 1111-1121 (2009).
- Xiong, Y. A., Mahmood, A., Chopp, M. Animal models of traumatic brain injury. Nature Reviews Neuroscience. 14 (2), 128-142 (2013).
- Waiblinger, S., et al. Assessing the human-animal relationship in farmed species: A critical review. Applied Animal Behavior and Science. 101, 185-242 (2006).
- Powell, C., Hemsworth, L. M., Rice, M., Hemsworth, P. H. Comparison of methods to assess fear of humans in commercial breeding gilts and sows. Applied Animal Behavior and Science. 181, 70-75 (2016).
- Hemsworth, P. H., Barnett, J. L., Coleman, G. J., Hansen, C. A study of the relationships between the attitudinal and behavioural profiles of stockpersons and the level of fear of humans and reproductive performance of commercial pigs. Applied Animal Behaviour Science. 23, 301-314 (1989).
- Hulbert, L. E., McGlone, J. J. Evaluation of drop versus trickle-feeding systems for crated or group-penned gestating sows. Journal of Animal Science. 84 (4), 1004-1014 (2006).
- Mills, D. S., Marchant-Forde, J. N. The encyclopedia of applied animal behavior and welfare. , CAB International. Wallingford, UK. (2010).
- Backus, B. L., Sutherland, M. A., Brooks, T. A. Relationship between environmental enrichment and the response to novelty in laboratory-housed pigs. Journal of the American Association for Laboratory Animal Science. 56 (6), 735-741 (2017).
- Price, E. O. Behavioral development in animals undergoing domestication. Applied Animal Behavior Science. 65 (3), 245-271 (1999).
- Plogmann, D., Kruska, D. Volumetric comparison of auditory structures in the brains of European wild boars (Sus scrofa) and domestic pigs (Sus scrofa f. dom.). Brain, Behavior and Evolution. 35 (3), 146-155 (1990).
- Horbak, K. Nosing Around: Play in Pigs. Animal Behavior and Cognition. 1 (2), 186-196 (2014).
- Daigle, C. Parallels between Postpartum Disorders in Humans and Preweaning Piglet Mortality in Sows. Animals. 8 (2), 22 (2018).
- Willner, P., Muscat, R., Papp, M. Chronic mild stress-induced anhedonia: A realistic animal model of depression. Neuroscience & Biobehavioral Reviews. 16 (4), 525-534 (1992).
- Pairis, M., Young, A., Millman, S. T., Garvey, J., Johnson, A. K. Can Fear Be Effectively Assessed in Swine? A Study Measuring Fear Levels during a Human Approach Test. Animal Industry Report. , AS 655, ASL R2470 (2009).
- Grandin, T. Behavioral principles of livestock handling. American registry of Professional Animal Scientist. , 1-11 (2002).
- Weeks, C. A. A review of welfare in cattle, sheep and pig lairages, with emphasis on stocking rates, ventilation and noise. Animal Welfare. (South Mimms, England). 17, 275-284 (2008).
- Martin, P., Bateson, P. How Good are Your Measures. Measuring Behaviour: An Introductory Guide. Martin, P., Bateson, P. , University Press. Cambridge. 72-85 (2007).
- Grandin, T., Shivley, C. How Farm animals react and perceive stressful situations such as handling, restraint, and transport. Animals. 5, 1233-1251 (2015).
- Galyean, M. Sample size calculations I. , Available from: https://www.depts.ttu.edu/afs/home/mgalyean/ (2018).
- Shenton, M. E., et al. A review of magnetic resonance imaging and diffusion tensor imaging findings in mild traumatic brain injury. Brain Imaging and Behavior. 6 (2), 137-192 (2012).
- Walilko, T., VandeVord, P., Hulbert, L. E., Fievisohn, E., Zai, L. Establishing a neurological injury threshold using a blast overpressure model in minipigs. Military Health System Research Symposium. , (2017).
- Coffin, M. J., et al. Side Bias and Time of Day Influenced Cognition after Minipigs were Conditioned Using a Novel Tactile Stimulation Device. Journal of Animal Science. 96, 255-256 (2018).
- Dailey, J. W. Stereotypic Behavior in Pregnant Swine (Master's Thesis). , Available from: https://ttu-ir.tdl.org/ttu-ir/handle/2346/9669 (1995).
- Fleming, S. A., Dilger, R. N. Young pigs exhibit differential exploratory behavior during novelty preference tasks in response to age, sex and delay. Behavioural Brain Research. 321, 50-60 (2017).
- Ramona, D. D., Healy, S. D., Lawrence, A. B., Rutherford, K. M. D. Emotionality in growing pigs: Is the open field a valid test. Physiology & Behavior. 104, 906-913 (2011).
- Matthews, S. G., Miller, A. L., Clapp, J., Plötz, T., Kyriazakis, I. Early detection of health and welfare compromises through automated detection of behavioral changes in pigs. The Veterinary Journal. 217, 43-51 (2016).
