Structured protocols are necessary to provide answers on research questions in critically ill patients. The Simple Intensive Care Studies (SICS) provides an infrastructure for repeated measurements in critically ill patients including clinical examination, biochemical analysis and ultrasonography. SICS projects have specific focus but the structure is flexible to other investigations.
Method Article
Observational Study Protocol for Repeated Clinical Examination and Critical Care Ultrasonography Within the Simple Intensive Care Studies
In This Article
Summary
Abstract
Longitudinal evaluations of critically ill patients by combinations of clinical examination, biochemical analysis and critical care ultrasonography (CCUS) may detect adverse events of interventions such as fluid overload at an early stage. The Simple Intensive Care Studies (SICS) is a research line that focuses on the prognostic and diagnostic value of combinations of clinical variables.
The SICS-I specifically focused on the use of clinical variables obtained within 24 h of acute admission for prediction of cardiac output (CO) and mortality. Its sequel, SICS-II, focuses on repeated evaluations during ICU admission. The first clinical examination by trained researchers is performed within 3 h after admission consisting of physical examination and educated guessing. The second clinical examination is performed within 24 h after admission and includes physical examination and educated guessing, biochemical analysis and CCUS assessments of heart, lungs, inferior vena cava (IVC) and kidney. This evaluation is repeated at days 3 and 5 after admission. CCUS images are validated by an independent expert, and all data is registered in an online secured database. Follow-up at 90 days includes registration of complications and survival status according to patient's medical charts and the municipal person registry. The primary focus of SICS-II is the association between venous congestion and organ dysfunction.
The purpose of publishing this protocol is to provide details on the structure and methods of this on-going prospective observational cohort study allowing answering multiple research questions. The design of the data collection of combined clinical examination and CCUS assessments in critically ill patients are explicated. The SICS-II is open for other centers to participate and is open for other research questions that can be answered with our data.
Introduction
Patients admitted to the Intensive Care Unit (ICU) are the most critically ill with high rates of co- and multi-morbidities, independent of their admission diagnosis. Therefore, the ICU is the setting to investigate co- and multi-morbidity, their negative impact on patient outcomes, and how critical illness may lead to complications that contribute to additional multi-morbidities. To gain insight in this heterogeneous patient group detailed examination of each individual patient is of utmost interest.
The Simple Intensive Care Studies (SICS) research line is designed with the goal of evaluating the prognostic and diagnostic value of a comprehensive selection of clinical, hemodynamic and biochemical variables in ICU patients collected by a dedicated team of student-researchers coordinated by medical experts. One of the primary objectives of the SICS-I is to investigate the combination of clinical examination findings best associated with shock defined by cardiac output (CO) measured by critical care ultrasonography (CCUS)1. The SICS-II uses the structure of the SICS-I but adds repeated clinical examination, biochemical analysis and CCUS. The primary focus of SICS-II is to quantify venous congestion and identify variables that may contribute to its development. Repeated measurements provide dynamic information on the course of a patient's illness. Studies show that fluid overload is present in critically ill patients and fluid overload is associated with new morbidities. We thus focus on venous congestion in these patients. Moreover, several studies have suggested the possible negative effects of excessive fluid administration2,3,4,5,6. Fluid overload can be perceived as venous congestion or venous fluid overload, which may be observed by an increased central venous pressure (CVP) or peripheral edema. Elevated pressure in the central venous system may contribute to reduced organ perfusion followed by organ failure, but no exact definition of venous congestion exists.
Previous studies that suggested negative effects associated with excessive fluid administration used single surrogate measurements of venous congestion such as CVP, IVC collapsibility, fluid balance and/or peripheral edema7,8,9,10. To the best of our knowledge, the SICS-II is the first study to perform repeated CCUS of multiple organs combined with findings from clinical examination to assess the hemodynamic status of ICU patients. The focus on this multi-organ ultrasonography technique is important as organ failure or diminished organ function always influences the entire hemodynamic system. We expect that data from repeated examinations in SICS-II will help to unravel the pathophysiology and consequences of venous congestion. Consequently, this may help to improve earlier identification of critically ill patients at risk of venous congestion and guide the optimization of fluid administration. Additionally, the association between venous congestion and short- and long-term organ failure can be explored. Finally, the successful implementation of the SICS-II protocol would make evident that carrying out a large prospective study with a dedicated team of student-researchers is feasible and can yield quality data to investigate clinical problems.
Here, the procedure to perform comprehensive clinical examination of ICU patients with the goal of measuring venous congestion is demonstrated. A concise protocol of SICS-II was published on clinicaltrials.gov11. After the first initial clinical examination, a maximum of three additional clinical examinations, biochemical analyses and CCUS are conducted. Physical examination comprises of variables which reflect peripheral perfusion/microcirculation such as capillary refill time (CRT) or mottling as well as variables of the macrocirculation such as blood pressure, heart rate and urine output. Also, standard care laboratory values are registered (e.g., lactate, pH). Subsequently, CCUS of the heart, lungs, IVC and kidney is performed to obtain information on perfusion. Further methods will be elaborated within our statistical analysis plan, as was done in the SICS-I12.
Based on 138 patients included between 14-05-2018 and 15-08-2018, repeated measurements of a broad array of clinical variables within this structure seem feasible. We also show that independent validation is feasible. The SICS-II exemplifies a valuable methodology for enabling researchers to accurately register changes in variables of interest and can thus act as a guide to conducting research that reflects the progression in patients' condition as seen in daily practice. The SICS-II study is carried out daily by a team of 2-3 student-researchers at all times, with a senior supervisor available on call. These student-researchers are trained in performing the physical examination and CCUS. They execute all the steps of the following protocol and are responsible for patient inclusion both during working hours and in the weekends. In addition, a larger ICU student team of around 30 students participate in evening and night shifts, to conduct the initial clinical examination (within 3 h of admittance) of new patients. Figure 1 presents a schematic summary of the study protocol, and Figure 2 and 3 display the Case Report Forms (CRF) used to register data upon collection.
Protocol
This study is conducted according to the principles of the Declaration of Helsinki (64th version, Brazil 2013) and in accordance with the Medical Research Involving Human Subjects Act (WMO), the guidelines of Good Clinical Practice, and the local institutional review board (Medisch Ethische Toetsingscommissie; M18.228393).
1. Patient Admission to ICU and Screening
NOTE: For screening, a digital list with minimum patient data is updated throughout the day, and inclusions and exclusions are registered. The screening list is stored in the secured hospital electronic system with exclusive access for researchers. To protect patient privacy, all physical copies of the lists are destroyed at the end of the day. Inclusion criteria are: acute and unplanned admission; and patients above the age of 18.
- Screen the patient management system for all new admissions and check whether patients meet the inclusion criteria.
- Immediately exclude readmissions, elective admissions, patients younger than 18 years of age, and those who will not be able to give informed consent.
NOTE: We also exclude patients with a non-trauma neurological admission reason as we have established multiple patient groups in SICS-I, in which this group was hemodynamically stable and ICU admission concerned mainly neurological treatment1. - Add the possible inclusions to a continuously updated patient list. Use this list to plan new and repeated measurements daily based on the time of admission/inclusion.
2. Clinical Examination 1
NOTE: The first clinical examination is conducted in all patients who fulfill the inclusion criteria within 3 h after admission. This examination is performed by the student-researchers if the patient is admitted during the day shift. For patients admitted during the evening or night shifts, this first clinical examination is conducted by a member of the ICU student team and data are processed and finalized the next day by the student-researchers. For a full description of the protocol of the first clinical examination, see clinicaltrials.gov13. At the bedside, if possible, patients are asked if they consent to the clinical examination at that moment. Written informed consent is obtained later on: see Step 1.2 for instructions and Step 7 .
- Physical examination
- Start by ensuring the required safety/isolation rules for the patient: disinfect hands and wrists following standard hospital procedures with 70% alcohol and use non-sterile gloves and a plastic apron or additional precautions such as an isolation gown during patient contact.
- Introduce yourself and ask the patient for permission to conduct the examination if they are not sedated, conscious and adequate. Explain to the patient what is being done.
NOTE: Formal informed consent is requested at a later stage during ICU admission or after discharge to the ward, either from the patient themselves or from the next of kin if the patient is unable. This is described in further detail in Step 7. - Register the hemodynamic variables heart rate, respiratory rate, systolic blood pressure (SBP), diastolic blood pressure (DBP), mean arterial pressure (MAP), and central venous pressure (CVP) from the bedside monitor.
- Register the oxygen saturation (SpO2) and whether the patient receives non-invasive respiratory support or is mechanically ventilated. If so, register the positive end expiratory pressure (PEEP) and the fraction of inspired O2 (FiO2).
- Determine reperfusion of the knee and sternum by pressing 10 s on the skin and letting go, then counting the number of seconds until full reperfusion.
- Determine the subjective skin temperature by palpating the extremities with the hands and estimate if they are cold or warm.
- Record the bladder temperature from the monitor, which shows the temperature measured by a sensor attached to an indwelling urinary catheter.
- Determine the skin temperature on the dorsum of the foot by placing an additional temperature sensor on the middle of the dorsum and connecting it to the monitor. Reconnect the bladder temperature sensor to the monitor after this measurement.
- Score the degree of mottling if observable by using the Ait-Oufella knee scale14.
- Register whether the patient receives sedation and, if yes, which drug, at what pump speed, and in which dosage.
- Determine and register the patient's Glasgow Coma Scale (GCS)15.
- Estimate the patient's survival in hospital, 6 months survival and ability to return to their original residence based on an educated guess and the results from this clinical examination16,17. Ask the nurse and physician for their estimations as well and register all estimations on the CRF.
3. Clinical Examination 2
NOTE: The second clinical examination is conducted within 24 hours after admission and includes CCUS measurements. This examination is always conducted by student-researchers trained in CCUS, and not by members of the ICU student team. In addition, in patients who meet the inclusion criteria and got clinical examination 1 but are shown later to suffer exclusively from a neurological condition (e.g., non-traumatic subarachnoid hemorrhage), repeated measurements including CCUS are not performed, and these are ultimately excluded.
- Obtain informed consent.
NOTE: Under University Medical Centre Groningen (UMCG) regulations for observational measurements, per 1st of January 2016, the ultrasound images collected during clinical examination can be used without expressed consent. However, it is policy of the SICS-II study to seek informed consent from patients at the earliest possible moment while simultaneously upholding the principles of minimizing "stress" to the patient, increase shared decision making, and giving the patient enough time to consider participation. Since most patients are unable to provide consent early in their ICU stay, "delayed" consent is usually obtained. If, conversely, they are able to provide or refuse consent before or after the examinations, these will either not be carried out or all already obtained data is deleted, respectively.- Before starting the examination, determine if the patient is alert/conscious and able to engage with the student-researchers by determining their GCS score. Provide capable patients with an explanation regarding the examination to be conducted, and leave a standardized, written letter which they must sign.
- Should the patient not be able to be consulted for consent (due to impaired consciousness, limited mental capacity, etc.), monitor their GCS score daily and consider obtaining family consent if family members are reachable (as described in Step 7.1).
- Perform the physical examination following the steps described for Clinical Examination 1.
- Perform CCUS of the heart and the lungs.
NOTE: This protocol is valid when using an ultrasound machine in the Table of Materials, the cardiac transducer for the parasternal long axis view (PLAX), and the cardiac phased array transducer for the apical four and five chamber views (AP4CH, AP5CH). For other ultrasound systems, users should consult the operating manuals of their specific device.- Turn on the machine. Register the patient's anonymous study ID, start a new exam, and wait for the automatic 2D imaging mode to be displayed on the screen.
- If the patient is clothed, unbutton their gown to expose the chest. Place new electrocardiogram (ECG) stickers and connect them to the ultrasound machine if necessary.
- Connect the ECG cable from the machine to the patient's bedside monitor. Wait for it to stabilize and register the heart rate measured by ECG in the CRF.
- When possible, position the patient slightly rotated on their left side. This improves the quality of both cardiac and kidney imaging.
NOTE: Technical Considerations: Before starting the examination, click the Configure button, and set the image settings to five heart cycles, a depth of 10–15 cm, an image width of 65°, and a frequency of 1.7/3.4 MHz. Check if the correct probe is selected by clicking the Probe button. - Put a sufficient amount of ultrasound gel on the ultrasound transducer and place the transducer on the lateral left of the sternum, between the 3rd and 5th intercostal spaces, to obtain the PLAX view in the 2D mode. Adjust the depth as needed to record images for the left ventricular outflow tract measurements and save the image.
NOTE: The maximal width of the left ventricle should be visible with a maximal opening of the mitral valve. No muscle of the valve should be visible. Before placing the transducer on the patient's chest, warn them that the gel is cold and can feel uncomfortable, and that they will feel some pressure (especially around the sternum when recording images for the left ventricular outflow tract (LVOT). Be aware in patients that have costal fractures some places should be avoided as this may be uncomfortable for the patient). - In the 2D mode, adjust the depth to 15–20 cm, and place the transducer over the apex of the heart, caudal to the left areola. The AP4CH view is obtained, with all four chambers clearly visualized. Save the image.
- Roll the trackball so that the cursor is on the boundary between the tricuspid valve and the right ventricle wall to obtain the Tricuspid Annular Plane Systolic Excursion (TAPSE). Press the M-Mode button to obtain the correct image and save it when defined sinus waves are seen. Save the image.
- Place the cursor over the tricuspid valve with the trackball. Decrease the width of the image to increase the number of frames per second, necessary for the RV S' quality. Press the TVI button first, and then the PW button, to obtain the correct image for the RV S' and save it.
- From the AP4CH view, tilt the transducer upwards (i.e., flatten it) to obtain the AP5CH view and get the aortic root on screen. Save the image.
- Place the cursor right above the aortic valve and press the PW button to obtain the LVOT pulse wave Doppler. Place the cursor at exactly the same place where the LVOT diameter was measured. Save the image with the highest quality (sharp Doppler wave boundaries, hollow on the inside and well distinguishable from retrograde or mitral flow). These will later be used to calculate the velocity time integral (VTI), and subsequently the CO.
NOTE: Always try to obtain at least three flow waves for every measurement. In case of an irregular rhythm, at least five waves should be saved. - Proceed to the lung ultrasound using the same phased array cardiac transducer and changing the settings to a frequency of 3.7 MHz, depth to 15 cm, and record the images only during 2 heart cycles. Place the transducer in 6 different locations, with the light of the transducer at 12 o'clock, according to the BLUE protocol18. Make sure to always obtain the image in the same sequence, to avoid confusion when viewing images later.
- Obtain a superior anterior mid-clavicular view of the lungs by placing the transducer on the intercostal space of the 2nd and 3rd rib on both sides. Save the images for each side.
- Obtain an inferior anterior mid-clavicular view of the lungs by placing the transducer 2 to 3 ribs lower. Save the images for each side.
- Obtain a mid-axial view of the lungs by placing the transducer under the patient's arm pits. Save the images for each side.
- Once cardiac and pulmonary imaging is complete, wipe excess gel off the patient's chest.
- Perform CCUS of the IVC and the kidney.
- Click the Probe button and use the trackball to change the active probe to the convex/curvilinear array (abdominal) transducer for the IVC and kidney examination. The light of the transducer, which may be used for orientation, should be at 12 o'clock for both measurements.
- Using the 2D mode and with settings set to a depth of 10–20 cm, and a frequency of 2.5/5.0 MHz, place the transducer just below the xiphoid process and displace it approximately 2 cm to patient's right. The IVC should become visible. Save the image.
- Place the cursor just above the superior wall of the IVC and outside the lumen using the trackball and press the M-Mode button. Save the image.
- For the renal ultrasound, start with the 2D mode and adjust the settings to a depth of 10–15 cm, and a frequency of 2.2/4.4 MHz. Place the transducer dorsal and caudal of the rib cage. Get the chosen kidney central in the image and save it.
NOTE: Make sure to place the transducer as dorsal as possible to filter out liver tissue and bowel loops. For reliable measurements of the kidney length, the borders of the kidney should be clearly visible, and the distance between the central sinus complex (the more echogenic center of the kidney) and the cortex should be similar throughout the image. - Press the Color button to get a color Doppler image of the kidney and determine flow in the renal vasculature. Place the cursor over any artery at the corticomedullary junction in the center of the kidney where Doppler flow is clearly visible using the trackball.
- Adjust the cursor angle and press the PW button. Adjust the signal amplitude and the contrast in Active Mode if necessary. Save the image.
- Determine if there is also sufficient venous signal (i.e., flow visible in the negative half of the y axis), which is required for later measurements. If not, repeat Step 3.4.5 and place the cursor over a vein at the corticomedullary junction in the middle where venous flow is visible. Save the image.
- Once all imaging is complete, disconnect all cables, wipe excess gel off the patient and the transducer, redress or cover the patient and clean the transducer with ultrasound-approved disinfecting wipes.
4. Clinical Examinations 3 and 4
NOTE: The third and fourth clinical examinations are conducted on days 3 and 5 after admission if the patient is still in the ICU (i.e., no death or transfer to the ward took place).
- Physical examination
- Conduct the physical examination following the steps described for Clinical Examination 1.
- CCUS of the heart and the lungs
- Conduct the ultrasonographic examination of the heart and lungs according to Step 3.3. Obtain LVOT only once since it is a static measurement, and therefore does not have to be recorded in Clinical Examination 3 and 4.
- CCUS of the IVC and the kidney
- Conduct the ultrasonographic examination of the IVC and kidney according to Step 3.4. Obtain kidney length only once since it is a static measurement, and therefore does not have to be recorded in Clinical Examination 3 and 4.
5. Measurements and Analysis of the Ultrasound Examinations
NOTE: The images saved during the clinical examination are used after each examination to measure the desired variables. The measured values are registered on the CRF and transcribed to an online clinical patient data management system. Images in which measurements are performed and visible should also be saved, in addition to the original images which will later be used for validation.
- LVOT measurement
- Click the Probe button to select the cardiac transducer in order to start the measurements.
- Using the image saved in Step 3.3.5, pause the image when the valves are fully open.
- Click the Measure button, and then select the Cardiac-Dimension-LVOT options on the right-side menu, to start the measurement.
- Once the cursor appears, choose two points at the base of the aortic valve, one on each side of the lumen, from inner to inner edge, during end-diastole. Save the image.
NOTE: The LVOT measurement must be done and saved before the CO measurement, so that this can be automatically determined by the machine.
- CO measurement
- Using the image saved in Step 3.3.10, trace the left ventricular output. Adjust the horizontal sweep to 100 cm/s.
- Select three well-shaped, hollow waves with clear borders which align with the ECG. Click the Measure button and use the trackball to select the Cardiac-Aortic-LVOT Trace options.
- Trace the waveform line, starting and ending at the baseline, and the ultrasound machine automatically calculates the CO. Repeat this for three waves and save this image.
NOTE: In case of an irregular rhythm, record the average CO value obtained for five waves.
- TAPSE
- Using the M-mode image saved in Step 3.3.7, click the Measure button, and use the trackball to select the Cardiac-Dimension-TAPSE options on the right-side menu.
- Place the cursor first on the lowest point of a well-defined sinus wave and then on the highest point. The difference between the two (the TAPSE) should appear on the top left corner of the screen. Do this in three sinus waves and take the average of the three TAPSE measurements. Save the image.
- Right Ventricular Systolic excursion (RV S')
- Using the image saved in Step 3.3.8, click the Caliper button and place the cursor on the highest peak of a well-defined curve. Do this in three curves and take the average. Save the image.
- Kerley B-line artifact assessment
NOTE: The horizontal A-lines which represent a normal lung surface can be used for reference in the detection of B-lines. These arise from the pleura and are hyperechoic compared to A-lines.- Adjust the contrast of the image and/or the gain. B-lines are not always immediately visible in the saved images.
- Determine and register the number of Kerley B-lines for each of the six images obtained. Since the number of B-lines is not saved in the machine, it must be immediately registered on the CRF (between 0 and 5).
- IVC diameter and collapsibility
- Click the Probe button to select the abdominal transducer in order to start the measurements.
- Using the 2D image saved in Step 3.4.2, click the Caliper button and measure the distance between the two walls of the IVC at 2 cm from the where it enters the right atrium. This is the IVC diameter, save this image.
- Using the M-mode image saved in Step 3.4.3, click the Caliper button and measure the IVC expiratory and inspiratory diameters. Save this image.
NOTE: The expiratory and inspiratory diameters of the IVC are the maximum and minimum diameters seen in the M-mode image, respectively.
- Kidney length and blood flow
- Using the 2D image saved in Step 3.4.4, click the Caliper button and draw the longest line spanning from the caudal to the cranial ends of the renal cortex. This is the kidney length in cm, register this finding in the CRF. Save this image.
- Using the Doppler image saved in Step 3.4.6, analyze the venous flow line seen below the baseline as continuous, monophasic or biphasic. Register the findings in the CRF.
- Using the image saved in Step 3.4.6, click the Measure button and use the trackball to select the Abdominal-Renal-PS/ED/RI options on the right-side menu.
- Place the cursor on the peak and on the lowest point of the pulsatile flow wave in the positive half of the y axis.
NOTE: The G6 machine can calculate the Doppler renal resistive index (RRI) automatically if a continuous pulsatile flow wave is stored, using the formula: RRI = (peak systolic velocity — end diastolic velocity)/peak systolic velocity. Save the image with the measurement from the ultrasound machine on the screen. - Using the image saved in Step 3.4.6 or 3.4.7, click the Caliper button and place the cursor, first, over the peak maximum flow velocity, and then over the maximal flow velocity at nadir (i.e., end diastolic)19. Save the image after measurement.
NOTE: The venous impedance index (VII) is calculated from: VII = (peak systolic velocity — end diastolic velocity) / peak systolic velocity20,21. The VII is not registered in case of monophasic flow, as then only one peak is visible and no diastolic and systolic phases are distinguishable.
6. Data Registration, Storage, and Validation of Ultrasound Images
NOTE: As Figure 1 shows, data registration is done after each clinical examination. Below, the procedure of entering the data obtained from the measurements, clinical examination, and biochemical information (Table 2) retrieved from the electronic health record into the study subject's anonymized online file is described.
- Access the online secured patient management system and open the dossier of the recently included patient. Register the blood gas analysis values, general serum variables, serum renal variables, and 24 h urine analysis. The list of all the variables that are obtained and instructions to do so are presented in Table 2.
- Validate the cardiac CCUS images.
NOTE: This validation is done by independent experts of a Cardiovascular Imaging Core Laboratory in accordance with EACVI guidelines22. The quality of the images obtained by the student-researchers is assessed and the measurements performed are repeated to ensure the required quality of dimensional measurements and tracings of velocity profiles.- Perform the LVOT measurements at end-diastole, as seen on the ECG signal, just beneath the aortic valve.
- Trace the PW signal taken from the LVOT in an AP5CH view to obtain the left ventricular stroke volume and left ventricular CO.
- Validate all images and measurements of the IVC and kidneys. This should be performed by an independent experienced abdominal radiologist. Should there be issues with obtaining the desired images during clinical examination, the independent abdominal radiologist can be called to perform the CCUS, in which case no further validation takes place.
7. Patient Follow-up
- Registering informed consent
- If patient or family consent is obtained during any of the clinical examinations or after the clinical examinations protocol is finished but the patient is still admitted to the hospital, register this in the patient data management system and upload the hand-signed consent form.
- If consent was denied, register this in the patient data management system along with the reason for not obtaining consent, and notify the study coordinator, who will delete all patient data.
- Mortality data
- For patients who die during admission, register mortality directly from the electronic patient record and the associated cause of death.
- For patients without in-hospital mortality, obtain mortality data from the municipal registry in the Netherlands, which is updated every 90 days.
Results
The purpose of these representative results is to illustrate the feasibility of the protocol.
Patients
In total, 663 patients were admitted to the ICU between 14-05-2018 and 15-08-2018. Of these, 208 patients were eligible for inclusion (reasons for exclusion are displayed in Figure 4). A number of 49 patients were excluded as there was no possibility to perform the CCUS due to ongoing resuscitation efforts. Seven patients refused to participate (no informed consent) and in four patients CCUS was impossible, e.g., due to prone positioning for mechanical ventilation or vacuum assisted closure of large wounds, resulting in 138 included patients with data for analysis.
CCUS validation and image quality
Extensive validation of cardiac imaging is planned. Renal ultrasonography validation has been initiated. So far, images of 21 patients (15%) were validated. In 18 patients (86%) images appeared of sufficient quality. All reasons for disapproval of images were listed and returned for feedback to the researcher who performed the ultrasonography. The name of the researcher who performed the ultrasonography is recorded to be able to asses inter- and intra-observer variability using the Intraclass Correlation Coefficient (ICC). Exact statistical methods will be described in our statistical analysis plan, as was done in the SICS-I12.
Example case: Patient X, middle aged female
Patient X was admitted after she was found with impaired consciousness and low blood pressure. All obtained measurements are shown in Table 1. All variables were obtained within the required time set without missing data, illustrating the possible feasibility of this protocol. Within 3 hours after admission the first clinical examination was performed. During this examination the patient was sedated, intubated and needed vasopressor treatment. The second clinical examination was performed ten hours later and showed stable vitals after 700 mL of fluid infusion. Vasopressors were reduced. CCUS and biochemical analysis showed normal cardiac, IVC and renal function (Figure 5, Figure 6 and Figure 7). At T3, two days later, the vasopressors were stopped but cumulative positive fluid balance had risen to 6 liters, accompanied by an increased CO, wider IVC and diminished renal perfusion and function reflected by increased serum creatinine. At T4, 5 days after admission, fluid balance and serum creatinine had risen even further, where the patient developed stage 3 AKI. The patient died 2 days later due to multi organ failure with unclear origin, at 7 days after admission.
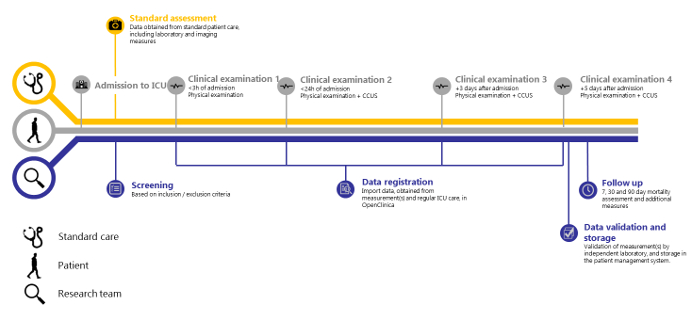
Figure 1: SICS-II study overview. Timeline of the SICS-II study from patient admission to Intensive Care to the final step of data registration. Please click here to view a larger version of this figure.
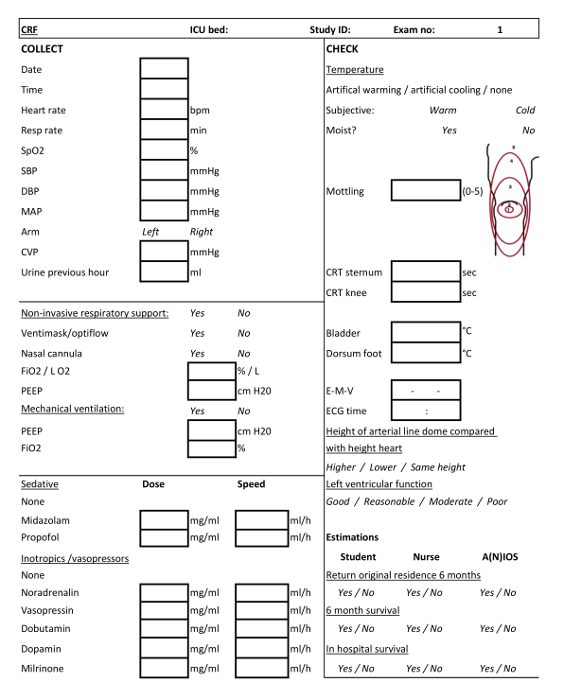
Figure 2: Case Report Form (CRF) for clinical examination 1. CRF to be filled by the ICU team students or student-researchers when conducting the first clinical examination. Please click here to view a larger version of this figure.
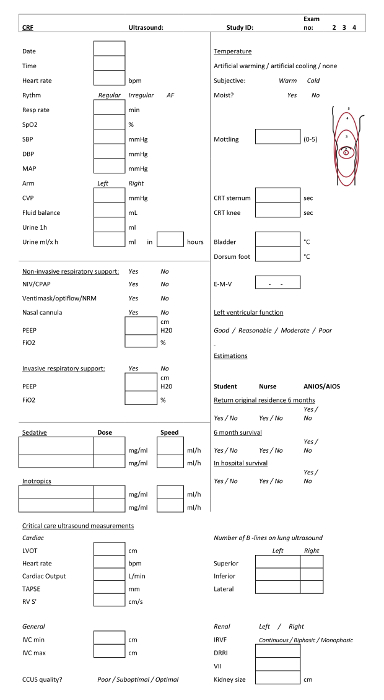
Figure 3: Case Report Form (CRF) for clinical examinations 2, 3 and 4. CRF to be filled by the ICU team students or student-researchers when conducting the second, third and fourth clinical examinations. Please click here to view a larger version of this figure.
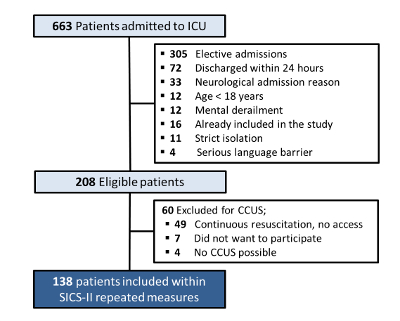
Figure 4: SICS-II patient inclusion and exclusion chart. Flowchart describing the criteria for patient inclusion and exclusion in the SICS-II study until 15-08-2018. Please click here to view a larger version of this figure.
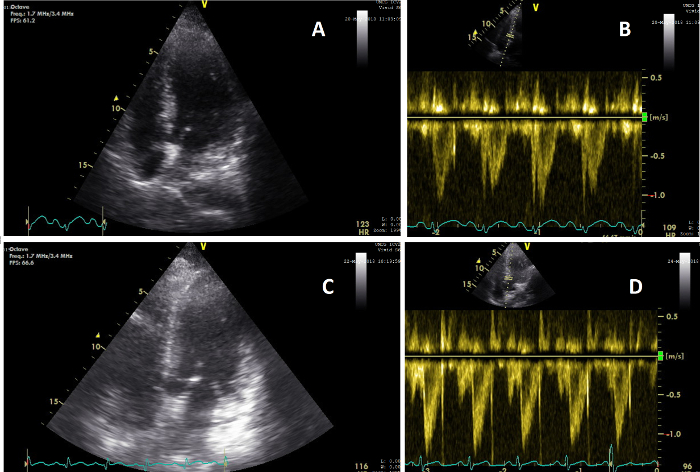
Figure 5: Apical views showing change in cardiac function. (A) Image of the heart on an AP4CH view during CCUS conducted during clinical examination 2 (T=2); (B) Image of the heart VTI pulse wave signal on T=2, showing a CO of 5.6 L/min; (C) Image of the heart on an AP5CH view during CCUS conducted during clinical examination 3 (T=3); (D) Image of the heart VTI pulse wave signal on T=3, showing a CO of 8.3 L/min. Please click here to view a larger version of this figure.
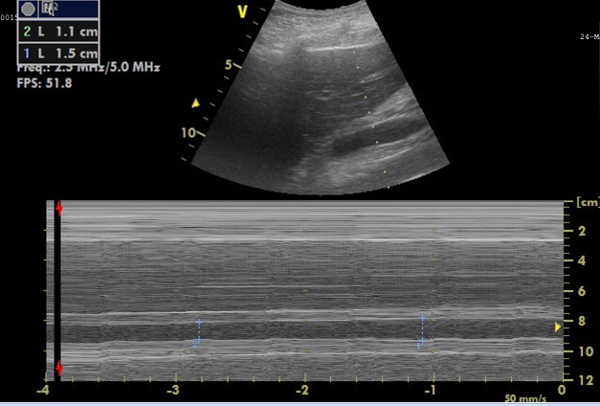
Figure 6: M-mode image of the inferior vena cava (IVC) for diameter measurements. Image showing, on top, the IVC in real-time, and, below, the M-mode image representing the IVC diameter changes, from which the collapsibility can be calculated. Please click here to view a larger version of this figure.
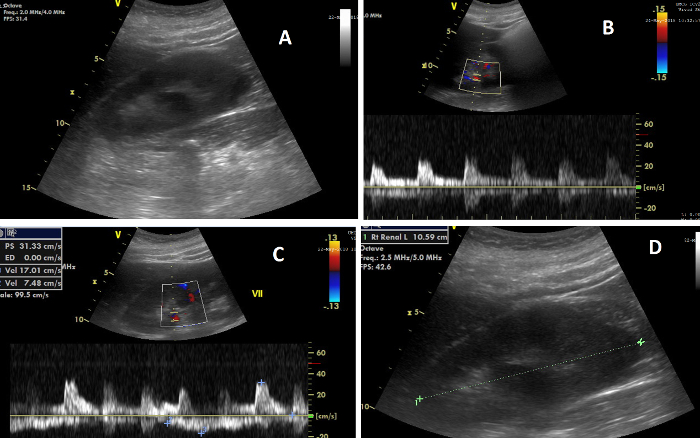
Figure 7: The various elements of renal ultrasonography. (A) Image of the right kidney during CCUS; (B) Image showing, on top, the Doppler flow in the renal arteries, and, below, the flow wave from which the renal resistive index is calculated; (C) Image showing, on top, the Doppler flow in the renal veins, and, below, the flow wave from which the venous impedance index is calculated; (D) Image illustrating the measurement of renal length. Please click here to view a larger version of this figure.
| Variable | T1 Day 1, at 00:38 | T2 Day 1, at 10:53 | T3 Day 3, at 10:14 | T4 Day 5, at 10:20 |
| Heart rate (bpm) | 110 | 124 | 122 | 98 |
| Respiratory rate (breaths per min) | 24 | 15 | 26 | 12 |
| Systolic blood pressure (mmhg) | 100 | 115 | 130 | 118 |
| Diastolic blood pressure (mmhg) | 61 | 69 | 66 | 65 |
| Mean arterial pressure (mmhg) | 73 | 80 | 84 | 81 |
| Cumulative fluid balance (mL) | 0 | 704 | 7272 | 12338 |
| Mechanical ventilation | PEEP 5, FiO2 40% | PEEP 5, FiO2 40% | PEEP 5, FiO2 30% | PEEP 5, FiO2 30% |
| CRT sternum (seconds) | 1.5 | 2 | 4 | 3 |
| Central temperature (◦ C) | 37.6 | 37.5 | 38.0 | 37.4 |
| Urinary output previous hour (mL) | 117 | 60 | 0 | 10 |
| Administered inotropic agents | Noradrenaline 0.1 mg/ml 3.0 ml/h | Noradrenaline 0.1 mg/ml 1.0 ml/h | none | none |
| Administered sedative agents | Propofol 20 mg/ml 5.0 ml/h | none | none | none |
| APACHE IV score | 92 | 88 | 87 | 90 |
| SOFA score | 8 | 8 | 5 | 8 |
| LVOT (cm) | N.A. | 2.4 | 2.4 | 2.4 |
| Cardiac output (L/min) | N.A. | 5.6 | 8.34 | 9.89 |
| TAPSE (mm) | N.A. | 25 | 26 | 21 |
| RV S’ (cm/s) | N.A. | 14 | 15 | 12 |
| IVC inspiratory diameter (cm) | N.A. | 1.14 | 1.24 | 1.10 |
| IVC expiratory diameter (cm) | N.A. | 1.27 | 1.38 | 1.50 |
| Kerley B lines (total) | N.A. | 6 | 2 | 4 |
| Renal length (cm) | N.A. | 10.59 | N.A. | N.A. |
| Intrarenal venous flow pattern | N.A. | Continuous | Continuous | Continuous |
| Doppler Renal RI | N.A. | 0.61 | 0.75 | 0.70 |
| VII | N.A. | 0.33 | 0.56 | 0.68 |
Table 1: A random SICS-II patient. Patient X, middle aged female admitted to the ICU after being found with impaired consciousness. Abbreviations: bpm = beats per minute, CRT = capillary refill time, LVOT = left ventricular outflow tract, TAPSE = tricuspid annular plane systolic excursion, RV S' = right ventricular systolic excursion, IVC = inferior vena cava, RRI = Renal resistive index, VII = venous impedance index, N.A. = not applicable.
| Variable | Unit | Source | Obtained at |
| Lactate | mmol/L | Arterial blood gas analysis | From standard care, as close as possible too each clinical examination, max 12 h difference |
| Chloride | mmol/L | Arterial blood gas analysis | From standard care, as close as possible too each clinical examination, max 12 h difference |
| pH | Arterial blood gas analysis | From standard care, as close as possible too each clinical examination, max 12 ho difference | |
| PCO2 | kPa | Arterial blood gas analysis | From standard care, as close as possible too each clinical examination, max 12 h difference |
| PaO2 | kPa | Arterial blood gas analysis | From standard care, as close as possible too each clinical examination, max 12 h difference |
| HCO3- | mmol/L | Arterial blood gas analysis | From standard care, as close as possible too each clinical examination, max 12 h difference |
| Hemoglobin | mmol/L | Arterial blood gas analysis | From standard care, as close as possible too each clinical examination, max 12 h difference |
| Leukocytes | 10 x 10-9/L | Serum analysis | From standard care, as close as possible too each clinical examination, max 12 h difference |
| Trombocytes | 10 x 10-9/L | Serum analysis | From standard care, as close as possible too each clinical examination, max 12 h difference |
| HS Troponine | ng/L | Serum analysis | From standard care, as close as possible too each clinical examination, max 12 h difference |
| ASAT | U/L | Serum analysis | From standard care, as close as possible too each clinical examination, max 12 h difference |
| ALAT | U/L | Serum analysis | From standard care, as close as possible too each clinical examination, max 12 h difference |
| Total bilirubin | uoml/L | Serum analysis | From standard care, as close as possible too each clinical examination, max 12 h difference |
| Creatinine | umol/L | Serum analysis | All measurements from start of ICU admission |
| Urine volume | ml | Urine collection of 24 h | All measurements from start of ICU admission |
| Creatinine | mmol/24 h | Urine analysis | All measurements from start of ICU admission |
Table 2: List of biochemical variables obtained. All patient biochemical variables collected during the study are listed here.
Discussion
All examinations need to be performed according to the protocol. Physical examination only has value if performed according to pre-specified definitions23. Laboratory values should be collected according protocol to obtain all values. Clear, interpretable CCUS images are key to answer the research question of this study, as described in Step 3.3. If poor quality images are obtained, the measurements and analyses described in Step 5 cannot be performed, and the purpose of repeated measurements expires. Three important measures are taken to minimize the risk of obtaining low quality images. First, student-researchers who perform CCUS in our study are trained by an experienced cardiologist-intensivist. Literature shows that a short training program is well suited to obtain basic competence in CCUS24. Second, the student researchers are supervised by a senior student-researcher during their first 20 exams so they may receive hands on feedback. Last, all acquired cardiac and kidney images will be reassessed and validated by an independent expert of a Cardiac Imaging Core Laboratory and an experienced abdominal radiologist, respectively to ensure that data is reliable.
To ensure image quality, researchers also need to pay attention to other aspects. Re-applying ultrasound gel or repositioning the probe so that it makes better contact with the skin of the patient is sometimes required to ensure optimal image quality. It is also important to take enough time to acquire the most optimal image and if there are doubts a senior researcher, i.e., a supervising cardiologist-intensivist or core laboratory technician, should be consulted before the clinical examination is completed. Continuous evaluation and validation of all ultrasonographic images is ensured by enforcing the protocolized steps displayed in Figure 1. In addition, student-researchers and experts frequently exchange feedback, making it easy to quickly implement protocol changes to further increase the quality of images and measurements. This frequent verification makes systematic errors easy to detect so that the CCUS training for future student-researchers can be adapted accordingly. Furthermore, monthly meetings open to all team members allows thorough evaluation and (if necessary) modifications of the protocol.
Round the clock availability for patient screening and inclusion is another key element for the successful implementation of this study. This can only be achieved by having a dedicated team of student-researchers, a large team of students to provide support, and good coordination with the ICU caregivers. This coordination takes place by regular low stake contact between caregivers and researchers about possible improvements to optimize collaboration with standard care.
A limitation of this protocol is that successfully conducting CCUS is dependent on the accessibility of the pre-specified positions where the probe is placed. During the SICS-I, it was already shown that cardiac CCUS cannot be performed when patients require drains, gauzes or wound dressings which obstruct the theoretically optimal echocardiographic window1. Additionally, the possibility to obtain a proper subcostal window via transthoracic echocardiography, which is required for the IVC measurements, has previously been shown to be potentially limited in a general ICU population25. The 24/7 availability required by this protocol to carry out the different examinations at different time points is also a potential limitation, as some centers may lack the capacity to do so. Even in a large academic hospital such as the UMCG, ensuring this has led to delays in the start of the study. Another limitation intrinsic to ultrasonographic measurements is the inter-observer variability of the measurements. For patient inclusion to be guaranteed 24/7, it is impossible for one researcher to conduct all clinical examinations in all included patients. This study aims to have the same researcher carry out all ultrasound measurement in one same patient to minimize variability at the individual level, but for the entire cohort, inter-observer variability remains an issue.
Ultrasonographic imaging of multiple organs can be a fast, safe, and effective structure for visualizing organ perfusion and function. It is a convenient tool that all medical professionals should be able to use, and for which few measurements based on a simple, standardized protocol should generally provide reliable measurements.
Furthermore, most observational studies evaluating the use of ultrasonography, and particularly of echocardiography, are retrospective in nature or include only a small number of patients.26 This protocol allows a structural 24/7 screening of an unselected cohort of critically ill patients, of which subpopulations of interest can be defined, thus allowing for the simultaneous investigation of multiple research questions.
Moreover, despite it being known that clinical variables in critical care are highly dynamic and reciprocally influence each other, most studies have only investigated the additive value of singular ultrasound measurements of specific organs27,28. This is the first protocol to focus on repeated measures, whole body ultrasound and venous congestion. We expect that the SICS-II will provide a more accurate reflection of patients' hemodynamic status during ICU admission.
The current structure used in SICS can be applied to a large number of settings, and the addition of other elements is currently being studied. Its strength lies in the combination of a basic research line and an adaptive line in which new variables can easily be added to the CRFs so that new research questions can be investigated. An example of this adaptability is the addition of extensive ventricular wall assessment by deformation imaging, i.e., strain on short term, to the regular protocol in a specific subset of patients.
Moreover, patient inclusion is currently exclusively taking place in the ICU and part of the patients' care trajectory is now missed. ICU patients are often first admitted to the emergency department (ED), and stay in the regular hospital ward after ICU discharge. Therefore, the SICS aims to include patients at an earlier stage by including patients upon ED arrival and register interventions and hemodynamic function from initial hospital admission onwards. Furthermore, plans to conduct CCUS after ICU-discharge to regular wards are also ongoing so that all patients can be measured at each predefined study time. Another important aspect is the expandability of the protocol to other centers: its simplicity allows easy adaptation by centers which can start inclusion themselves.
Lastly, the development and successful implementation of a structured CCUS protocol may also have clinical ramifications. Despite being used for research purposes only, it could be implemented for clinical CCUS by medical doctors after the proposed short training period. It would then be interesting to assess if facilitating CCUS training to (inexperienced) physicians would decrease additional diagnostic testing.
Disclosures
Authors have nothing to disclose.
Acknowledgements
We would like to thank all members of the SICS-Study group that have been involved within the SICS-I and have participated in brainstorm sessions about the current protocol. We would also like to thank the research bureau of our Critical Care department and its coordinators for their support; dr. W. Dieperink and M. Onrust. Furthermore, we would like to thank the ICU Studentsteam and the student-researchers who have structurally included patients into SICS-II so far; J. A. de Bruin, B. E. Keuning, drs. K. Selles.
Materials
| Name | Company | Catalog Number | Comments |
|---|---|---|---|
| Ultrasound machine | GE Healthcare | 0144VS6 | Ultrasound machine, GE Vivid S6 |
| Ultrasound machine | GE Healthcare | 3507VS6 | Ultrasound machine, GE Vivid S6 |
| Ultrasound machine | GE Healthcare | 0630VS6 | Ultrasound machine, GE Vivid S6 |
| Ultrasound gel | Parker | 01-08 | Aquasonic 100 ultrasound transmission gel |
| Temperature probe | DeRoyal | 81-010400EU | Skin Temperature Sensor |
References
- Hiemstra, B., et al. Clinical examination, critical care ultrasonography and outcomes in the critically ill: cohort profile of the Simple Intensive Care Studies-I. BMJ open. 7 (9), 017170(2017).
- Lee, J., et al. Association between fluid balance and survival in critically ill patients. Journal of Internal Medicine. 277 (4), 468-477 (2015).
- Perner, A., et al. Fluid management in acute kidney injury. Intensive Care Medicine. 43 (6), 807-815 (2017).
- Balakumar, V., et al. Both Positive and Negative Fluid Balance May Be Associated With Reduced Long-Term Survival in the Critically Ill. Critical care medicine. 45 (8), 749-757 (2017).
- Hjortrup, P. B., et al. Restricting volumes of resuscitation fluid in adults with septic shock after initial management: the CLASSIC randomised, parallel-group, multicentre feasibility trial. Intensive Care Medicine. 42 (11), 1695-1705 (2016).
- Prowle, J. R., Kirwan, C. J., Bellomo, R. Fluid management for the prevention and attenuation of acute kidney injury. Nature reviews. Nephrology. 10 (1), 37-47 (2014).
- Gambardella, I., et al. Congestive kidney failure in cardiac surgery: the relationship between central venous pressure and acute kidney injury. Interactive CardioVascular and Thoracic Surgery. 23 (5), 800-805 (2016).
- Chen, K. P., et al. Peripheral Edema, Central Venous Pressure, and Risk of AKI in Critical Illness. Clinical journal of the American Society of Nephrology : CJASN. 11 (4), 602-608 (2016).
- Song, J., et al. Value of the combination of renal resistance index and central venous pressure in the early prediction of sepsis-induced acute kidney injury. Journal of critical care. 45, 204-208 (2018).
- Zhang, L., Chen, Z., Diao, Y., Yang, Y., Fu, P. Associations of fluid overload with mortality and kidney recovery in patients with acute kidney injury: A systematic review and meta-analysis. Journal of Critical Care. 30 (4), (2015).
- Simple Intensive Care Studies II - Full Text View. ClinicalTrials.gov. , Available from: https://clinicaltrials.gov/ct2/show/NCT03577405? term=simple+intensive+care+studies (2018).
- Wetterslev, J. Statistical analysis plan Simple Intensive Care Studies-I DETAILED STATISTICAL ANALYSIS PLAN (SAP) 1. Administrative information 1.1. Title, registration, versions and revisions. ClinicalTrials.gov. , Available from: https://clinicaltrials.gov/ProvidedDocs/24/NCT02912624/SAP_000.pdf (2018).
- van der Horst, I. C. C. Simple Observational Critical Care Studies - Full Text View - ClinicalTrials.gov. ClinicalTrials.gov. , Available from: https://clinicaltrials.gov/ct2/show/NCT03553069 (2018).
- Ait-Oufella, H., et al. Alteration of skin perfusion in mottling area during septic shock. Annals of Intensive Care. 3 (1), 31(2013).
- Teasdale, G., Jennett, B. Assessment of Coma and Impaired Consciousness: A Practical Scale. The Lancet. 304 (7872), 81-84 (1974).
- Detsky, M. E., et al. Discriminative Accuracy of Physician and Nurse Predictions for Survival and Functional Outcomes 6 Months After an ICU Admission. JAMA. 317 (21), 2187(2017).
- Lipson, A. R., Miano, S. J., Daly, B. J., Douglas, S. L. The Accuracy of Nurses' Predictions for Clinical Outcomes in the Chronically Critically Ill. Research & reviews. Journal of nursing and health sciences. 3 (2), 35-38 (2017).
- Lichtenstein, D. A. BLUE-protocol and FALLS-protocol: two applications of lung ultrasound in the critically ill. Chest. 147 (6), 1659-1670 (2015).
- Tang, W. H. W., Kitai, T. Intrarenal Venous Flow: A Window Into the Congestive Kidney Failure Phenotype of Heart Failure. JACC: Heart Failure. 4 (8), 683-686 (2016).
- Jeong, S. H., Jung, D. C., Kim, S. H., Kim, S. H. Renal venous doppler ultrasonography in normal subjects and patients with diabetic nephropathy: Value of venous impedance index measurements. Journal of Clinical Ultrasound. 39 (9), 512-518 (2011).
- Iida, N., et al. Clinical Implications of Intrarenal Hemodynamic Evaluation by Doppler Ultrasonography in Heart Failure. JACC: Heart Failure. 4 (8), 674-682 (2016).
- Lang, R. M., et al. Recommendations for Cardiac Chamber Quantification by Echocardiography in Adults: An Update from the American Society of Echocardiography and the European Association of Cardiovascular Imaging. European Heart Journal - Cardiovascular Imaging. 16 (3), 233-271 (2015).
- Hiemstra, B., Eck, R. J., Keus, F., van der Horst, I. C. C. Clinical examination for diagnosing circulatory shock. Current opinion in critical care. 23 (4), 293-301 (2017).
- Vignon, P., et al. Basic critical care echocardiography: validation of a curriculum dedicated to noncardiologist residents. Critical care medicine. 39 (4), 636-642 (2011).
- Jensen, M. B., Sloth, E., Larsen, K. M., Schmidt, M. B. Transthoracic echocardiography for cardiopulmonary monitoring in intensive care. European journal of anaesthesiology. 21 (9), 700-707 (2004).
- Koster, G., van der Horst, I. C. C. Critical care ultrasonography in circulatory shock. Current opinion in critical care. 23 (4), 326-333 (2017).
- Haitsma Mulier, J. L. G., et al. Renal resistive index as an early predictor and discriminator of acute kidney injury in critically ill patients; A prospective observational cohort study. PloS one. 13 (6), 0197967(2018).
- Micek, S. T., et al. Fluid balance and cardiac function in septic shock as predictors of hospital mortality. Critical care. 17 (5), London, England. 246(2013).
Reprints and Permissions
