This study details the process of gavaging precise amounts of probiotics to neonatal mice. The experimental set-up was optimized to include but is not limited to probiotic dosing, methods of administration, and quantification of bacteria in the intestines.
Method Article
Probiotic Studies in Neonatal Mice Using Gavage
* These authors contributed equally
In This Article
Summary
Abstract
Adult mouse models have been widely used to understand the mechanism behind disease progression in humans. The applicability of studies done in adult mouse models to neonatal diseases is limited. To better understand disease progression, host responses and long-term impact of interventions in neonates, a neonatal mouse model likely is a better fit. The sparse use of neonatal mouse models can in part be attributed to the technical difficulties of working with these small animals. A neonatal mouse model was developed to determine the effects of probiotic administration in early life and to specifically assess the ability to establish colonization in the newborn mouse intestinal tract. Specifically, to assess probiotic colonization in the neonatal mouse, Lactobacillus plantarum (LP) was delivered directly into the neonatal mouse gastrointestinal tract. To this end, LP was administered to mice by feeding through intra-esophageal (IE) gavage. A highly reproducible method was developed to standardize the process of IE gavage that allows an accurate administration of probiotic dosages while minimizing trauma, an aspect particularly important given the fragility of newborn mice. Limitations of this process include possibilities of esophageal irritation or damage and aspiration if gavaged incorrectly. This approach represents an improvement on current practices because IE gavage into the distal esophagus reduces the chances of aspiration. Following gavage, the colonization profile of the probiotic was traced using quantitative polymerase chain reaction (qPCR) of the extracted intestinal DNA with LP specific primers. Different litter settings and cage management techniques were used to assess the potential for colonization-spread. The protocol details the intricacies of IE neonatal mouse gavage and subsequent colonization quantification with LP.
Introduction
In infants, early probiotic exposure has been associated with immunomodulatory effects leading to reduced incidence of diseases like necrotizing enterocolitis, atopic dermatitis and sepsis1,2,3,4,5. However, the mechanism behind this immunomodulatory response is challenging to explore given the limitation to sampling in newborn human trials (i.e., sequential blood draws and biopsies). Neonatal mouse models can help study the mechanism of action involved in neonatal immune regulation associated with probiotic use and changes in the intestinal microbiota. Unfortunately, most mouse models for probiotics have largely focused on adult mice; however, the impact of probiotics is likely to be highest early in life, suggesting models specific for this age group will be useful3,6. In addition, neonatal mouse models are better suited to study diseases and interventions intended for application in early life of human infants as they are expected to more closely mimic a developing immune and microbial system7,8,9,10. The aim was to study the extent and patterns of probiotic colonization of neonatal mice with a focus on the mechanistic interaction between the host and its microbiome. Suitable descriptions of newborn models were not found in the literature, and thus a need for the development of robust and standardized method was addressed.
Established methods of oral administration of various compounds to newborn mice include maternal transfer of desired compounds through milk by treating the water source for pregnant dams11 or using feeding needles to facilitate administration of desired compounds into the oropharynx12. These methods are useful for experiments that do not have precise dosage requirements and where the treatment is readily ingested by the recipient mouse. Probiotics are often administered in conjunction with a prebiotic such as galactooligosaccharide and fructooligosaccharide (FOS) that serve as a source of nutrition for probiotic bacteria; these additive compounds make the solution viscous and challenging to administer via the above-mentioned methodologies. Devising a method to administer precise amounts of probiotics and prebiotics to newborn mice starting as early as the first day of life (DOL) was necessary. In the process of developing the gavage technique, the possibility of colonization-spread (as observed in other probiotic studies between the treatment and the control arms13,14,15,16) was tested and the relative abundance of colonized Lactobacillus plantarum (LP) in the intestines of pups with different gavage schedules was assessed. The probiotic preparation used in the experiments consisted of 109 colony-forming units (CFU) per gavage of LP (ATCC-202195 strain), mixed with FOS (prebiotic) and maltodextrin (excipient) as described in the recent human trial3. The probiotic delivery was accomplished using IE gavage and the process is detailed in the protocol below. The colonization profile of the probiotic was evaluated using real time amplification of DNA extracted from whole intestines using LP specific primers.
Protocol
All procedures were carried out pertaining to the guidelines established by the support staff at the Animal Care Facility at the University of British Columbia and all procedures were approved by the UBC Animal Care Committee.
1.Quantification of probiotics administered
NOTE: This step is recommended to determine the exact amount of probiotic CFU that can be administered in a single dose. The quantity of probiotics and vehicle (FOS and maltodextrin) determine the saturation conditions of the solution. From experience, no more than 30 µL (~20 mL per kg) of fluid can be administered to mice on DOL 2 as any greater volume increases risk of aspiration.
- Prepare six 1.5 mL microcentrifuge tubes for serial dilutions with each tube containing 180 µL of sterile 5% dextrose saline.
- Weigh a 0.2 g aliquot of a probiotic-prebiotic mixture and dissolve it in 1 mL of 5% dextrose saline in a sterile manner.
- Vortex for 30 seconds and pipette to break clumps. Repeat until no visible clumps are observed.
NOTE: Maltodextrin makes the solution viscous and contribute to solution saturation. - Perform a serial dilution using tubes prepared in step 1.1. Vortex to mix.
- Plate 40 µL of every dilution onto a labelled quadrant of the MRS agar plate. Plate each dilution in duplicate.
- Incubate under anaerobic (or microaerophilic) conditions at 37 °C for 48 h in a vacuum jar using a gas pack.
- Count each plate within a range of 20-70 colonies per quadrant. Average plate counts with the same dilution and calculate back to the desired units.
2. Preparation of probiotics and prebiotics for gavage
NOTE: The proper dissolution of probiotic and prebiotic is necessary to ensure the smooth injection of liquid through the feeding needle during gavage.
- Combine the required amount of lyophilized probiotic organism with the desired amounts of prebiotics and vehicle in a sterile microcentrifuge tube.
- Add appropriate amounts of solvent (5% dextrose saline) to dissolve the probiotic-prebiotic mixture.
NOTE: The capacity of dissolution is limited by the prebiotic and vehicle used. From experience, the synbiotic combination (with FOS and maltodextrin) reached saturation at approximately 0.3 g/mL while dissolving in a 2 mL microcentrifuge tube using 1 mL of solvent. - Vortex to mix until all solids are dissolved. Use a pipet to break up globules of solid particles in the solvent by pipetting up and down.
- Incubate the solution in a 37 °C water bath for 20 min.
NOTE: This step can be skipped if the probiotic-prebiotic solution is created from a live culture. - Plate a five series 10-fold dilution on MRS agar plates before gavage to accurately quantify the probiotic administered to the pup. This step can be skipped if the accurate CFU count is not needed.
3. Preparation of the biosafety cabinet
- Use a biosafety cabinet when working with probiotics to maintain aseptic technique. Set the cage with the dams and pups on a heating blanket (set to approximately 38 °C) on one half of the blanket. Place a clean, empty animal cage on the other half of the heating blanket.
- Place a disinfected or sterile, absorbent pad on the heating blanket to tend to the mouse during gavage.
- Collect nesting material for the pups from the top of the existing, dam-created nest and create a new conical nesting cup using gloved hands, disinfected using 70% ethanol and dried. Place this new nest in the clean, empty holding cage. This facilitates the transfer of the scent of the nest to the gloved hands and thus minimizes the introduction of other scents on the pup while handling them for the procedure, reducing the risk of cannibalization.
- Move the pups into the conical nest holding cage and remove the cage with the dam from the cabinet. This decreases the stress for the dam by preventing it from hearing the pups during the procedure.
NOTE: If the probiotic is a known colonizer of the murine intestines, the treatment conditions must be separated by cages or even different biosafety cabinets to avoid the possibility of cross colonization.
4. Intra-esophageal gavage of neonatal mouse
- Open the syringe packaging for easy access. Open the packing of the needle in a sterile manner and attach it to the head of the syringe. Wash the needle with 70% ethanol and autoclave prior to the procedure. Use different sets of needles for the treatment and the control group to avoid contamination.
- Draw a little more than the desired amount of probiotic-dye solution into the syringe. Hold the syringe facing up. Then pull down further and flick with finger to dislodge bubbles and push on the plunger to expel bubbles and the extra liquid volume until the desired volume is reached. This ensures that there is no air space in the needle. For DOL 2 mouse, the volume of gavage must not exceed 30 µL.
- Place the pup onto the sterile absorbent pad on top of the heating pad. Use the feeding needle (24 Gauge, 1" needle length, 1.25 mm ball diameter) externally to measure the length of the esophagus by placing the ball of the needle just below the xiphoid process (bottom end of the sternum). Mark the needle at the level of the snout to note the limit of insertion of the needle (Figure 1). Observe the pup for health signs, which include regular breathing and pink coloration of the skin.
- Dip the tip of the needle in the dipping solvent (5% dextrose saline or - the medium used to dissolve the probiotic and pre-biotic) to lubricate the external surfaces of the feeding needle. This facilitates the smooth entry of the needle into the esophagus of the mouse.
- Lift the pup by the scruff or by gently holding the head and body between the thumb and index finger. Ensure the head, neck and body are held in a straight position. Do not hold the pup by the scruff for longer than 60 s as there is a risk of obstruction of the trachea leading to suffocation. Ensure the pup can breathe. Signs of scruffing too hard can include inability to breathe, significant gasping and the tongue extended out the mouth. Monitor the pup's color and breathing during the entire procedure.
- Insert the bulb of the needle into the center of the mouth of the pup at a 45° angle to the plane of the torso until it reaches the back of the throat.
- Gently change the angle of the needle by pivoting on the bulb of the needle and moving the syringe away from the gavaging person (towards the dorsal side of the pup) until it is parallel to the plane of the pup's vertebral column. Scruffing the pup helps keep the needle in place in the back of the throat, and also prevents the mouse from squirming. Make sure the ball of the needle does not advance or exert any pressure against the back of the throat during the angle change.
- If the mouse attempts to swallow the needle, allow it to naturally slide downward and arrest the movement when the marking on the needle aligns with the snout. The syringe and needle are usually heavy enough to slide down the due to gravity. Support the weight of the needle at all times so the needle slides easily down the esophagus with no downward pressure from the person carrying out the gavage.
- If the needle meets resistance in the back of the throat, withdraw the gavage needle slightly to dislodge the ball of the needle and re-angle the needle inside the mouth towards left of the mouse (handler's right) slowly in small, 1 mm increments. The needle should start to slide easily down the esophagus.
- If the needle stops before the marking on needle reaches the mouth, do not inject the solution.
- Do not keep the needle inserted for more than 20 s. If this occurs, retract the needle slowly while keeping the syringe parallel to the torso and let the pup rest on the paper towel for 30 s to 1 min. Try gavaging again after lubricating the external surface of the needle with the solvent.
NOTE: Anaesthesia is not used for the procedure as the mouse's response is necessary to gauge the success of gavage.
- When the marking on the feeding needle is above the snout and aligned with the tip of the snout, do not let the needle move or advance any further. Slowly inject the desired volume of liquid. If the liquid is aspirated or observed to bubble through the nose, stop the injection immediately and slowly retract the needle.
- Place the pup upright on the paper towel on the heating pad to aid in its recovery. Monitor closely for continued breathing problems or change in color of the pup which indicates aspiration. Euthanize pups that have aspirated immediately.
- Once the gavage is complete, gently withdraw the feeding needle at the same angle it was inserted. Place the pup on the paper towel on the warmed heating pad. Wait 10 s for the pup to regain normal activity and breathing pattern. A healthy pink hue should appear over the pup's body and the dye should only be visible in the stomach compartment. Move it back to the cage with the other pups.
NOTE: Gavaging blue food coloring is an excellent way to practice the procedure outlined above. If the gavage is successful, the stomach of the mouse will be visible as a blue hue.If the blue dye is found outside the stomach of the pup (neck, chest or axillary region), the animal should be humanely euthanized (in accordance with the animal care rules), as this indicates a rupture of the esophagus or aspiration.
5. Collection of intestional samples for colonization analysis
- During subsequent monitoring or gavaging, collect fecal microbiome samples from the pups.
NOTE: The pup frequently urinates and defecates when gavaged and this time can be used as an opportunity to collect the fecal samples for microbiome analysis. - For termination of experiments, collect the intestines from duodenum to rectum after euthanasia of the pups. Pin the pup to a surgical board and disinfect the skin with 70% ethanol. Cut away the skin into four quadrants without damaging the peritoneal layer using tools sterilized with 70% ethanol and a hot bead sterilization at 250 °C.
- Use a different set of sterile tools to cut the peritoneum into four quadrants and move it away from the center in a way that the visceral organs are exposed.
- Locate the stomach and use a clamp to pinch below the pyloric sphincter and at the end of rectum. Run the length of the intestine using a blunt tool or forceps to streamline the intestine and free it from the connective tissue and mesenteric tissue. Once the entire length of the intestine has been freed of connective tissue, cut at the clamped ends.
- Mark the aluminum foil with the orientation of the intestine, wrap in a secure manner and freeze at -80 °C.
NOTE: The DNA extraction procedure can be carried out at this point without freezing. The blue dye was also seen to pass through the intestine over 24 h and collection of samples for colonization analysis is best when the intestines are collected at least 24 hours post the last gavage. Signals might be amplified before that timepoint by the non-adhered bacteria transiently passing through the gavage mixture.
6. DNA extraction from intestines for colonization analysis
NOTE: The DNA extraction is done using a commercial kit with optimizing modifications made to the protocol for the intestine DNA extraction. Ensure the heating apparatus is set to the desired temperature and the solutions that need alterations or pre-warming are prepared appropriately.
- Prepare the Enzymatic Lysis Buffer (ELB) as follows: Make a solution with 20 mM Tris-Cl, 2 mM sodium EDTA and 1.2% Triton X-100. Adjust the pH to 8.0. Immediately before using ELB, add lysozyme to a final concentration of 20 mg/mL.
- Pre-weigh the garnet bead tubes on analytical balance with the caps removed.
NOTE: This is done so that if the required weight is overshot, it is easier to remove the intestinal contents. - Cut the intestines into small segments using a sterile disposable scalpel and scoop the desired segments into the pre-weighed garnet bead tubes.
NOTE: Make sure to change scalpels between every sample as DNA is ubiquitous and can affect PCR results. - Add 1 mL of ELB with lysozyme (from step 6.1) to each tube, place on the vortexing bead beater and run at maximum setting (14) for 5 minutes.
- Once the tissue is disrupted, transfer the tubes to the 37°C water bath and incubate for 30 minutes.
NOTE: This step is done to activate lysozyme and induce the breakdown of cell wall peptidoglycan of gram-positive bacteria. - Prepare tubes with 20 µL of Proteinase K for every sample at a concentration of 600 mAU per mL.
- Centrifuge the tubes at 400 x g for 10 minutes. The lysate should look clear with some tissue residue on top of the beads.
- Transfer 180 µL of supernatant (the upper phase) into a tube containing Proteinase K and then add 200 µL of AL buffer to the tube. Vortex for 15 s to mix.
- Place tubes on the heating block at 56 °C for 10 minutes.
- Add 200 µL of 100% ethanol to the tube and mix by vortexing for 15 s.
- Add approximately 600 µL of lysate to the spin column (from kit).
- Centrifuge for 1 minute at 8,000 x g. Discard flow through.
- Repeat step 6.12 until all the lysate has been drawn through the column.
- Place the column in a new collection tube. Add 500 µL of AW1 buffer and centrifuge at 8,000 x g for 1 minute.
- Discard the flow through. Add 500 µL of AW2 buffer and centrifuge at 8,000 x g for 3 min.
- Discard the flow through and centrifuge the column in an empty collection tube at 8,000 x g for 3 min.
- Transfer the column to DNA elution tube. Add 60 µL of PCR grade ultrapure water directly onto the membrane and incubate for 2 minutes at room temperature.
- Use the pre-warmed elution water at 37 °C to elute. The elution can be done twice by using half the final elution volume and repeating step 6.15 twice to increase yield.
- Centrifuge for 1 minute at 8,000 x g to elute DNA.
- Measure the concentration of the DNA eluted using the desired quantification method. The extraction process yields are in the range of 10-40 ng/µL DNA.
- Store the eluted DNA at -20 °C.
7. qPCR setup
- PCR Conditions
- Turn on the machine and load the program in Table 1 into a real time qPCR machine.
- Loop steps 3 to 5 in Table 1 for 40 cycles and hold the sample at 4 °C at the end of the reaction.
- PCR experimental setup
- Use the primers and temperature found in Table 2. Use the concentrations and reaction conditions found in Table 3. Set up each reaction in triplicate to control for procedural variation.
- Place the PCR reaction tubes/plate in the qPCR system and the run the program loaded into the system from step 7.1.
- Remove the tube at the end of the run, place it on 4 °C and prepare for gel loading.
8. Quantification of LP colonization
- Prepare qPCR mixes for 10 µL or 20 µL reactions according to Table 3.
- LP genomic DNA standard curve 107 to 101 copies/µL
NOTE: Since 4 µL of each dilution will be plated, 107 copies in 4 µL or 2.5 x 10⁶ copies per µL is required in the starting stock. Use the same principle for the rest of the curve.- Prepare a 1:4 dilution: 107 copies per µL in 50 µL.
3.147 µL of LPDNA + 46.85 µL of dH2O = 2.5 x 10⁶ copies per µL - Serially dilute 10-fold: add 5 µL to 45 µL dH2O for 1.25 x 10⁵ copies/µL.
- Plate 4 µL per dilution per well.
- Prepare a 1:4 dilution: 107 copies per µL in 50 µL.
- Visualization of LP amplicons
- Use a 2% agarose gel to reach a clear separation of the ~ 197 bp LP amplified fragment.
- Load 9 µL of each PCR product in the gel.
- Run the gel for 30 minutes at 120 V.
Results
The uniqueness of this method rests in its adaptation of the gavaging technique to the size and frailty of a neonatal mouse. The previous section described the important steps in carrying out a successful gavage procedure on a DOL 2 mouse. To establish a good quantification scale, a standard curve was generated using pure LP DNA with three technical replicates (Figure 2). The standard curve provided a dynamic range of detection of the LP DNA using the primers. The dynamic range was between 7 and 28 cycles where a range of 101 to 107 copies of LP DNA was detected. The steady slope of the standard curve represented the efficiency and scalability of the reaction.
The procedure of IE gavage has been used in adult mice with relative ease. However, the upper gastrointestinal tract of a neonatal mouse is fragile and required calibrated movements of the gavage needle during the procedure. Repeated gavages could increase the chances of intra-esophageal irritation, injury and failure or rejection by the dam due to the handling. Thus, two different gavaging schedules were tested and the intestinal colonization was quantified using DNA from whole intestine homogenates. Mice were gavaged from DOL 2 through DOL 8 with probiotic administered every day or every two days (Figure 3). Each sample contained one technical replicate and every condition had at least two biological replicates. The pups gavaged every day with 7 doses had around 103 copies of LP whereas the pups gavaged every two days with 4 doses had around 105 copies. The consistency of results between the replicates add credit to the precision of technique. There was more LP detected in intestines of pups gavaged every two days in comparison with pups that were gavaged every day. Given this, subsequent experiments were set up with a gavage schedule of every other day as it also reduces the stress for the pups.
It is important to avoid intra-litter probiotic cross contamination when working with probiotics. The microbiome of littermates was expected to be similar as they share the same mother and nesting environment. This proves a problem for probiotic studies if the treatment and control conditions were present within the same litter as the probiotic organism has the potential to become a part of the microbiota ("colonization spread'). To determine if a probiotic will contaminate and colonize untreated littermates, half of a litter was gavaged as above and the intestines were collected for qPCR. Intestinal qPCR analysis of DOL 10 mice showed expected amplification of LP DNA in the gavaged mice but also, to a lesser degree in the non-gavaged littermates (Figure 4). The intestines of the same DOL mice from an untreated cage showed no amplification or minimal amplification at cycles greater than 32. This provided evidence for the communal sharing of the microbiome within a litter in a cage. Thus, for experiments with probiotics the treatment groups should be separated by cages to control for variability through cross contamination. The use of foster dams can be considered if an experiment is to be set up within a litter setting, but confounding effects like diminished care from the foster dam and rejection should be evaluated and optimized for. When mice gavaged until DOL 8 were left untreated for six days and the intestinal DNA was analysed at DOL 14, approximately 10 copies of LP were found (Figure 5). Thus, the colonization of LP was found to be transient and the detectable population diminished over time.
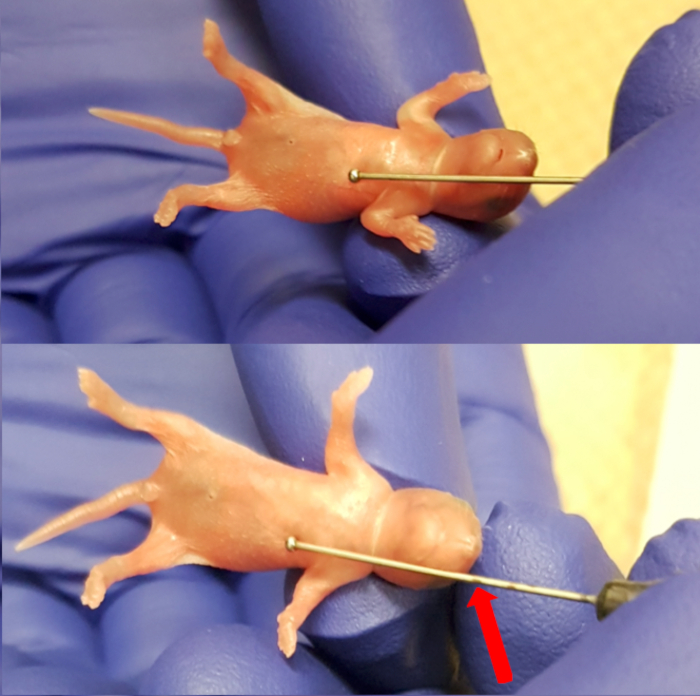
Figure 1. Measuring the length between the xiphoid process (lower end of the sternum) and the snout to make maximum insertion marking for the needle. Please click here to view a larger version of this figure.
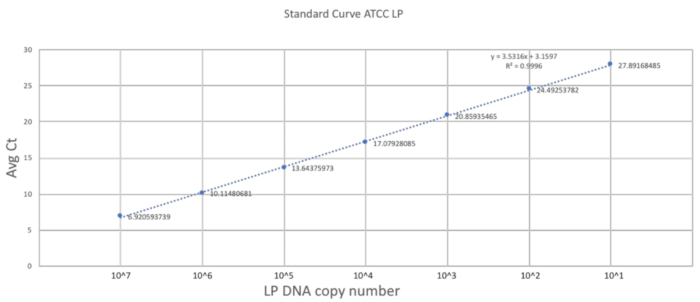
Figure 2. Standard curve established using LP primers and ATCC LP DNA. A serial dilution of the ATCC LP DNA was made to establish the dynamic detectable range for the primers used in the study. Please click here to view a larger version of this figure.
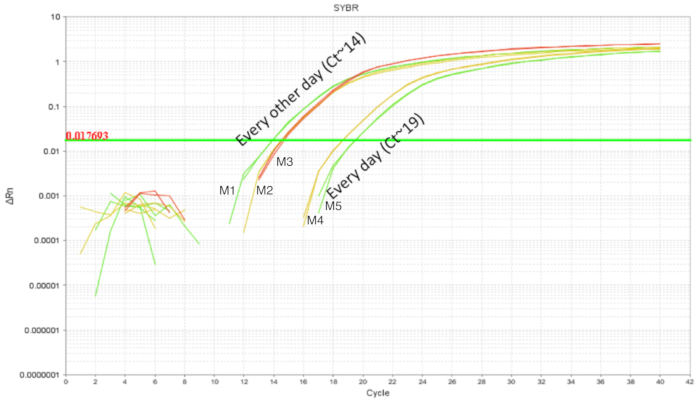
Figure 3. LP amplification of intestinal DNA from DOL 10 pups treated between DOL 2 and DOL 8 in scheduled gavages every day (7 doses) and every other day (4 doses). Gavaging every other day showed higher intestinal LP in comparison with gavaging every day. Please click here to view a larger version of this figure.
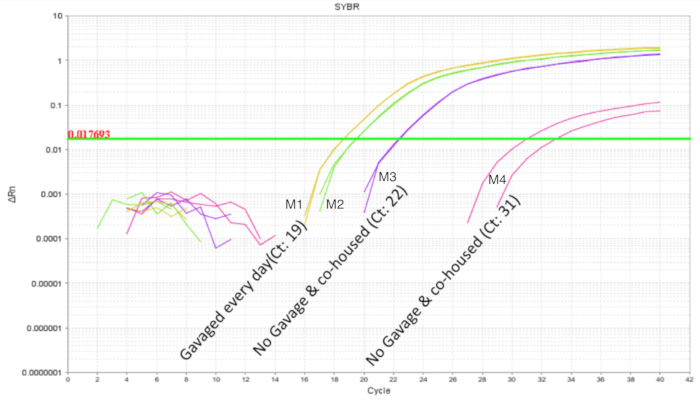
Figure 4. LP amplification of intestinal DNA from DOL 10 pups with 2 treated and 2 untreated in a litter of 4 pups. The gavage was between DOL 2 and DOL 8 in scheduled gavages every day (7 doses). The two probiotic treated pups show the expected amplification profile. The untreated pups show variable amplification of LP indicating communal sharing of the probiotic organism within a litter. Please click here to view a larger version of this figure.
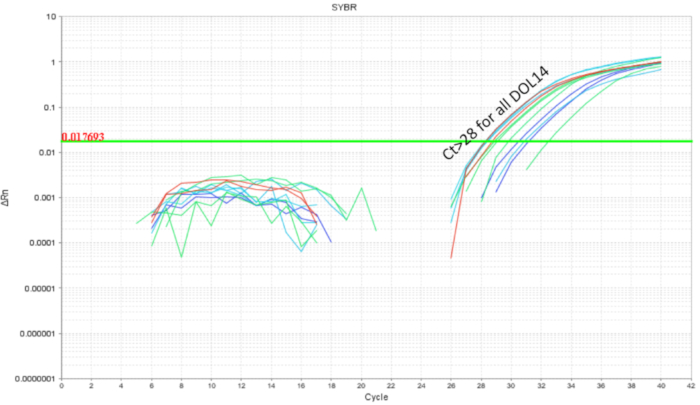
Figure 5. LP amplification of intestinal DNA from DOL 14 pups treated between DOL 2 and DOL 8 in scheduled gavages every day (7 doses) and every other day (4 doses). The LP load drops below cycle 28 indicating clearance of LP over the course of 6 days post last probiotic gavage. Please click here to view a larger version of this figure.
| Step | Temperature | Time |
| 1 | 50 °C | 2 minutes |
| 2 | 95 °C | 3 minutes |
| 3 | 95 °C | 30 seconds |
| 4 | 58 °C | 30 seconds |
| 5 | 72 °C | 30 seconds |
Table 1. qPCR amplification conditions. The temperature and number of cycle conditions for the PCR reaction.
| Target | 16S-23S intergenic spacer region |
| Expected fragment size | 144 bp |
| Primer Tm | 58˚C |
| Forward primer (FP) | Lpn-1: TGG ATC ACC TCC TTT CTA AGG AAT |
| Reverse primer (RP) | Lpn-2: TGT TCT CGG TTT CAT TAT GAA AAA ATA |
Table 2. Details of components of the qPCR reaction. The details on the primers, their annealing temperature and expected fragment size in the PCR reaction.
| Concentration | 10 µL reaction | 20 µL reaction | |
| Template DNA | 200 pg/µL | 1 µL | 1 µL |
| SYBR Master Mix | - | 5 µL | 10 µL |
| FP | 10 µM | 0.3 µL | 0.6 µL |
| RP | 10 µM | 0.3 µL | 0.6 µL |
| dH2O | - | 3.4 µL | 8.8 µL |
Table 3. Per reaction volumes and concentrations. The concentration of reagents and volumes for reactions.
Discussion
The procedure of IE gavage was developed to safely administer a specific dose of a probiotic to neonatal mice. Small amounts of liquid are delivered to the upper gastrointestinal tract using a feeding needle to prevent aspiration while ensuring the delivery of the dosage in confidence. The intestines of the mice were collected for colonization analysis two and six days post gavage. The procedure for DNA extraction was modified to ensure high yield of the probiotic Gram-positive organism. The qPCR analysis of the DNA extracted two days post last gavage showed relatively higher colonization of LP in mice gavaged every two days in comparison to mice gavaged every day between DOL 2-8. There was also a decrease in the amount of LP over six days, showing this probiotic to be a transient organism in the intestines of the mouse. The results of these experiments establish the conditions to conduct research with high rigor in this age group.
To observe the long-term effects of probiotics in neonatal mice, it was administered to neonatal mice on DOL 2; a similar starting time point to the human trial. Oropharyngeal feeding of neonatal mice is previously described in literature and has been carried out only after DOL 5-812,17 when the risk of aspiration is lower due to a well-developed swallowing mechanics. However, oropharyngeal feeding is not well suited for DOL 2 mice as higher rates of aspiration were observed in the pilot study (data not shown). The viscous nature of the probiotic and prebiotic solution added to the risk of aspiration. Following the IE gavaging procedure minimized the risk of aspiration in DOL 2 mice while delivering the desired volume directly to the upper gastrointestinal tract. The success of the procedure was first validated using food coloring infused probiotic gavage. The food coloring acts as a marker that is visible through the skin of the pup. No negative effects were observed in mice gavaged with food coloring, and it is recommended to validate the gavaging procedure in this manner prior to commencing large-scale experiments. The rapid resolution of the gasping reflex seen post gavage can also be used as an additional indicator for a successful gavage. Once the mouse is placed on the heating blanket post-gavage, the gasping reflex will subside and an increase in the breathing frequency will be observed within 20 seconds. The continuation of the gasping reflex for longer than 30 seconds indicates a failed gavage. Successful gavage also depends on appropriate insertion of the feeding needle with the bulb sitting right above the opening of the cardiac sphincter of the stomach. This can be facilitated by ensuring that the marking on the needle measuring the length between the xiphoid process and the tip of the snout, does not go past the snout of the mouse during gavage. This minimizes the chance of injury to the mouse. The frequency of gavage can have a significant impact on the experimental results. Frequent gavaging also can create more stress for the pups and the mother due to constant perturbation of the cage and the nest. The most optimal gavage schedule is when the gavages are the least frequent and over a shorter duration of time without losing the expected effect in the system. To ensure the safety and sterility of the procedure the gavage needle must be sterilized by washing and autoclaving in-between use. Washing rigorously on the outside using a scrub and the inside by forcing water through the needle using a syringe before autoclaving is necessary as any leftover particles can encrust on the needle during autoclaving and can interfere with the gavaging procedure.
Higher LP colonization was observed in pups that were gavaged every other day when compared to pups gavaged every day. This can be due to the reduced stress on pups gavaged every other day and potentially the probiotic getting more nutrients through the relatively more milk ingested by these pups. The dose dependency of probiotic treatment has been previously studied in mouse models18,19 and thus the administration of correct dosage is important. The probiotic solution prepared is plated before every gavage to get an accurate count of CFU administered. If the probiotic organism is anaerobic, it is important to see if there is difference in CFU when cultured aerobically or anaerobically. Since LP is a facultative anaerobe, it was cultured using both methods and no difference in CFU was observed.
The post gavage intestinal LP load analysis was done using qPCR and high-quality DNA samples. To minimize LP DNA contamination between the treatment and the control groups, different feeding needles, biosafety cabinets and surgical equipment were used to ensure highest quality samples. The accurate measurement of the probiotic in the intestine required an optimized DNA extraction method. Most efficient methods for the extraction of DNA from stool involves multiple bead beating steps20,21,22. This method was adopted for the extraction of intestinal bacteria using bead beating and observed diminished representation (<102 copies recovered) of LP in the whole intestine DNA extraction. As LP is a Gram positive organism with a substantial amount of peptidoglycan in the cell wall, the protocol was optimized with a peptidoglycan dissolution step using lysozyme23,24 added to the enzymatic lysis buffer. This increased the representation of LP in the same intestinal sample by greater than two-fold. The lysozyme treatment ensures the dissolution of the outer layer while the bead beating step facilitates the lysis of the organism. Optimization of amount of tissue, the type of garnet bead and the duration of disruption using the beads is necessary for obtaining optimal DNA products to conduct the PCR analysis.
The positive impact of probiotics administered as prophylaxis or treatment in the pre-term and term neonates is evidenced in recent studies25,26,27,28. The establishment of a proper neonatal mouse model for probiotics is warranted to unpack the protective effect of probiotics. This protocol outlined here represents a guide for researchers unfamiliar with neonatal mouse work using probiotics. Notwithstanding the issues with rodent microbiota while studying human health and disease, this method can be extended to research focused on understanding the changes of the microbiome due to probiotics. This model also provides a platform to study host-microbe interaction and immune responses over the course of different developmental stages.
Disclosures
No conflict of interests to disclose.
Acknowledgements
Thanks to the Animal Care Facility staff and the UBC veterinarians for training and assisting in the mouse work at BC Children's Hospital Research Institute. Thanks to the University of British Columbia and the Department of Experimental Medicine for funding the study.
Materials
| Name | Company | Catalog Number | Comments |
|---|---|---|---|
| 1 mL tuberculin syringe with slip tip | BD | 309659 | |
| 1.2% Triton X-100 | Millipore-Sigma | X100-100ML | |
| 2 mM sodium EDTA | Thermo Fisher Scientific | 15575020 | |
| 20 mM Tris·Cl | Thermo Fisher Scientific | 15568025 | |
| 5% dextrose and 0.9% NaCl injection solution | Baxter Corp. | JB1064 | |
| Alphaimager | Alpha Innotech | N/A | Gel imaging system |
| Anaerobic jar | Millipore-Sigma | 28029-1EA-F | 2.5 L |
| BD GasPak EZ anaerobe container system sachets | BD | 260678 | |
| BD Difco Lactobacilli MRS Broth | BD | 288130 | |
| Disruptor Genie | Scientific Industries Inc. | SI-D236 | |
| Feeding/oral gavage needles for newborn mice and rats | Cadence Science Inc. | 01-290-1 | 24 Gauge, 1” needle length, 1.25 mm ball diameter |
| Fructooligosaccharides | Millipore-Sigma | F8052 | from chicory |
| Garnet bead tubes 0.70 mm | Qiagen | 13123-50 | |
| iTaq Universal SYBR Green Supermix | BioRad | 172-5120 | |
| Lactobacillus plantarum (Orla-Jensen) Bergey et al. | ATCC | BAA-793 | for qPCR standard curve |
| Lyophilized probiotic bacteria | N/A | N/A | |
| Lysozyme | Thermo Fisher Scientific | 89833 | |
| Maltodextrin | Millipore-Sigma | 419672 | dextrose equivalent 4.0-7.0 |
| Mini-Sub Cell GT Cell | BioRad | 1704406 | Gel chamber |
| Nanodrop 1000 | Thermo Fisher Scientific | N/A | |
| QIAamp Blood and Tissue kit | Qiagen | 51504 | |
| StepOnePlus Real-Time PCR System | Thermo Fisher Scientific | 4376600 | |
| UltraPure Agarose | Invitrogen | 16500-500 | |
| Ultrapure dH2O | Invitrogen | 10977023 |
References
- Reid, G. Probiotics and prebiotics – Progress and challenges. International Dairy Journal. 18 (10-11), 969-975 (2008).
- Lin, H. C., et al. Oral probiotics reduce the incidence and severity of necrotizing enterocolitis in very low birth weight infants. Pediatrics. 115 (1), 1-4 (2005).
- Panigrahi, P., et al. A randomized synbiotic trial to prevent sepsis among infants in rural India. Nature. 548 (7668), 407-412 (2017).
- Amenyogbe, N., Kollmann, T. R., Ben-Othman, R. Early-Life Host–Microbiome Interphase: The Key Frontier for Immune Development. Frontiers in Pediatrics. 5, 111(2017).
- Ofek Shlomai, N., Deshpande, G., Rao, S., Patole, S. Probiotics for Preterm Neonates: What Will It Take to Change Clinical Practice? Neonatology. 105 (1), 64-70 (2014).
- Elazab, N., et al. Probiotic administration in early life, atopy, and asthma: a meta-analysis of clinical trials. Pediatrics. 132 (3), e666-e676 (2013).
- Arrieta, M. C., et al. Early infancy microbial and metabolic alterations affect risk of childhood asthma. Science Translational Medicine. 7 (307), 307ra152(2015).
- Arrieta, M. C., Walter, J., Finlay, B. B. Human Microbiota-Associated Mice: A Model with Challenges. Cell Host and Microbe. 19 (5), 575-578 (2016).
- Qi, F., et al. Combined effect of BCG vaccination and enriched environment promote neurogenesis and spatial cognition via a shift in meningeal macrophage M2 polarization. Journal of Neuroinflammation. 14 (1), 32(2017).
- Yang, J., et al. Neonatal BCG vaccination of mice improves neurogenesis and behavior in early life. Brain Research Bulletin. 120, 25-33 (2016).
- Deshmukh, H. S., et al. The microbiota regulates neutrophil homeostasis and host resistance to Escherichia coli K1 sepsis in neonatal mice. Nature Medicine. 20 (5), 524-530 (2014).
- Butchbach, M. E. R., Edwards, J. D., Schussler, K. R., Burghes, A. H. M. A novel method for oral delivery of drug compounds to the neonatal SMNDelta7 mouse model of spinal muscular atrophy. Journal of Neuroscience Methods. 161 (2), 285-290 (2007).
- Hickey, L., Garland, S. M., Jacobs, S. E., O’Donnell, C. P. F., Tabrizi, S. N. Cross-colonization of infants with probiotic organisms in a neonatal unit. Journal of Hospital Infection. 88 (4), 226-229 (2014).
- Costeloe, K., et al. A randomised controlled trial of the probiotic Bifidobacterium breve BBG-001 in preterm babies to prevent sepsis, necrotising enterocolitis and death: the Probiotics in Preterm infantS (PiPS) trial. Health Technology Assessment. 20 (66), 1-94 (2016).
- Kitajima, H., et al. Early administration of Bifidobacterium breve to preterm infants: randomised controlled trial. Archives of Disease In Childhood. Fetal and Neonatal Edition. 76 (2), F101-F107 (1997).
- Millar, M. R., Bacon, C., Smith, S. L., Walker, V., Hall, M. A. Enteral feeding of premature infants with Lactobacillus GG. Archives of Disease In Childhood. 69 ((5 Spec No)), 483-487 (1993).
- Preidis, G. A., et al. Probiotics stimulate enterocyte migration and microbial diversity in the neonatal mouse intestine. The FASEB Journal. 26 (5), 1960-1969 (2012).
- Kirjavainen, P. V., El-Nezami, H. S., Salminen, S. J., Ahokas, J. T., Wright, P. F. A. The effect of orally administered viable probiotic and dairy lactobacilli on mouse lymphocyte proliferation. FEMS Immunology & Medical Microbiology. 26 (2), 131-135 (1999).
- Gill, H. S., Rutherfurd, K. J. Viability and dose–response studies on the effects of the immunoenhancing lactic acid bacterium Lactobacillus rhamnosus in mice. British Journal of Nutrition. 86 (2), 285-289 (2001).
- Yu, Z., Morrison, M. Improved extraction of PCR-quality community DNA from digesta and fecal samples. BioTechniques. 36 (5), 808-812 (2004).
- Holland, J. L., Louie, L., Simor, A. E., Louie, M. PCR detection of Escherichia coli O157:H7 directly from stools: evaluation of commercial extraction methods for purifying fecal DNA. Journal of Clinical Microbiology. 38 (11), 4108-4113 (2000).
- Müller, A., et al. A powerful DNA extraction method and PCR for detection of microsporidia in clinical stool specimens. Clinical and Diagnostic Laboratory Immunology. 6 (2), 243-246 (1999).
- Pitcher, D. G., Saunders, N. A., Owen, R. J. Rapid extraction of bacterial genomic DNA with guanidium thiocyanate. Letters in Applied Microbiology. 8 (4), 151-156 (1989).
- Bollet, C., Gevaudan, M. J., de Lamballerie, X., Zandotti, C., de Micco, P. A simple method for the isolation of chromosomal DNA from gram positive or acid-fast bacteria. Nucleic Acids Research. 19 (8), 1955(1991).
- Thomas, C. M., Versalovic, J. Probiotics-host communication. Gut Microbes. 1 (3), 148-163 (2010).
- Tancredi, D. J. Probiotic prevents infections in newborns. Nature. 548 (7668), 404-405 (2017).
- Bernardo, W. M., et al. Effectiveness of Probiotics in the Prophylaxis of Necrotizing Enterocolitis in Preterm Neonates: A Systematic Review and Meta-analysis. Jornal de Pediatria. 89 (1), 18-24 (2013).
- Aceti, A., et al. Probiotics for prevention of necrotizing enterocolitis in preterm infants: systematic review and meta-analysis. Italian Journal of Pediatrics. 41 (1), 89(2015).
Reprints and Permissions
