The squeeze machine, a V-shaped device that provides pressure along the whole body is used in therapy especially for people with autism. Here, we focus on its possible use in experiments to capture the typical transformations of bodily self-consciousness with peri-personal space measurement.
Method Article
Observing the Transformation of Bodily Self-consciousness in the Squeeze-machine Experiment
In This Article
Summary
Abstract
How is our bodily self-consciousness acquired, and how does it affect cognition? To investigate this, we conducted an experiment using the squeeze machine, a device that provides pressure along the length of the user’s whole body. The squeeze machine is used to help autistic people relax. The inventor of the machine, Dr. Temple Grandin says that the squeeze machine, beyond bringing her relaxation, enables her to feel empathy for others. This claim is of considerable interest and raises the following two points; first, the problem of empathy in autism is an important issue and Squeeze Machine could be effective. Second, it suggests that the physical action of Squeeze Machine could provide an insight of mind-body problem to us. Here, we hypothesize that the squeeze machine focuses conscious to direct the bodily self, transforming bodily self-consciousness itself. Such intentionality could bring empathy to others. In this study, we tested whether bodily self-consciousness would be transformed through the squeeze-machine experience. In the first part of the protocol, we simplified the original design of Grandin’s squeeze machine but ensured that it retained its relaxing effect. In the second part of the protocol, we adopted a preestablished method of peri-personal space (PPS) measurement to estimate changes in extended bodily space. The results showed that the boundaries of PPS that appeared in the control experiment disappeared during the use of the squeeze machine. Indeed, collected subjective reports suggest that bodily self-consciousness continually drifted between the point of action of the external force (squeeze-machine pressure) and of an internal force (balance among body parts that are usually not consciously controlled), leading to the abandonment of the immobilization of individual PPS.
Introduction
The squeeze (or hug) machine1 was invented in the 1960s by Temple Grandin, a distinguished zoologist with autism, to help herself relax, as a modification to the design of her cattle crush2 which is a machine that was designed to press cattle along their whole length to calm them. The machine is mainly composed of two panels assembled in a v shape, an actuator to pull the panels together and a lever to control the opening and closing of the panels. The user takes four-posture in it and receives pressure from both sides of the body by closing those panels as controlling the lever by the user’s self. After she began to use it, she found that she became more able to tolerate being touched by others, and she reported its clinical effectiveness for such problems of autistic oversensitivity, which she herself had.3 Later, the benefits of the machine were also recognized for autistic children by Edelson et al., who showed that continual use of the machine significantly reduced tension and anxiety in autistic children,4 and the use of the squeeze machine spread as an occupational therapy device. The calming effects of the machine may be due to such deep touch pressure it provides,3,4 that is a mechanical deformation of the skin and is coupled with stimulation of the underlying fascia and periosteum.5
While other methods of providing deep touch, pressure have been developed and have achieved clinically observed effects in anxious, inattentive, and hyperactive children especially with autism, such as rolling in a gym mat,6 using weighted blankets (or gravity blankets),7,8 or weighted vests,9,10 it appears that the squeeze machine is as effective as these other methods. To Grandin, the machine opens a door connected to the emotional world and tells her what or how to feel empathy for others is.2 The squeeze machine thus not only creates a connection between deep touch pressure and relaxation but also between physical matter and one’s state of mind with regard to an unknown external. Moreover, as it has been found that 62% of normal college students are relaxed by the squeeze machine,1 it is possible that this body-mind linkage could be observed in neurotypical people as well; however, this argument has not been pursued.
Here, we report experiments with the squeeze machine to tackle the mechanisms of bodily self-consciousness in neurotypical adults. While autism has been described with their steep and less flexible gradient from self to other11, the effect of the squeeze machine has come from the situation wherein the users feel themselves both squeezing and being squeezed. In other words, their bodily self-consciousness put into the selfness (to actively squeeze) and the otherness (to be passively squeeze), thus we considered that it may transform their bodily self-consciousness. For this reason, the squeeze-machine experiment is an effective approach to the long-discussed issue of bodily self-consciousness with the following three advantages. First, real bodies are used. While the use of a fake body or a virtual one can provide important insights into our bodily self-consciousness, as in the rubber hand illusion12 or in out-of-body experiences using a head set,13,14 as well as our adaptive ability, the use of the real body in the squeeze machine can allow the intrinsic features of consciousness to be shown in their natural environment. Second, whole bodies are used, namely, the pressed surface is larger, and more dimensions are available to press than the other methods. Weighted vests only press part of the body, and weighted blankets or rolling with a gym mat bring mostly a vertical, downward pressure to bear. In the squeeze machine, users feel vertical pressure on their arms as a baseline, and then the pressure is applied along the body from the side, resulting in the pressure from various directions. Third, it combines both squeezing and being squeezed: the machine’s controls are operated by the users themselves. This unique property evokes the self that exists between passive and active.
In this article, we introduce one preparation and two protocols. Preparation shows how to make a simplified and modified squeeze machine to be convenient for experiments. We show an alternative to the following mechanisms included in the original design and thought to increase the difficulty of production and use: an air cylinder actuator, curved pads for side panels, slide panels for neck and controller box. Protocol 1 shows that our modification of the design produces the same degree of relaxing efficiency as the original machine. Additionally, it also gives a possibility for the variation on our experiments with a brief example, to collect subjective feelings. Protocol 2 shows how the squeeze machine could affect bodily self-consciousness in a general sense. To verify this, we introduced the idea of taking peri-personal space (PPS) measurements which is expected that the result will change with or without the squeeze machine experience.
PPS, the thin space immediately surrounding our body, which roles as a mediator of every physical interaction between the body and the external world,15 has its root in bodily self-consciousness. Interactions between tactile perception and visual or auditory perception are weakened when the presentation position of the visual or auditory stimulus moves away, the representation of PPS is interpreted as a range in which its interaction is preserved. Previously such connection between PPS representation and bodily self-consciousness has been demonstrated empirically. Since bodily self-consciousness could be emerged through the integration process multisensory bodily16, individual PPS boundaries shift to the virtually owned body wherein multisensory inputs integrated consciously17 or even with the inputs under the threshold of conscious perception18. Additionally, PPS representations can be distinguished from body part-centered and full body-centered and both are not completely independent, the former is said to have aspects to refer to the latter19. From that point, it is thought that the benefit of the squeeze machine that affects the whole body is emphasized. Moreover, different methods have been developed to measure the boundaries of the PPS, using its properties and a cross-modal task.15,20,21,22,23 Here, we adopted a dynamic audio-tactile interaction task,15 which has revealed the interaction between our body and environment (see reference24), and can be easily incorporated into the squeeze-machine experiment. This, could form part of a series of methods in which the effectiveness of the squeeze-machine experiment as self-consciousness research could be determined.
Protocol
All methods described here have been approved to follow the guidelines of the Academic Research Ethics Research Committee of Waseda University. Following these guidelines, this study received an approval waiver in advance by self-check. No identifying information was collected from the participants, who were informed of the general experimental procedures and goals; each provided written consent.
1. Preparations: Make a Squeeze Machine
- Replication of the original design
- Construct a main body of squeeze machine with two side panels (42” x 28”) (these and all other panels are 3/4-inch-thick wooden board) to press the user, one base panel (48” x 32”), one front panel (36” x 32”), one pressure mechanical panel (36” x 28”) to mount the actuator, and an actuator to pull the side panels together (Figure 1A,B) along to the Grandin’s description.25,26
- Modification from the original design
- In place of an air cylinder actuator in the original design, adopt a motor liner actuator (Figure 1(A)).
- In place of curved pads constructed with a 1 inch-thick wooden board and attached inside each side panel in the original design, put bead-filled cushions (Figure 1(A)).
- Omit the two padded sliding panels to grip the user’s neck.
- In place of the controller box to open and close the side panels by means of a lever implemented, connect two control buttons to the actuator.
- Insert a microcomputer between the control buttons and the actuator, with two signal switching relays (Supplementary figure 1). Upload a program (Supplementary code 1) to modify the open and close commands as necessary.
2. Protocol 1: Free Use of the Squeeze Machine
- Standard conditions
- Use more than 16 participants who are healthy adults (approximately age 18–30, regardless of gender) without the history of major illness and naïve to the experiment in order to refer to previous research15 and speaking the same native language to collect subjective report. Conduct the experiment with each participant separately.
- Upload an appropriate program (Supplementary code 1) to the microcomputer. Show the participant how to use the machine: demonstrate entering it and controlling it, without informing the participant of the purpose of the machine. Ask the participant to use it for several minutes. Inform the participant that reactions about the feeling produced by the machine are welcomed.
- Aid the adjustment of the machine to enable easy entry and help fit the cushions to the participant’s preference. Check the maximum closure and ensure it is neither too tight nor too loose. Adjust the space between the two side panels using the sliding side adjusters if it needs.
- Let the participants use the machine for 5 min, recording their verbal responses. Observe to ensure nothing is going wrong with either the participant or the machine.
- Ask the participants to rate their state of relaxation on two scales from 1 to 10: the poles of the first are “very excited” and “almost asleep",3 and the poles of the other are “not relaxed” and “relaxed.” After the participant has completed the use of the machine, ask, “How did you feel while using it?” Collect the answers as subjective reports along with what was spoken during use.
- Sporadically uncontrollable conditions: Upload an appropriate program (Supplementary code 1) to the microcomputer to flip the reaction of the actuator once every two pushing control buttons by the participants, without informing them. After this, perform steps from 2.1.3 to 2.1.5.
3. Protocol 2: PPS Measurement
- Set up the experimental system: In this experiment, participants are asked to immediately report when they feel a tactile stimulus from a vibration motor attached to the left index finger, which is presented with or without sound. The response times (RTs) are collected.
- Place a speaker near the hand rest of the squeeze machine (near the speaker) and another approximately 100 cm away from the first (far the speaker). Additionally, prepare a vibration motor (approximately half an inch in length) and a push button placed near the right index finger to collect RTs (Figure 2).
- Create two kinds of 3 s sound sources, one producing pink noise at 44.1 kHz, with an exponentially rising acoustic intensity from 55 to 70 dB Sound Pressure Level (IN-sound) and the other the opposite, with falling intensity (OUT-sound), as measuring the sound level with an audiometer at the head rest of the squeeze machine. Create the sounds as follows: make the 55 dB sound with the near speaker silent, the 70 dB sound with the far speaker silent, and intermediary sounds with a proportional mix between the speakers, to give the impression that the sound is approaching the participants from the in sound and is leaving from them to the out sound.
- Create an experimental system that presents IN- or OUT- sounds and one tactile stimulus, as shown in Figure 3. Randomly arrange four trials for each condition (T0–T6 or no tactile stimulus with the IN- or OUT- sound, 64 trials in total) for one set.
- Give to the participants the following three instructions: report the timing of the tactile stimulus using the button as soon as you feel it, try to ignore the sounds, and the trial will be repeated multiple times for around six minutes. Conduct a training session with three trials to ensure that the participants understand the task.
- Squeezed conditions
- Let the participants use the machine freely for 5 min and adjust it to their comfort. Remove the control button and attach the vibration motor to the participants’ left index fingers. Then place their right index finger on the response button on the hand rest of the squeeze machine (Figure 2(A)).
- Begin one set of trials. After 3 min break, repeat step 3.2.1 and begin another.
- Control conditions
- Open the squeeze machine entirely and remove the cushions. Instruct the participants to lie in it as if they were using the squeeze machine within the empty machine. Place a vibration motor on the participant’s left index finger, attaching it to a vibration motor, and place the right index finger on the button on the hand rest of the squeeze machine (Figure 2(B)).
- Begin one set of trials. After a 3 min break, begin another.
- Data analysis
- Exclude any RTs not within 150–1,000 ms which are not expected to be valid cross-modal responses.15,23 Calculate means and standard errors of RTs for all conditions.
- Express the best-fitting sigmoidal functions with mean RTs of T1–T5 for each of the four conditions ([squeezed or control condition] x [IN- or OUT- sound]). Use a sigmoidal function described by the following equation15,27:
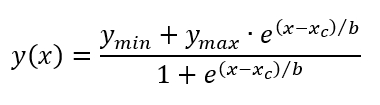
where x represents the independent variable (timing of T1–T5), y the dependent variable (RTs), ymin and ymax the lower and upper saturation levels of the sigmoid, xc the value of the abscissa at the central point of the sigmoid and b provides the slope of the sigmoid at xc.15,27
Results
The participants were 17 healthy students attending Waseda University (nine males; mean age 22.1 years, range 18–27; mean height 164.4 cm, range 150–185). All participants were naïve to the experimental tasks and native Japanese speakers.
Subjective reports collected through Protocol 1 lead following three observations. First, the same degree of the relaxation effect as the original design25,26 with the modified machine was observed. As shown in Figure 4(A), under the standard conditions, 13 participants (76.5%) gave a score of greater than or equal to 6, more toward the side of “almost sleeping” and away from “very excited” (mean score = 6.47, SD = 1.65), and 14 participants (82.4%) gave a score of 6 or greater, closer to “relaxed” than “not relaxed” (mean score = 6.53, SD = 1.72). Thus, among our participants, the majority were relaxed, and the percentage of relaxed respondents was greater than that found in a previous study (62%).1 This suggests that our modification of Grandin’s original design is appropriate at least for neurotypical adults.
Second, various reactions to the uncontrollable conditions. Under the sporadically uncontrollable conditions, eight participants (47.1%) gave a score of greater than or equal to 6, closer to “almost sleeping” than “very excited” (mean score = 5.94, SD = 2.10), and seven participants (41.2%) gave a score of 6 or greater, closer to “relaxed” than “not relaxed” (mean score = 5.77, SD = 1.73; Figure 4(B). Therefore, the number of participants who received a relaxing effect was lower than that under the standard conditions. Moreover, there were significant differences between those two conditions in both scales (both p > 0.05, t-test). However, as shown in Figure 4(C), a comparison of the scores for the two conditions per subject showed a difference in scores that was widely distributed, from -6 to +6 (“almost sleeping” vs “very excited” scale: mean score = 0.53, SD = 3.05; “relaxed” vs “not relaxed” scale: mean score = 0.77, SD = 2.18). This indicates that the controllability of the machine influences relaxation, but the conditions with a certain degree of uncontrollable can also be relaxing for some.
Third, the bodily self-consciousness between the two releases. The following two kinds of release experiences in the squeeze machine were reported by the participants. In the first, there was a release of force from the outside of the body. This appeared in certain reports that stated, “I felt the most relaxation when the panel opened.” In other words, when the machine opened, they noticed that their body was being freed from the force that it had been receiving from the machine. The second involves the release of force from the inside of the body. We received other reports, “being on all fours is usually painful, but because the side of my body was supported by the machine, it was not painful but comfortable” or “I felt like I was floating.” That is, when the machine was closed, their bodies felt free from the internal forces that usually arise from the mutual support of the parts. For this reason, users can experience these two releases (implicitly or explicitly) by opening and closing the machine. It is notable that this will lead to expressing intentionality of consciousness through the bodily self as a point of action of forces.
Additionally, PPS measurement in Protocol 2 revealed the general tendency of the transformation of bodily self-consciousness. Initially, we excluded one participant’s data because of an equipment malfunction and 14 individual RTs because they were not within the range 150–1,000 ms,15, 23 including no response. In the control conditions with the IN-sound, mean RTs fell sharply after T3 (Figure 5(A), red line). Among RTs of neighboring points while the sound was playing (T1–T5), there was only a significant difference between T2 and T3 (p = 0.0038, t-test). Moreover, the RTs in that interval fit a sigmoidal function well (AIC = 23.4). Under the control conditions with the OUT-sound, although there was also a significant difference between T2 and T3 (p = 0.019, t-test), those RTs were flat overall and did not fit a sigmoidal function well (Figure 5(A), blue line). This result, a sigmoidal behavior is appeared only with IN-sound, coincides with that of a previous study15 that we reviewed. Therefore, as in previous studies, this boundary can be interpreted as a representation of the boundary of each person’s PPS. By contrast, in the squeezed condition, the RTs showed no sharp decrease for the in or out sound (Figure 5(B)). There was no significant difference between the RTs of each neighboring point (p > 0.05, t-test). Furthermore, for each of T0–T6, when comparing the mean RTs of the two conditions with the IN-sound, significant differences were detected in T3 to T6 (T3: p = 0.0083, T4: p = 0.0047, T5: p = 0.0052, T6: p = 0.0036, t-test). While no sound T0, T6 has been interpreted as baselines19,24 of responses, there was no significant difference between them, that suggests that squeezing did not degrade their performance. From this also, it can be confirmed that the squeeze experience eliminates the increase in the response speed to the approaching sound. Hence the squeezed condition extinguished the representable boundary of PPS, namely, the extended bodily space. These results demonstrate that the squeeze machine could contribute to the transformation of bodily self-consciousness.

Figure 1: The modified squeeze machine. (A) Use of the squeeze machine. The user enters it on all fours and squeezes his or her own body by using the open and close buttons. (B) Appearance with no cushion. (C) The bead that fills the cushions. The 1 mm expanded polystyrene beads that fill the cushion allow it to change shape easily and fit anyone’s body or bodily position. Please click here to view a larger version of this figure.
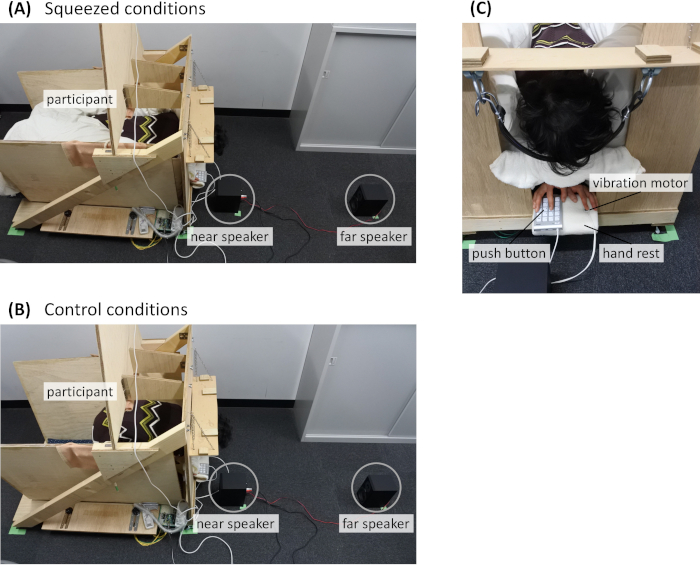
Figure 2: Experimental setup for measurement of peri-personal space (A) for squeeze conditions with cushions and pressing, (B) for control conditions without cushions or pressing, and (C) for both, to present tactile stimuli (a vibration motor) and to collect the response times (a push button). Please click here to view a larger version of this figure.
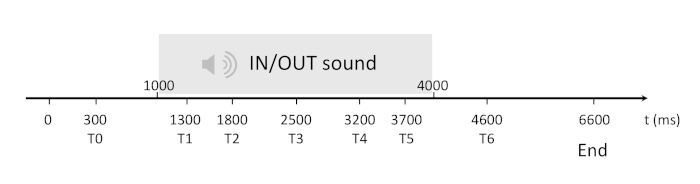
Figure 3: The time sequence of the trial of measurement of peri-personal space. After 1,000 ms of silence, three seconds of the IN- or the OUT- sound is given. No tactile stimulus or one is presented at a timing shown as T0–T6 per each trial. Immediately after 2,000 ms of silence following the sound, the next trial begins. Please click here to view a larger version of this figure.
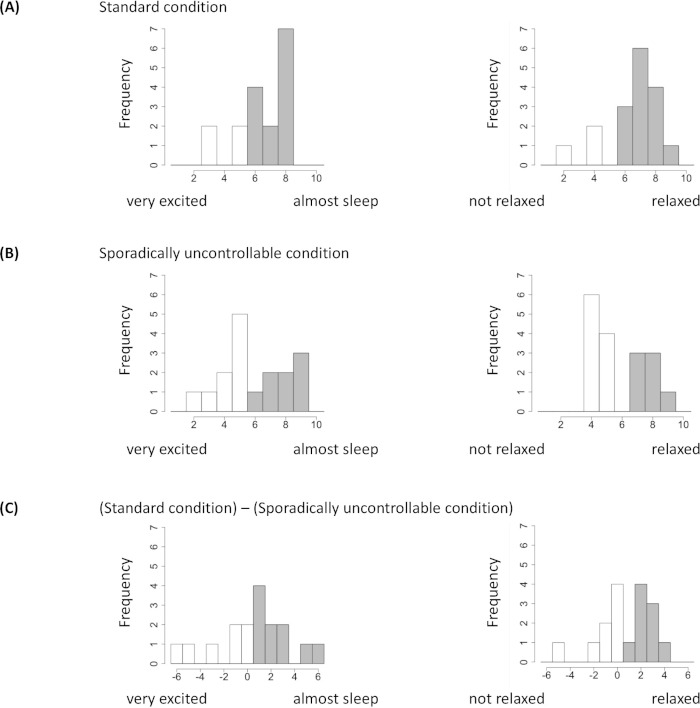
Figure 4: Histograms of subjective ratings. (A) In the standard conditions, 76.4% responded that they felt a sleepy feeling (left, scores 6–10, filled boxes; score 6: 4, score 7: 2, score 8: 7 and totally 13 people), and 82.4% answered that they had a relaxed feeling (right, scores 6–10, filled boxes; score 6: 3, score 7: 6, score 8: 4, score 9: 1 and totally 14 people), suggesting that the machine had a high relaxation effect for normal adults. (B) Under the sporadically uncontrollable conditions, 47.1% responded that they had a sleepy feeling (left, scores 6–10, filled boxes; score 6: 1, score 7: 2, score 8: 2, score 9: 3 and totally 8 people), and 41.2% responded that they had a relaxed feeling (right, scores 6–10, filled boxes; score 7: 3, score 8: 3, score 9: 1 and totally 7 people). However, (C) the difference between the scores from the standard condition (A) and those of the sporadically uncontrollable conditions (B) indicates that those who had a much greater relaxation effect when the reaction of the machine was controllable (score more than 0, filled boxes; score 1: 4, score 2: 2, score 3: 2, score 5: 1, score 6: 1 and totally 10 people) were not a large majority for either or both scales (sleepy feeling, left: 58.8%; relaxed feeling, right: 52.9%; score 1: 1, score 2: 4, score 3: 3, score 4: 1 and totally 9 people). Please click here to view a larger version of this figure.
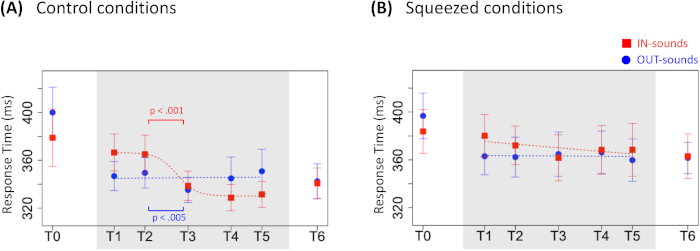
Figure 5: Mean response times (RTs) of measurement of peri-personal space. (A) Under the control conditions, there were significant differences between the mean RTs for T2 and T3 with IN-sound (p = 0.0038) and with OUT-sound (p = 0.019). Moreover, only during IN-sound (for T1–T5) was good fitness to a sigmoidal function (Akaike information criterion = 23.4) found. Meanwhile, (B) in the squeezed condition, there were no significant differences (p > 0.05) between the mean RT for a certain point and the following. Error bars denote standard error of the mean. Please click here to view a larger version of this figure.
Supplementary Figure 1: Circuit diagram around the microcomputer. In this system in order to manipulate the control signals, at first the signals from the control buttons are input to pin 7 and 8 of the microcomputer. Then operated signals are output from pin 12 and 13 to the actuator. Please click here to download this file.
Supplementary Code 1: Sample code for Protocol 1. Set the constant value named with “type” (line 2) to 1 for Step 2.1 and to 2 for Step 2.2. When the it is set to 1, the open/close button always opens/closes the side panels. And when it is set to 2, flip the reaction of the side panels once every two pushing control buttons. This code is valid when the microcomputer is connected as shown in Supplementary Figure 1. Please click here to download this file.
Discussion
Until today, the squeeze machine had remained a relaxation device, especially in the field of occupational therapy. However, this study shows the potential of the squeeze machine to transfer bodily self-consciousness in normal adults. For this purpose, as preparation, we showed improvement of the design which is easy to make and enables various experiments. Protocol 1 is provided to make sure that the original relaxing effect is maintained and to introduce an example of experimental diversification. Finally, Protocol 2 demonstrates users altered bodily self-consciousness using a behavioral study, combining the squeeze machine with PPS measurement. The results indicated that the boundary of each person's PPS was observably eliminated in the free use of a squeeze machine for five minutes. Thus, step 3.2 in which squeeze machine experience and PPS measurement are combined could be regarded as the critical step in this study.
Moreover, we made five modifications from the original design and that provide the following benefits for experimental uses respectively: First, a motor liner actuator is easier to obtain and almost maintenance-free. Second, bead-filled cushions can enlarge the contact surface area, independent of the user’s shape or bodily position. Third, the omission of the two padded sliding panels enable to save some processes of work and the weight. Fourth, In the original design, there is a controller box that is opened and closed by means of a lever implemented, forcing the user to reach out to manipulate the lever. In place of this, two push buttons are added, freeing the user’s hands. Finally, further use of a microcomputer, as introduced into the squeeze machine in this study, would allow us to design additional variant experiments. As a brief example, this study showed that sporadically uncontrollable conditions gave rise to diverse experiences of the controllable conditions.
As a future application, this protocol could be arranged to focus on the role of such unexpected stimuli with regard to users, which has been studied previously. For example, Krauss made a device with two air mattresses pressing up against a participant from the participant’s chest to calves, where pulling a rope would allow the participant to lay themselves into a supine position. He compared this case to one where pulling and pressure were linked and to one where they were not linked. He found that the self-controlled pressures reduced the user’s anxiety, but the alternative did not.5 Additionally, the self-tickling machine investigated by Blackmore and her colleagues made users ticklish only when the reaction from the machine was activated, such as when an unexpected temporal delay was added. They concluded that tickling sensation relative to tactile stimuli would change depending on whether the stimuli was felt as produced by oneself or by another.28 Placed in the context of these findings, in our case, where the reaction was flipped once every two times, it may be thought that the participants would not uniformly judge the reactions to be self-produced or other-produced. However, it would be the same as a system that has completely random reactions or that is automatically in motion. Furthermore, it is to be expected that the state of conscious intentionality differs among cases with self-produced stimuli, cases with other-produced stimuli, and cases with fuzzy boundaries among self-produced and other-produced stimuli. Here, it can be thought that the conflicts between self-produced and other-produced are altered by confusing active and passive. The squeeze machine is an appropriate device to make such alteration and fuzziness due to the nature that squeezing (active) and being squeezed (passive) is compatible. One of the possible ways to induce such active and passive confusion is including autonomic nervous system such as heart beat in the squeeze machine. The study of these relationships can help us approach the mechanism of our bodily self-consciousness; this will be possible with the varied and novel uses of squeeze machines in experiments.
Additionally, here we propose more possible modifications of our protocol both in collecting subjective and objective data. First, for subjective data, this study tested two scales, one from “very excited” to “almost asleep” and the other from “not relaxed” to “relaxed.” The first was set for consistent discussion with the original study;1,3 however, certain participants reported both relaxation and excitement because the experience was interesting. Thus, it might be preferable to use only the second scale. We also found that subjective reports could be used for the observation of the transformation of participants’ bodily self-consciousness. For example, one reported, “I felt as if the cushions were fused with my own body, and the body swelled or shrank in conjunction with opening and closing.” Thus, by using a method of collecting subjective reports, it will be possible to observe explicit changes in bodily self-consciousness in greater detail. Second, for objective data from PPS measurement, in this study the tactile stimulus provided to the participants’ finger. This body part has been used in the original15 and follow-on numbers of PPS measurement studies, especially in the context of the self-other boundary.27,29 However, there are other methods with stimuli on the forehead, back or trunk in order to much focus on the whole-body PPS representation. This protocol with the squeeze machine is easy to modify to attach the vibrator on the forehead or back. Meanwhile, giving stimuli on the front trunk is not impossible but the influence of compression from the cushion to the mounting part must be taken into consideration. Additionally, modification to other bodily positions is also considered since the affection of vestibular signals to PPS boundaries has been found.30 Note that the two conditions in Protocol 2 were aligned to face down so that the influence of vestibule signals could be thought to be eliminated.
As mentioned above, the squeeze machine can be used by both neurotypical people and autistic people. This indicates that some properties of bodily self-consciousness are shared by a wide segment of the population. Here, we propose to discuss this issue on the basis of the intentionality of consciousness. One psychiatric theory21 points that neurotypical people intuit others’ mind in places having intentionality, and they recognize others as a unity centered on intentionality. Additionally, missing of notice of others’ intentionality is related to the findings of developmental disorder of autism. They also have problems with “intentional empathy”,31 which is distinguished from another kind of empathy, namely “instinctive empathy” or sympathy.32 These insights could be connected to the Grandin’s experience with squeeze machine, that is, she was taught to feel empathy from the machine via forming intentionality. Meanwhile, the disappearance of the boundary of PPS observed in this study can be thought to be a state where the intention to bodily self is directed outside the usual boundary. In this way, individual state of intentionality and how one recognizes the bodily-self, others or the external, are linking each other for all. Detailed observation of such linkage may entail the investigation of collecting one’s reactions to the squeeze machine and one’s individual character traits.
Disclosures
The authors have nothing to disclose.
Acknowledgements
This work was supported by JSPS KAKENHI Grant Number 18K18346 and Waseda University. We would also like to thank Kei Kojima for participation in the video protocol.
Materials
| Name | Company | Catalog Number | Comments |
|---|---|---|---|
| beads-filling cushion | Takikou sewing Ltd. | Hito wo dame ni suru cushion | for the Squeeze machine, size: 135 × 70 × 20 cm |
| linear actuator | LINAK K. K. | 2391102000200B4 | for the Squeeze machine, trust: 1,200 N |
| microcomputer | ARDUINO | Arduino Uno | for the Squeeze machine |
| speaker | FOSTEX | PM0.4CBJPN | for PPS measurement |
| signal switching relay | OMRON Corp. | G6E-134 | for the Squeeze machine |
| vibration motor | Tokyo Parts Industrial Co., Ltd. | FM34F | for PPS measurement, size: φ12 mm, standard speed: 13,000 rpm |
References
- Levy, S., Grandin, T. The Effect of Early Intervention on the Diagnosis of Autism. Journal of Autism and Developmental Disorders. 13 (2), (1983).
- Sacks, O. An anthropologist on Mars: Seven paradoxical tales. , Picador. London. (1995).
- Grandin, T. Calming effects of deep towels pressure in patients with autistic disorder, college students, and animals. Journal of Child & Adolescent Psychopharmacology. 2, 63-72 (1992).
- Edelson, S. M., Goldberg, M., Edelson, M. G., Kerr, D. C., Grandin, T. Behavioral and physiological effects of deep pressure on children with autism: A pilot study evaluating the efficacy of Grandin’s Hug Machine. American Journal of Occupational Therapy. 53, 145-152 (1999).
- Krauss, K. E. The effects of deep pressure touch on anxiety. American Journal of Occupational Therapy. 41, 366-373 (1987).
- Ayres, A. J. Sensory integration and the child. , Western Psychological Services. Los Angeles. (1979).
- Champagne, T., Mullen, B. The Weighted Blanket: Use and Research in Psychiatry. , MAOT. (2005).
- Mullen, B. S., Champagne, T., Krishnamurty, S., Dickson, D., Gao, R. X. Exploring the safety and therapeutic effects of deep pressure stimulation using a weighted blanket. Occupational Therapy in Mental Health. 24, 65-89 (2008).
- VandenBerg, N. L. The use of a weighted vest to increase on-task behavior in children with attention difficulties. The American Journal of Occupational Therapy. 55, 621-628 (2001).
- Morrison, A. P. A review of research on the use of weighted vests with children on the autism spectrum. Education. 127, 323-327 (2007).
- Noel, J. P., Cascio, C., Wallace, M. T., Park, S. The spatial self in schizophrenia and autism spectrum disorder. Schizophrenia Research. 179, 8-12 (2017).
- Botvinick, M., Cohen, J. Rubber hands ‘feel’ touch that eyes see. Nature. 391, 756(1998).
- Lenggenhager, B., Tadi, T., Metzinger, T., Blanke, O. Video ergo sum: manipulating bodily self-consciousness. Science. 317, 1096-1099 (2007).
- Ehrsson, H. H. The experimental induction of out-of-body experiences. Science. 317, 1048(2007).
- Canzoneri, E., Magosso, E., Serino, A. Dynamic sounds capture the boundaries of peripersonal space representation in humans. PLoS ONE. 7, e44306(2012).
- Blanke, O., Slater, M., Serino, A. Behavioral, neural, and computational principles of bodily self-consciousness. Neuron. 88, 145-166 (2015).
- Noel, J. P., Pfeiffer, C., Blanke, O., Serino, A. Peripersonal space as the space of the bodily self. Cognition. 144, 49-57 (2015).
- Salomon, R., et al. Unconscious integration of multisensory bodily input in the peripersonal space shapes bodily self consciousness. Cognition. 166, 174-183 (2017).
- Serino, A., et al. Body part-centered and full body-centered peripersonal space representations. Scientific Report. 5, 18603(2015).
- Spence, C., Pavani, F., Driver, J. Crossmodal links between vision and touch in covert endogenous spatial attention. Journal of Experimental Psychology: Human Perception and Performance. 26, 1298-1319 (2000).
- Bassolino, M., Serino, A., Ubaldi, S., Ladavas, E. Everyday use of the computer mouse extends peripersonal space representation. Neuropsychologia. 48, 803-811 (2010).
- Aspell, J. E., Lavanchy, T., Lenggenhager, B., Blanke, O. Seeing the body modulates audiotactile integration. European Journal of Neuroscience. 31, 1868-1873 (2010).
- Murray, M. M., et al. Grabbing your ear: Auditory–somatosensory multisensory interactions in early sensory cortices are not constrained by stimulus., alignment. Cerebral Cortex. 15, 963-974 (2005).
- Serino, A., et al. Peripersonal space: an index of multisensory body–environment interactions in real, virtual, and mixed realities. Frontiers in ICT. 4, 31(2018).
- Grandin, T. My experiences as an autistic child. Journal of Orthomolecular Psychiatry. 13, 144-174 (1984).
- Grandin, T., Scariano, M. M. Emergence Labeled Autistic. , Arena Press. Novato, CA. (1986).
- Teneggi, C., Canzoneri, E., Pellegrino, E., Serino, A. Social modulation of peripersonal space boundaries. Current Biology. 23, 406-411 (2013).
- Blakemore, S. J., Frith, C. D., Wolpert, D. W. Spatiotemporal prediction modulates the perception of self-produced stimuli. Journal of Cognitive Neuroscience. 11, 551-559 (1999).
- Maister, L., et al. Your place or mine: Shared sensory experiences elicit a remapping of peripersonal space. Neuropsychologia. 70, 455-461 (2014).
- Pfeiffer, C., Noel, J. P., Serino, A., Blanke, O. Vestibular modulation of peri-personal space boundaries. European Journal of Neuroscience. 47, 800-811 (2018).
- Utsumi, T. Igaku-Shoin Ltd. , ISBN-10: 4260024086 (2015).
- Frith, U. Autism: Explaining the Enigma. , Basil Blackwell, Oxford. (1989).
Reprints and Permissions
