System-wide analysis of multiple biomolecules is crucial to gain functional and mechanistic insights into biological processes. Hereby, an extensive protocol is described for high throughput extraction of lipids, metabolites, proteins and starch from a single sample harvested from synchronized Chlamydomonas culture.
Method Article
A Multi-Omics Extraction Method for the In-Depth Analysis of Synchronized Cultures of the Green Alga Chlamydomonas reinhardtii
In This Article
Summary
Abstract
Microalgae have been the focus of research for their applications in the production of high value compounds, food and fuel. Moreover, they are valuable photosynthetic models facilitating the understanding of the basic cellular processes. System wide studies enable comprehensive and in-depth understanding of molecular functions of the organisms. However, multiple independent samples and protocols are required for proteomics, lipidomics and metabolomics studies introducing higher error and variability. A robust high throughput extraction method for the simultaneous extraction of chlorophyll, lipids, metabolites, proteins and starch from a single sample of the green alga Chlamydomonas reinhardtii is presented here. The illustrated experimental setup is for Chlamydomonas cultures synchronized using 12 h/12 h light/dark conditions. Samples were collected over a 24 h cell cycle to demonstrate that the metabolites, lipids and starch data obtained using various analytical platforms are well conformed. Furthermore, protein samples collected using the same extraction protocol were used to conduct detailed proteomics analysis to evaluate their quality and reproducibility. Based on the data, it can be inferred that the illustrated method provides a robust and reproducible approach to advance understanding of various biochemical pathways and their functions with greater confidence for both basic and applied research.
Introduction
Microalgae are a rich source of natural products (e.g., fuels, human and animal nutrition, cosmetics and pharmacological substances). Numerous research efforts are carried out to enhance the efficiency of the production of high value products from microalgae1,2,3,4. Systems-level understanding of metabolism is a pre-requisite to improve the quality and the yield of natural products5,6,7. With the advent of functional genomic techniques and improved mass spectrometry methods, thousands of genes, transcripts, proteins, and metabolites can be monitored simultaneously. However, multiple samples are required for in-depth proteomics, lipidomics and metabolomics studies, which is often difficult to achieve in unicellular organisms, especially if time course studies are to be performed. Moreover, collection and processing of different sample aliquots in combination with different protocols to collect the highly complex omics data (i.e., proteomic, lipidomic, and metabolomics) introduces variability, thus making the integration of data a challenging task.
Chlamydomonas provides not only an excellent microbial system for the investigation of cellular processes, but also a convenient model to study the coordination of cell cycle and metabolism. Accordingly, a strong coordination of the transcripts expression with cell cycle has been shown using high resolution transcriptome profiling of synchronized culture of Chlamydomonas8. About 80% of the analyzed transcripts exhibited robust periodicity over a 24 h cell cycle8. Likewise, dry weight, proteins, chlorophyll, amino acids and fatty acids of two different strains of Chlamydomonas were shown to correlate with cell division in a study where sampling was performed every 4 h9. Recently, it was reported that the metabolite and lipid dynamics of the cell shift based on specific phases of the cell cycle10. The subtle changes in different biomolecules were possible to monitor using a robust methyl tert-butyl ether (MTBE): methanol: water-based extraction method, which offers an ideal starting point for comprehensive multi-omics analysis10,11.
The presented protocol guides through a reproducible and efficient strategy10, for the simultaneous extraction of lipids, metabolites, proteins and starch from a single sample aliquot, for the time resolved metabolomic and lipidomic study of synchronous growing Chlamydomonas cultures. In addition to illustrating the robust and reproducible metabolic and lipidomic data10, here, the quality of the proteomic samples obtained from the same pellet is also demonstrated.
Protocol
1. Pre-cultures of Chlamydomonas reinhardtii
- Prepare the pre-cultures of Chlamydomonas reinhardtii (strain wild type CC-1690 mt+) by transferring cells from solid plates of TAP medium to Erlenmeyer flasks with 200 mL of HSM medium12.
- Grow the pre-cultures on a rotatory shaker at 24 °C at 100 µmoles·m-2·s-1 continuous light until the cell density reaches ~ 2 x 10⁶ cells/mL.
2. Synchronization of Chlamydomonas liquid cultures in fermenters
NOTE: The parameters presented in this protocol, such as temperature, light and CO2, are specific to synchronization of the strain CC-1690 mt+. In order to develop a synchronized culture using another strain, it is necessary to test the optimal conditions.
- Transfer the pre-culture to a fermenter system (see Supplementary Figure 1 for the custom-made fermenter design), connected to a recirculating cooler to maintain the temperature, with bubbling of filtered CO2 (2%, v/v) and stirred with a magnetic stir bar at the bottom of the fermenter with constant agitation.
- To initiate the synchronization, set the fermenter at light-dark regime of 12:12 h, under 34 °C and 200 µmoles·m-2·s-1 light and ensure it contains 500 mL of culture in HSM medium with a cell density of 1 x 10⁶ cells/mL.
- At the end of 24 h cycle, re-dilute the culture to 1 x 10⁶ cells/mL with fresh HSM medium with minimal perturbation by using a tube system in combination with peristaltic pumps, which allows to first pump a distinct amount of culture out and afterwards pump in autoclave-sterilized medium.
NOTE: As an alternate to peristaltic pumps, inoculating syringes can be used to withdraw the culture, while the required volume of fresh medium can be added directly into the fermenter under sterile conditions. - Repeat step 2.3 three times to obtain the synchronized cultures on 4th day of inoculation.
- In order to validate synchrony of cells, harvest samples at an interval of every 2 h and measure the cell density and cell volume using a cell counter and size analyzer (see Table of Materials). Depending on the cell density, dilute the samples between 1:10 to 1:100 and measure in a size range of 30 – 1900 µm3.
3. Harvesting Chlamydomonas cells
- Label 15 mL conical centrifuge tubes and prepare a dewar filled with liquid nitrogen.
- Harvest samples using a syringe (50 cm3) through the inner glass tube of the fermenter. Distribute the sample into conical centrifuge tubes which should contain 10-15 x 106 cells. Note the volume transferred to each tube and measure the cell density and the cell size of each time point using cell counter and size analyzer (see Table of Materials)
- Pellet the cells by centrifugation for 5 min at 4000 x g. Then discard the supernatant, freeze the pellets in liquid nitrogen and later store at -80 °C.
4. Preparation of extraction buffers and extraction chlorophyll, lipids and metabolites
CAUTION: Methanol (MeOH) and MTBE are flammable and can cause irritation of respiratory tract, eye or skin on prolonged exposure and/or contact. Please handle them carefully only in a fume hood and use the appropriate safety procedures during the extraction (lab coat, safety glasses, gloves, etc.).
- Extraction Buffer 1
- In a 100 mL volumetric flask, add 75 mL of MTBE, 25 mL of MeOH (UHPLC grade) and homogenize (3:1, vol/vol).
- Add the following internal standards solution: 50 µL of corticosterone (1 mg/mL in MeOH), 50 µL 1,2-diheptadecanoyl-SN-glycero-3-phosphocholine (17:0 PC) (1 mg/mL in chloroform HPLC grade), 25 µL of ampicillin (1 mg/mL in water UHPLC grade) and 50 µL of D-Sorbitol-1-13C (1 mg/mL in water UHPLC grade).
- Transfer the extraction buffer to a clean glass bottle and pre-cool the solution at -20 °C, 1 h before use. Use freshly prepared solution for the extractions. This solution can be stored at 4 °C for up to 2 weeks.
- Extraction Buffer 2
- In a 100 mL volumetric flask, add 75 mL of water UHPLC grade and 25 mL of MeOH UHPLC grade and homogenize.
- Transfer the extraction buffer to a clean glass bottle. Use fresh solution for the extractions. This solution can be stored at room temperature for several weeks.
5. Extraction of chlorophyll, lipids and metabolites
- Arrange the tubes, with the cell pellet (containing 10-15 x 106 cells), in liquid nitrogen.
- Resuspend the cell pellet in each tube with 1 mL of pre-cooled (-20 °C) Extraction Buffer 1.
NOTE: Perform this step quickly to avoid evaporation of low viscosity extraction buffer. After adding the Extraction Buffer 1, maintain the tubes at room temperature. - Vortex until the cells are well homogenized within the extraction mixture and aliquot the mixture into 2 mL microcentrifuge tube.
- Sonicate the cultures using sonication bath (see Table of Materials) in ice cooled water for 10 min.
- Incubate all the samples on an orbital shaker at 1000 rpm for 60 min at 4 °C.
- To induce the phase separation, add 650 µL of Extraction Buffer 2.
- Vortex briefly followed by centrifugation at 20000 x g for 5 min at 4 °C.
NOTE: After this step, there is a separation of liquid phases and a solid pellet in the bottom of the tube. Handle the tubes with care to avoid mixing of the two liquid phases. The top MTBE-phase contains lipids and chlorophyll, while the lower phase contains the polar and semi-polar metabolites. The precipitated pellet at the bottom contains proteins, starch and other insoluble molecules.
6. Aliquoting the fractions
- Transfer 500 µL of upper MTBE-phase (lipids) into a labelled 1.5 mL tube. Dry the samples using a vacuum concentrator (see Table of Materials) and store at -80 °C until measurement.
- Remove the remaining MTBE-phase using a 200 μL pipette.
- Transfer 650 µL of the lower phase (polar and semi-polar metabolites) to a new labeled tube. Dry the samples using a vacuum concentrator (see Table of Materials) and store at -80 °C until measurement.
- Remove the remaining lower phase by pipetting off the excess volume.
- Freeze the solid pellet in liquid nitrogen and store at -80 °C until further extraction.
7. Determination of polar metabolites (primary metabolites)
- Resuspend the dried pellet of the polar phase (step 6.3) in methoxyamine-hydrochloride/pyridine solution for methoxymization of carbonyl groups.
- Heat the samples at 37 °C for 90 min.
- Derivatize the samples with N-methyl-N-trimethylsilyltrifloracetamide (MSTFA) for 30 min at 37 °C as described previously13.
- Use gas chromatography coupled to time-of-flight mass spectrometry (GC-TOF-MS) to analyze the primary metabolites. The gradient parameters used were according to the previously described protocol14.
8. Determination of non-polar metabolites (Lipids)
- Re-suspend the dried pellet of non-polar phase (step 6.1) in a mixture of acetonitrile:isopropanol (7:3, v:v).
- Centrifuge at 20000 x g and separate on a reverse phase C8 column (100 mm×2.1 mm×1.7 μm particles), using a UPLC system (see Table of Materials). The two mobile phases were water with 1% 1 M ammonium acetate, 0.1% acetic acid (Buffer A), and acetonitrile:isopropanol (7:3) containing 1% 1 M ammonium acetate, 0.1% acetic acid (Buffer B).
- Use the gradient parameters according to the previously described protocol14.
9. Determination of chlorophyll content
- Mix 100 µL of the MTBE-phase (step 6.1) with 900 µL of 90% methanol for a method blank as well as the experimental samples.
- Measure the absorbance using spectrophotometer at a wavelength of 665 nm and 652 nm to distinguish between chlorophyll a and chlorophyll b.
NOTE: The absorption should range between 0.1 and 1 for valid concentration calculation. Dilute the samples, if necessary. - Calculate the chlorophyll a and b content, and also the total chlorophyll content according to the following formulas.
Chla = 16.82A665 – 9.28A652
Chlb = 36.92A652 – 16.54A665
Chla=b = 0.28A665 + 27.64A652
NOTE: The formulas were described by Bar-Nun and Ohad15.
10. Extraction and determination of the protein content, digestion and analysis
NOTE: To resuspend the protein, pellet urea/thiourea buffer (6 M urea, 2 M thioureaand protease and phosphatase inhibitors) was used with modifications in the protocol previously described16. However, any buffer of choice can be used for resuspension of proteins.
- Prepare the protein buffer using the following concentrations: 6 M of urea and 2 M of thiourea.
- Dissolve the pellet (step 6.5) in 200 µL of protein buffer (10.1).
- Incubate the samples at room temperature for 30 min, followed by centrifugation at 20000 x g for 5 min.
- Transfer the supernatant, which contains the proteins, to a new tube.
- Determine the protein concentration by Bradford assay17.
- Digest 50 µg of protein in-solution with a protocol of choice. Here, use the following protocol.
- Reduce 50 µg of protein samples using 5 mM DTT for 30 min followed by alkylation using 10 mM iodoacetamide for 30 min at room temperature in dark.
- Add Trypsin/Lys-C Mix at a 25:1 protein:protease ratio (w/w), mix and incubate for 3 h at 37 °C.
- Dilute the samples six folds using 50 mM TrisHCl (pH 8) and Incubate overnight at 37 °C.
- Terminate digestion by adding trifluoroacetic acid (TFA) to a final concentration of 0.5–1%.
- After digestion, perform desalting of the peptides prior to mass spectrometry using C18 stage tips and elute the digested peptides18.
- Concentrate the samples to near dryness, leaving 2-5 µL of solution in a vacuum concentrator (see Table of Materials) without heating.
- Resuspend the samples in loading buffer (5% acetonitrile, 0.5% formic acid) and analyze the peptide mixtures by LC-MS/MS using a high-resolution mass spectrometer (see Table of Materials) connected to a nano-UPLC system.
- Separate the peptides using UPLC system (see Table of Materials) on a 20 cm reverse phase charged surface hybrid (CSH) column (see Table of Materials) with an inner diameter of 75 μm and a particle size of 1.7 μm.
- Load 4 µL of sample and run through 90 min gradient at a flow rate of 300 nL/min.
- Set the gradient. Use partial loop-offline settings with isocratic gradient set at 3% of buffer B (99.9% acetonitrile + 0.1% formic acid) held for 14 min before the loop is shifted to online position with the column, thereafter the gradient is increased linearly for 50 min, until 20% buffer B is reached.
- Within the next 15 min, increase the concentration of buffer B to 30%. Then in the following 15 min, increase buffer B to 40%, before reaching 90% of Buffer B after another 4 min. Perform the washing step, which is required to clean the column, at 400 nL/min and hold for additional 10 min (see Table 1 for detailed gradient conditions).
- Finally, set back the system to a flow rate of 300 nL/min and a concentration of 3% buffer B within 1 min. Equilibrate the column for 15 min before the next sample is injected.
NOTE: A complete list of identified proteins after LCMS/MS analysis is presented in Table 2.
11. Extraction and determination of starch content
NOTE: For determination of total protein and starch content, the solid pellet was extracted in a two-step procedure as described previously10.
- Add 500 µL of 80% (v/v) ethanol to the cell pellet (step 6.5) and incubate for 10 min at 80 °C.
- Centrifuge at 4000 x g for 10 min at room temperature. Then dissolve the pellet in 250 µL of sterile water followed by the addition of 250 µL of 100 mM sodium acetate.
- Hydrolyze the starch by heating for 3 h at 99 °C. Digest the dissolved starch into glucose monomers overnight by adding an enzyme mix of α-amylase (4.2 units per sample) and α-amyloglucosidase (10 units per sample). Incubate the tubes at 37 °C overnight.
NOTE: After incubation, samples can be frozen at -20 °C for few days, or at -80 °C for several months, prior to glucose measurements. - Centrifuge the digested extract at 20000 x g for 5 min and collect the supernatant. Dissolve the supernatant (with the starch-derived glucose monomers) in 100 mM of HEPES-buffer (pH 7) that contains 5 mM MgCl2, 60 mg/mL ATP, 36 mg/mL NADP and glucose-6-phosphate-dehydrogenase (1 unit per sample).
- In order to analyze the starch content, first measure the baseline absorbance at 340 nm. Then add hexokinase (1 unit per sample) to start the reaction. Finally measure the increase of NADPH+H+ (indicating level of starch digested to glucose) at 340 nm with a 96-well plate reader.
NOTE: The difference of the maximum value at 340 nm (should not exceed the linear range of 1) and the baseline is equivalent to the glucose concentration of the digested starch. A glucose curve should be made to determine the glucose concentration in nmol of glucose per mL.
Results
Chlamydomonas reinhardtii CC-1690 culture synchronization
To demonstrate the representative results for the given protocol, we present the example multi-omics data obtained after harvesting and extraction of samples from synchronized Chlamydomonas reinhardtii cultures10. Synchronized cultures of Chlamydomonas comprise of cells belonging to uniform growth phase at a specific time point. The Chlamydomonas cultures were synchronized at 12 h/12 h light/dark cycle, 34 °C with the light intensity of 200 µmol·m-2·s-1 and the CO2 concentration of2%, v/v, described as optimal concentration for strain CC-1690 mt+10. These conditions had been previously optimized and validated using various cell cycle parameters10. Figure 1 displays cell size distribution measured with Coulter Counter at distinct time points of synchronized cultures. A shift in the cell volume can be observed as the cells grow in size throughout light phase, followed by the release of daughter cells starting at the end of light phase from 10 h. Once all the daughter cells are released, shift in the cell volume can be observed as the newly released daughter cells are disposed to begin the next cycle 10 (Figure 1).
Sample-harvesting, -handling and -extraction
Rapid harvesting of samples is carried out using centrifugation and after discarding the supernatant, the pellets can be stored at -80 °C until extraction. As described above (step 5), MTBE extraction results in three distinct phases: a) organic phase was used to measure lipids as well as chlorophyll levels (normalization factor), b) polar phase was collected to measure metabolites on GCMS while, c) the pellet was used to measure starch content and proteins. An overview of the distribution of different phases and their employment is illustrated in Figure 2.
Polar and non-polar metabolites
Based on the GCMS analysis of the polar fraction, 65 metabolites were annotated, covering amino acids, nucleic acids, intermediates of glycolysis, gluconeogenesis, tricarboxylic acid cycle, pentose phosphate pathway and polyamines (Figure 3A). The LCMS analysis of neutral phase containing lipids led to the identification of 204 distinct lipid species covering various lipid classes namely phosphatidylglycerols, phosphatidylethanolamine, sulfoquinovosyl diacylglycerols, monogalactosyldiacylglycerols, digalactosyldiacylglycerols, diacylglyceryltrimethylhomoserine, fatty acids, diacylglycerides and triacylglycerides. To visualize the global shifts in the metabolites and lipids across cell cycle, principal component analysis (PCA) was used. The PCA displays a separation of light and dark phases for both metabolomics and lipidomic data. Moreover, a semi-cyclic (partially open circle) can be noticed for both data (Figure 3C,D). The partial gap in the circular pattern is attributed to the fact that the samples at 24 h of the cell cycle were collected under dark in contrast to the samples collected in the beginning of cell cycle after 0.25 h of exposure to the light (Figure 3C,D).
Protein and starch analysis
To examine the quality of the protein pellet obtained as a result of MTBE extraction, 6 samples were used for proteomic analysis. The quality of the proteomics data obtained by digesting 50 µg protein/sample, was examined using a computational quality control tool -Proteomics quality control (PTXQC)19, indicating reproducible and high quality of proteomics data obtained from all replicates (Supplementary Figure 1). The molecular functional coverage of proteins was examined using REVIGO20. An overview of functional enrichment of the 2463 identified proteins (see Table 2), is presented in Figure 4A. The remaining pellet after protein extraction was used for reproducible quantification of starch as indicated by low standard deviation among various replicates (Figure 4B).
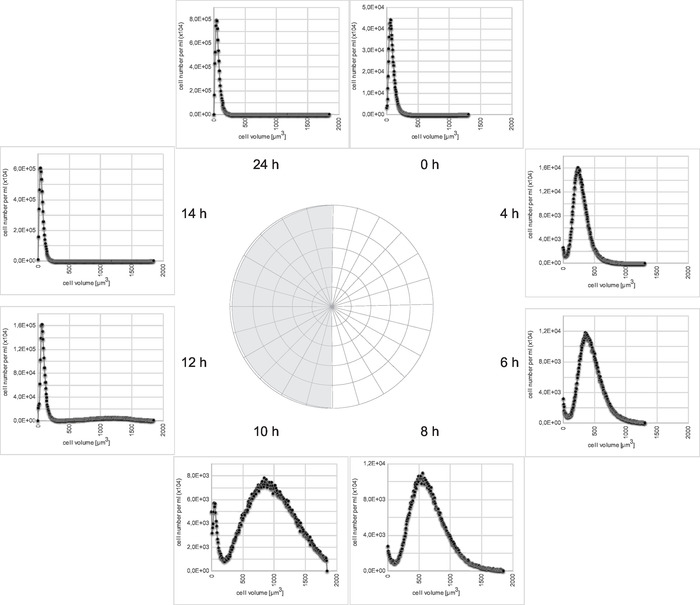
Figure 1: Illustrative example of the changes in the cell volume across different phases of cell cycle in Chlamydomonas reinhardtii. The x-axis representing the cell volume while y-axis representing the cell number. Please click here to view a larger version of this figure.
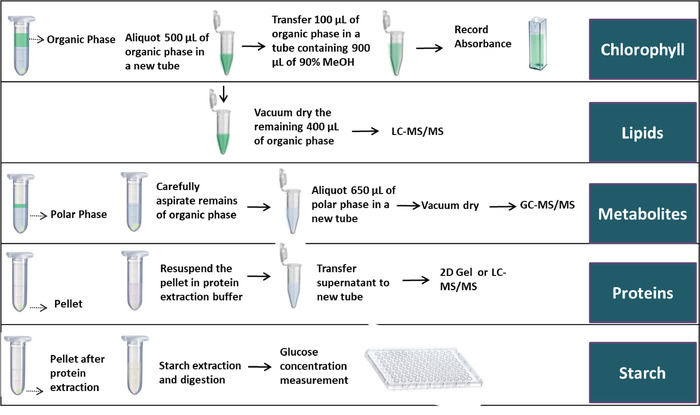
Figure 2: Illustrated workflow for the employment of different phases during multi-omics extraction cell pellets. The figure has been reused from Juppner, J.et al.10. Please click here to view a larger version of this figure.
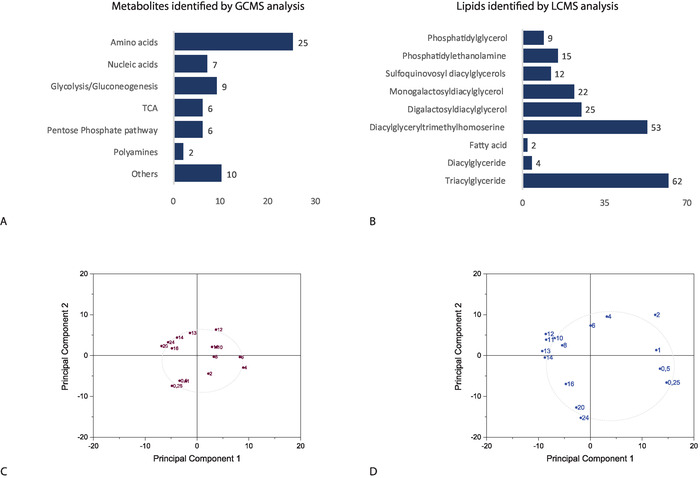
Figure 3: Representative example of metabolites and lipids identified using the described protocol. (A) Metabolite classes identified by GCMS analysis. (B) Lipid species belonging to different classes identified by LCMS analysis. (C) Principle component analysis of the metabolite levels across 24 h cell cycle. (D) Principle component analysis of the lipids across 24 h cell cycle. Please click here to view a larger version of this figure.
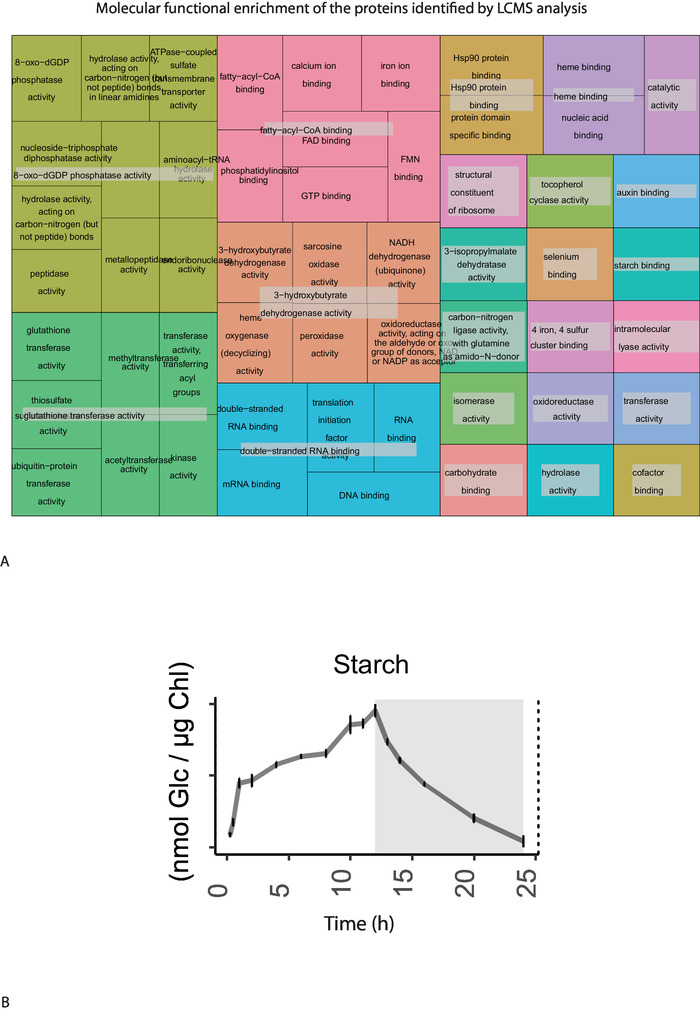
Figure 4: Representative example of the protein and starch data. A) Molecular functional enrichment of the proteins identified using LCMS analysis, treemap drawn using REVIGO 20 B) representative starch data displaying the reproducibility of the protocol. Please click here to view a larger version of this figure.
Supplementary Figure 1: Customized design of the fermenter system for the temperature and aeration controlled synchronous growth of Chlamydomonas cultures. The figure has been reused from Juppner, J.et al.10. Please click here to download this file.
Supplementary Figure 2: Representative outcome for proteomics data quality. Heatmap plotted using computational PTXQC tool19. Please click here to download this file.
| Time (min) | % Buffer B to Buffer A | |
| 0 to 15 min | Linear gradient from 0 to3% | Buffer A: 0.1% formic acid in UPLC grade water |
| 15 to 75 min | Linear gradient from 3% to 30% | Buffer B: 0.1% formic acid in 60% UPLC grade acetonitrile |
| 75 to 90 min | Linear gradient from 30% to 40% | Flow rate 300 nL/min |
| 90 to 94 min | Linear gradient from 40% to 90% | Injection volume 4 µL |
| 94 to104 min | wash column with 90% | |
| 105 to 120 min | Equilibrate the column for 15 min at 3% |
Table 1: Liquid chromatography of peptide samples, gradient parameters.
Table 2: List of proteins identified after LCMS/MS analysis. Please click here to download this file.
Discussion
In this article, we illustrated a robust and highly applicable extraction protocol for comprehensive lipidomics, metabolomics, starch and proteomics analysis from a single pellet of 10-15 x 106 cells. The method has been successfully implemented in several studies for a wide range of cells and tissues10,14,21,22,23,24,25,26,27,28,29,30,31,32,33,34,35,36. Here, we presented a stepwise pipeline for multi-omics analysis of different biomolecules from a single sample harvested from Chlamydomonas reinhardtii (CC-1690 mt+) culture.
The protocol provides a robust and reproducible approach to process multiple samples at once, for the analysis of various biomolecules. However, a number of critical steps should be taken care off in order to minimize the technical variation. Firstly, harvesting of the cells should be done as swiftly as possible while maintaining the uniform conditions for all harvested samples to preserve the biological state of the cells. Though we used centrifugation to harvest the cells, alternate harvesting strategies can be used for harvesting of the samples. However, it is important to note that different harvesting strategies are known to influence the metabolic state of the cells37 hence, consistent harvesting approach must be used for all experimental samples. Secondly, it is important to avoid drying of the upper non-polar phase containing chlorophyll, since this can influence the levels of dissolved chlorophyll in the solvent affecting the normalization factor for the samples. Finally, care should be taken while removing the remaining polar phase to obtain the protein and starch pellet, to avoid disturbing the pellet which can influence the starch and protein content.
Thereby presented extraction protocol offers several benefits for multiple-omics data analysis. Besides minimizing the number of sample aliquots required, it also reduces the variation between the analytical results obtained for different biomolecules. This allows direct comparison of the results obtained from the primary metabolites, lipids and proteomic data. Similarly, the simultaneous extraction of multiple compound classes allows consistent and uniform normalization strategy of the different data sets. This is especially applicable if normalization is hard to achieve using dry or fresh weight38 or cell number.
The protocol can be implemented for routine screening of a complex biological sample. These holistic metabolomic, lipidomic and proteomic data sets can offer comprehensive information about systematic changes in the metabolism. Additionally, the data obtained from the proteomics analysis, provides insights into the quantitative (abundance) and qualitative (modifications) changes in proteins in relation to the metabolites. Hence, integrating omics data could reveal in-depth information about changes induced by genetic or biotic and/or abiotic perturbations of a biological system. Thus, elucidating molecular changes of specific metabolic pathways or cellular processes. Similarly, these high-throughput data can allow identification of targets for the metabolic engineering and refine or test predictions from genome-scale metabolic models37,39.
Disclosures
The authors have no disclosures.
Acknowledgements
We are very grateful to Gudrun Wolter and Änne Michaelis for excellent technical assistance. We would like to thank all the members of the Giavalisco lab for their help. We are thankful to the Max Planck Society for funding the research and FAPESP for the fellowship of L A Giraldi
Materials
| Name | Company | Catalog Number | Comments |
|---|---|---|---|
| Reagents and standards | |||
| 1,2-diheptadecanoyl-sn-glycero-3-phosphocholine (17:0 PC) | Avanti Polar Lipids | 850360P | Internal standard for lipids |
| 13C Sorbitol | Sigma Aldrich | 605514 | Internal standard for metabolites, ISOTEC® Stable Isotopes |
| Ampicillin | Sigma Aldrich | A9393-5G | Internal standard for metabolites |
| Corticosterone | Sigma Aldrich | 27840-500MG | Internal standard for metabolites, HPLC grade |
| Methanol (MeOH) | Biosolve Chemicals | 13684102 | ULC-MS grade |
| Methyl tert-butyl ether (MTBE) | Biosolve Chemicals | 13890602 | HPLC grade |
| Trypsin/Lys-C mix | Promega | V5072 | Enzymatic digestion of proteins |
| Water | Biosolve Chemicals | 23214102 | ULC-MS grade |
| Equipment | |||
| 1.5 ml Safe-lock microcentrifuge tubes | Eppendorf | 30120086 | Used for fractions |
| 2 ml Safe-lock microcentrifuge tubes | Eppendorf | 30120094 | Used for sample extarction |
| Balance | Sartorius Corporation | 14 557 572 | |
| Fermenter system | Glasbläserei Müller, Berlin, Germany | custom made fermenter of 800ml capacity | |
| Q-exactive HF Orbitrap Mass Spectrometer | Thermo Scientific | IQLAAEGAAPFALGMBFZ | |
| Refrigerated microcentrifuge | Eppendorf, model 5427R | 22620701 | |
| Reversed Phase (RP) Bridged Ethyl Hybrid (BEH) C8 column (100 mm×2.1 mm containing 1.7 μm diameter particles) | Waters, Machester, UK | 186002878 | Analysis of lipids |
| RP Charged Surface Hybrid (CSH) column (Waters) with an inner diameter of 75 μm and a particle size of 1.7 μm | Waters, Machester, UK | 186007477 | Analysis of proteins |
| RP High Strength Silica (HSS) T3 column (100 mm×2.1 mm containing 1.8 μm diameter particles) | Waters, Machester, UK | 186003539 | Analysis of metabolites |
| Shaker | Eppendorf Thermomixer 5436 | 2050-100-05 | |
| Sonicator | USC 300 TH | 142-0084 | standard preset sonication power at 45kHz |
| UPLC system | Waters Acquity UPLC system (Waters, Machester, UK) | ||
| Vacuum concentrator | Scan Speed Maxi Vac Alpha Evaporators | 7.008.500.002 | |
| Vortex mixer | Vortex-Genie 2, Model G560 | SI-0236 | |
| Z2 Coulter Particle Count and Size Analyzer | Beckman Coulter | 6605700 | particle (cells) volume and number analyser |
References
- Spolaore, P., Joannis-Cassan, C., Duran, E., Isambert, A. Commercial applications of microalgae. Journal of Bioscience and Bioengineering. 101 (2), 87-96 (2006).
- Georgianna, D. R., Mayfield, S. P. Exploiting diversity and synthetic biology for the production of algal biofuels. Nature. 488 (7411), 329-335 (2012).
- Pulz, O., Gross, W. Valuable products from biotechnology of microalgae. Applied Microbiology and Biotechnology. 65 (6), 635-648 (2004).
- Perez-Garcia, O., Escalante, F. M., de-Bashan, L. E., Bashan, Y. Heterotrophic cultures of microalgae: metabolism and potential products. Water Research. 45 (1), 11-36 (2011).
- Mukhopadhyay, A., Redding, A. M., Rutherford, B. J., Keasling, J. D. Importance of systems biology in engineering microbes for biofuel production. Current Opinion in Biotechnology. 19 (3), 228-234 (2008).
- Chang, R. L., et al. Metabolic network reconstruction of Chlamydomonas offers insight into light-driven algal metabolism. Molecular Systems Biology. 7, 518(2011).
- Dal'Molin, C. G., Quek, L. E., Palfreyman, R. W., Nielsen, L. K. AlgaGEM--a genome-scale metabolic reconstruction of algae based on the Chlamydomonas reinhardtii genome. Bmc Genomics. 12 Suppl 4, S5(2011).
- Zones, J. M., Blaby, I. K., Merchant, S. S., Umen, J. G. High-Resolution Profiling of a Synchronized Diurnal Transcriptome from Chlamydomonas reinhardtii Reveals Continuous Cell and Metabolic Differentiation. Plant Cell. 27 (10), 2743-2769 (2015).
- Willamme, R., et al. Metabolomic analysis of the green microalga Chlamydomonas reinhardtii cultivated under day/night conditions. Journal of Biotechnology. 215, 20-26 (2015).
- Juppner, J., et al. Dynamics of lipids and metabolites during the cell cycle of Chlamydomonas reinhardtii. The Plant Journal. 92 (2), 331-343 (2017).
- Salem, M. A., Juppner, J., Bajdzienko, K., Giavalisco, P. Protocol: a fast, comprehensive and reproducible one-step extraction method for the rapid preparation of polar and semi-polar metabolites, lipids, proteins, starch and cell wall polymers from a single sample. Plant Methods. 12, 45(2016).
- Harris, E. H. The Chlamydomonas Sourcebook. Harris, E. H. 1, Elsevier. 248-249 (2009).
- Roessner, U., Wagner, C., Kopka, J., Trethewey, R. N., Willmitzer, L. Technical advance: simultaneous analysis of metabolites in potato tuber by gas chromatography-mass spectrometry. The Plant Journal. 23 (1), 131-142 (2000).
- Salem, M., Bernach, M., Bajdzienko, K., Giavalisco, P. A Simple Fractionated Extraction Method for the Comprehensive Analysis of Metabolites, Lipids, and Proteins from a Single Sample. Journal of Visualized Experiments. (124), (2017).
- Bar-Nun, S., Ohad, I. [34] Chloroplast membrane polypeptides. Methods in Enzymology. 69, 363-374 (1980).
- Giavalisco, P., et al. Proteome analysis of Arabidopsis thaliana by two-dimensional gel electrophoresis and matrix-assisted laser desorption/ionisation-time of flight mass spectrometry. Proteomics. 5 (7), 1902-1913 (2005).
- Bradford, M. M. A rapid and sensitive method for the quantitation of microgram quantities of protein utilizing the principle of protein-dye binding. Analytical Biochemistry. 72, 248-254 (1976).
- Rappsilber, J., Mann, M., Ishihama, Y. Protocol for micro-purification, enrichment, pre-fractionation and storage of peptides for proteomics using StageTips. Nature Protocols. 2 (8), 1896-1906 (2007).
- Bittremieux, W., Valkenborg, D., Martens, L., Laukens, K. Computational quality control tools for mass spectrometry proteomics. Proteomics. 17 (3-4), 1600159(2017).
- Supek, F., Bosnjak, M., Skunca, N., Smuc, T. REVIGO summarizes and visualizes long lists of gene ontology terms. PloS one. 6 (7), e21800(2011).
- Hauck, O. K., et al. Uric acid accumulation in an Arabidopsis urate oxidase mutant impairs seedling establishment by blocking peroxisome maintenance. Plant Cell. 26 (7), 3090-3100 (2014).
- Caldana, C., et al. Systemic analysis of inducible target of rapamycin mutants reveal a general metabolic switch controlling growth in Arabidopsis thaliana. The Plant Journal. 73 (6), 897-909 (2013).
- Avin-Wittenberg, T., et al. Global analysis of the role of autophagy in cellular metabolism and energy homeostasis in Arabidopsis seedlings under carbon starvation. Plant Cell. 27 (2), 306-322 (2015).
- Hummel, J., et al. Ultra performance liquid chromatography and high resolution mass spectrometry for the analysis of plant lipids. Frontiers in Plant Science. 2, 54(2011).
- Giavalisco, P., et al. Elemental formula annotation of polar and lipophilic metabolites using (13) C, (15) N and (34) S isotope labelling, in combination with high-resolution mass spectrometry. The Plant Journal. 68 (2), 364-376 (2011).
- Watanabe, M., et al. Comprehensive dissection of spatiotemporal metabolic shifts in primary, secondary, and lipid metabolism during developmental senescence in Arabidopsis. Plant Physiology. 162 (3), 1290-1310 (2013).
- Lambers, H., et al. Proteaceae from severely phosphorus-impoverished soils extensively replace phospholipids with galactolipids and sulfolipids during leaf development to achieve a high photosynthetic phosphorus-use-efficiency. New Phytologist. 196 (4), 1098-1108 (2012).
- Degenkolbe, T., et al. Differential remodeling of the lipidome during cold acclimation in natural accessions of Arabidopsis thaliana. The Plant Journal. 72 (6), 972-982 (2012).
- Bromke, M. A., et al. Liquid chromatography high-resolution mass spectrometry for fatty acid profiling. The Plant Journal. 81 (3), 529-536 (2015).
- Li, N., et al. FAX1, a novel membrane protein mediating plastid fatty acid export. PLOS Biology. 13 (2), e1002053(2015).
- Hemme, D., et al. Systems-wide analysis of acclimation responses to long-term heat stress and recovery in the photosynthetic model organism Chlamydomonas reinhardtii. Plant Cell. 26 (11), 4270-4297 (2014).
- Sharma, D. K., et al. UPLC-MS analysis of Chlamydomonas reinhardtii and Scenedesmus obliquus lipid extracts and their possible metabolic roles. Journal of Applied Phycology. 27 (3), 1149-1159 (2015).
- Delgado, R., Munoz, Y., Pena-Cortes, H., Giavalisco, P., Bacigalupo, J. Diacylglycerol activates the light-dependent channel TRP in the photosensitive microvilli of Drosophila melanogaster photoreceptors. The Journal of Neuroscience. 34 (19), 6679-6686 (2014).
- Bozek, K., et al. Organization and evolution of brain lipidome revealed by large-scale analysis of human, chimpanzee, macaque, and mouse tissues. Neuron. 85 (4), 695-702 (2015).
- Khrameeva, E. E., et al. Neanderthal ancestry drives evolution of lipid catabolism in contemporary Europeans. Nature Communications. 5, 3584(2014).
- Bozek, K., et al. Exceptional evolutionary divergence of human muscle and brain metabolomes parallels human cognitive and physical uniqueness. PLOS Biology. 12 (5), e1001871(2014).
- Veyel, D., Erban, A., Fehrle, I., Kopka, J., Schroda, M. Rationales and approaches for studying metabolism in eukaryotic microalgae. Metabolites. 4 (2), 184-217 (2014).
- Allwood, J. W., et al. Inter-laboratory reproducibility of fast gas chromatography-electron impact-time of flight mass spectrometry (GC-EI-TOF/MS) based plant metabolomics. Metabolomics. 5 (4), 479-496 (2009).
- Feist, A. M., Herrgard, M. J., Thiele, I., Reed, J. L., Palsson, B. O. Reconstruction of biochemical networks in microorganisms. Nature Reviews Microbiology. 7 (2), 129-143 (2009).
Reprints and Permissions
