In this study, we describe a detailed procedure of TNBS-mediated intestinal fibrosis, which exhibits comparable pathophysiology to Crohn's fibrosis. We also discuss this approach in light of rapamycin facilitated inhibitory effects on intestinal fibrosis.
Method Article
Mechanistic Insight into the Development of TNBS-Mediated Intestinal Fibrosis and Evaluating the Inhibitory Effects of Rapamycin
In This Article
Summary
Abstract
Significant studies have been carried out to understand effective management of intestinal fibrosis. However, the lack of better knowledge of fibrosis has hindered the development of a preventative drug. Primarily, finding a suitable animal model is challenging in understanding the mechanism of Crohn's-associated intestinal fibrosis pathology. Here, we adopted an effective method where TNBS chemical exposure to mice rectums produces substantially deep ulceration and chronic inflammation, and the mice then chronically develop intestinal fibrosis. Also, we describe a technique where a rapamycin injection shows inhibitory effects on TNBS-mediated fibrosis in the mouse model. To assess the underlying mechanism of fibrosis, we methodically discuss a procedure for purifying Cx3Cr1+ cells from the lamina propria of TNBS-treated and control mice. This detailed protocol will be helpful to researchers who are investigating the mechanism of fibrosis and pave the path to find a better therapeutic invention for Crohn's-associated intestinal fibrosis.
Introduction
Dysregulation of immune homeostasis in the gut leads to pathogenic inflammation and has been widely known to cause inflammatory bowel disease (IBD)1,2. Intestinal fibrosis is a chronic consequence of inflammatory bowel diseases (IBDs), such as Crohn's disease (CD)3. The irreversible pathophysiology of CD includes intestinal stricture or stenosis of fibrosis, which limits treatment options, and with no medications currently available, the only treatment is surgery. Ultimately, the development of effective therapies to counter inappropriate inflammation is much needed to study the mechanism of CD, and this will lead us a step closer to that.
A variety of genetic mouse models are available to study IBD including IL10 KO, SAMP/Yit and adoptive CD45+RB high cell transfer into SCID mice4,5,6. Here, we show the procedure for TNBS-mediated fibrosis in the mouse model of CD, which is comparable to the pathology of human Crohn's fibrosis. The TNBS-induced model has certain advantages. This model is technically simple; disease onset is rapid, inexpensive, and could widely be used in different animals (e.g., mouse, rat and guinea pig7). Co-administration of ethanol and TNBS (2,4,6-trinitrobenzene sulfonic acid) abruptly damages the intestinal barrier and exposes colon tissue protein to TNBS and elicit substantial immunologic responses8,9. Repeated exposure of TNBS leads to an overreactive repair process responding to inflammation and injury, and develops a fibrotic reaction in the gut. Thus, TNBS-induced fibrosis model serves to be a very compelling model to study Crohn's-associated intestinal fibrosis.
Furthermore, mononuclear phagocytes are the primary cells that arbitrate the innate immune response to pathogenesis and injury in the gut10,11,12,13. To elucidate the cellular mechanism and to establish the role of Cx3Cr1+ mononuclear phagocytes in the TNBS fibrosis model, we show the procedure of purifying the mononuclear phagocytes. Analysis of Cx3Cr1+ cells is an essential step in order to assess the inflammatory markers and determine the concomitant mechanism for intestinal fibrosis. Collectively, this detailed procedure for TNBS fibrosis will be helpful to explain the cellular mechanisms of intestinal fibrosis.
Protocol
For this manuscript, all human samples were procured according to the approved protocol by Institute Review Board (IRB) and by the Committee on Human Research at Albany Medical College. All research involving animals were strictly followed according to the approved protocol by the Institutional Animal Care and Use Committee at Albany Medical College as well as the National Institutes of Health Guide for the Care and Use of Laboratory Animals.
1. Collection of human intestinal specimens
- Collect human tissue samples according to the institution's research committee protocols.
- Procure intestinal tissue (ileocolonic) of a CD patient diagnosed with fibrosis and control samples from patients with no history of IBDs.
- Use part of the intestinal tissue for immunohistology, another part of the tissue for analyzing mRNA, and a final part for protein expression of fibrotic and cytokine genes/markers.
- For immunohistology analysis, first fix the human tissue sample in 4% paraformaldehyde for at least 48 h and then transfer it into a tube containing 70% ethanol for at least 16 h. Use this fixed tissue for making a paraffin-embedded block and cut 5 µm thick tissue sections by using a tissue-microtome.
- Using a brush, gently spread out each cut section on a glass slide for staining.
- Stain tissue section slide with trichrome stain to detect collagen deposition, and with αSMA stain to detect myofibroblasts (See section 3 for detailed information about trichrome and αSMA staining). Examine the stained sections under a light microscope.
- Process another part of the obtained human tissue sample to make protein lysate to detect αSMA via western blot (see section 7 for detailed information about western blot analysis).
- Obtain RNA from the final part of human tissue sample using an extraction reagent (Table of Materials) and convert mRNA into cDNA via RT-PCR.
- Analyze fibrotic and cytokine genes by qPCR (see section 6 for detailed information about mRNA preparation).
2. Induction of TNBS fibrosis and rapamycin treatment in mice
- Carry out animal research according to the animal research protocols approved by the institution.
- Shave adult mice around the neck area in order to pre-sensitize to TNBS via dermal exposure. Soak TNBS in a cotton swab and then apply TNBS to the shaved area of the mouse neck.
NOTE: Pre-sensitization is a very important step since it improves delayed hypersensitivity response to initiate TNBS-mediated inflammation. - Eight days post pre-sensitization, induce colitis by intra-rectal administration once a week for six weeks. Apply four mg of TNBS (in 25% ethanol) using a 100 µL enema via a 1 mL syringe attached to a 3.5 French polyurethane catheter and give control mice 100 µL of 25% ethanol only.
- Anesthetize mice with pentobarbital (25 mg/kg intraperitoneal) or expose them to 2.5% isoflurane along with 1 L/min of oxygen during TNBS administration. Confirm anesthetization by gently pinching toes and looking for an absence of reflex.
- Use veterinary ointment on eyes to prevent dryness while mice are under anesthesia.
- Inject rapamycin at 2 mg/kg/day or vehicle (5% Tween-20 and 4% ethanol) every weekday for 3-6 weeks, intraperitoneal, to both control and TNBS-treated mice.
- Use 6-week TNBS post-treated mice intestine for analyzing the extracellular assays including histology, flow cytometry, western blotting and RNA extraction. To harvest organs, euthanize mice using CO2 inhalation and confirm euthanasia with cervical dislocation.
- To harvest organs, euthanize mice using CO2 inhalation and confirm euthanasia with cervical dislocation. After euthanasia, longitudinally open the mouse on its ventral side using surgical grade scissors and forceps. Remove the entire colon from the rectum to the terminal ilium area. Quickly transfer the colon to ice-cold 1x HBSS and wash the colon using the same buffer.
- Measure and compare the colon lengths of the control and TNBS-treated mice. Do this step as fast as possible to avoid drying out of the colons in order to avoid cell deaths.
- Cut the colon into small pieces and keep at -80 °C for storage for future purposes (RNA/western blot analysis). Use another piece of the colon for FACS analysis.
- Be sure to cut and collect colonic tissue samples from similar regions of the colon of both control and TNBS-treated animals.
NOTE: A 10%-20% mortality is expected with TNBS inoculation although with experience, the mortality rate can be significantly reduced.
3. Immuno-histopathologic assessment of gut fibrosis
- Fix human and/or mice tissues in 4% paraformaldehyde for 48 h, and then transfer to 70% ethanol for 16 h.
NOTE: Paraformaldehyde is a neurotoxic chemical so avoid inhaling; use a face mask while using it. - Paraffin embed the fixed colon tissues, slice to a 5 µm thickness, and directly put the tissues on glass slides for histology.
- Perform H&E and Trichrome Blue staining according to manufacturer's instructions to detect collagen.
- Briefly, first deparaffinize sections by submerging the slide containing sections in two chambers of xylene for 5 min in each chamber.
- Rinse slides with 100% alcohol for 1 min; repeat this step three times. Rinse again with tap water for 1 min.
- After that, immerse slides in preheated Bouin's solution at 56 °C for 60 min. Bouin's solution is yellow in appearance; wash after taking out the slides from Bouin's solution in tap water for 3 min or until slides became colorless.
- Immerse slides in Modified Mayer's Hematoxylin solution for 7 min at room temperature.
- Stain slides by immersing in Trichrome stain for 5-8 min. Immediately, rinse slides in running water for 5-10 s to remove excess Trichrome stain.
- Dehydrate slides with 100% alcohol for 1 min. Repeat this procedure three times.
- Clear slides with xylene for 1 min and repeat the step 3x.
- Mount slides with mounting media (Table of Materials).
- Carefully hold coverslip at one end with forceps and let it cover the entire section without having any bubbles. If there are some bubbles, quickly remove bubbles by tapping the coverslip.
- Use immunostaining to detect αSMA.
- Block colon sections in blocking buffer (0.2% Triton X-100 and 5% normal goat serum in 1x PBS) for 1 h at room temperature.
- Incubate with 100 µL of diluted primary antibody for αSMA (Table of Materials) on the slide solution (0.2% Triton X-100 and 3% normal goat serum in 1x PBS; anti-αSMA 1:200) at 4 °C overnight.
- Wash the sections three times with 1x PBS.
- Use goat anti-mouse IgG (H + L) conjugated with Alexa Fluor 488 (Table of Materials) as a secondary antibody for 2 h at room temperature.
- Wash the sections three times with 1x PBS.
- Use DAPI to counterstain the nucleus for 5 min.
- Wash the sections three times with 1x PBS.
- Mount slides with fluorescent mounting media (Table of Materials), and seal with a coverslip using nail polish.
- Acquire images by using LSM 880 confocal microscope and process images using microscope software.
- Quantify images by taking an average of multiple selected areas in the same section with ImageJ.
4. Isolation of intestinal lamina propria and purification of Cx3Cr1+ mononuclear phagocytes
- Longitudinally open the colon in ice-cold Hank's Balanced Salt Solution (HBSS; Table of Materials) and wash the colon with the same buffer.
- Cut approximately 5 cm small pieces of colon tissues using sterile scissors in HBSS.
- Transfer small colon tissue pieces in a 50 mL conical tube containing 10 mL of pre-digestion buffer (1x HBSS with 5% FBS, 5 mM EDTA and 1 mM DTT), and shake for 20 min at 100 rpm in a 37 °C incubator11.
NOTE: Incubation of colonic tissue in 37 °C at 100 rpm shaking condition allows for efficient collagenase tissue digestion and high yield of viable cells. - Discard detached colonic epithelium by passing through a 40 µm cell strainer.
- Collect the remaining tissue from the strainer and further digest them in digestion buffer containing Collagenase type IV and DNase I (Table of Materials) in 1x HBSS with 5% FBS for 20 min at 37 °C at 100 rpm.
- Vortex the digested tissues for approximately 20 s and pass through a 40 µm cell strainer to obtain lamina propria fractions.
- Centrifuge the lamina propria fractions to pellet down the cells at 700 x g in 4 °C
- To exclude dead cells from the lamina propria use a density gradient (Table of Materials).
NOTE: The density gradient media used here (Table of Materials) may cause loss of mononuclear cells; however, it greatly removes dead cells from the preparation, which overall increases the purity.- Make 100 mL each of 30% and 70% density gradient media solutions. Resuspend the obtained cells in 10 mL of the 30% solution and overlay on top of 5 mL of the 70% solution in a 15 mL tube.
- Centrifuge the gradient in a brake-free condition at 1,000 x g and room temperature. Collect the white ring phase containing lamina propria lymphocytes, which will be between the 30% and 70% gradient layers.
- Wash the obtained cells by re-suspending in ice-cold HBSS and centrifuge at 500 x g, 20 °C, for 10 min. Re-suspend cells in FACS (fluorescence-activated cell sorting) buffer (PBS, pH 7.4, with 1% BSA and 2 mM EDTA).
- Purify mononuclear phagocytes from the collected cells purification using magnetic beads and/or FACS sorting.
- Magnetic purification
- Prior to staining with antibodies, first block cell surface of lamina propria cells by incubating with anti-mouse CD16/CD32 Fc blocker for 15 min on ice.
- Incubate cells with anti-Cx3Cr1-PE (phycoerythrin) antibodies along with anti-PE microbeads (Table of Materials) for 30 min on ice, to capture the bound cells. Wash cells with FACS buffer.
- Pass the antibody/bead bound cells through a magnetic-activated cell-sorting column in a magnetic field to remove unbound cells. Wash three times with FACS buffer. Remove the column from the magnetic field and push plunger in the column to yield bead bound cells.
- FACS sorting
NOTE: FACS sorting can be used in lieu of magnetic purification. Even though magnetic purification is an easy and cost-effective method, it is limited to only purifying single cells, not for subpopulations of cells. Therefore, to isolate subpopulations of cells, the FACS sorting method is an effective method of sorting single cells as well as subpopulations of cells.- Block lamina propria cells with anti-mouse CD16/CD32 Fc blocker (Table of Materials).
- Stain cells by incubating with anti-CD64, CD11c, CD11b, Cx3Cr1, Ly6C, and MHCII antibodies.
- Sort using a FACS flow cytometer, gating for CD11c-CD64+ CD11b+ Cx3Cr1+ Ly6C- cells to purify the CX3Cr1 (P3 + P4) population.
- Magnetic purification
- Lyse sorted cells for total RNA preparation and detect cytokine and fibrotic markers (see section 6 for RNA and cDNA preparation).
- Analyze mRNA expression of fibrotic markers and inflammatory cytokine analysis from isolated single-cell suspensions from magnetic purification.
- For FACS analysis, block cells with anti-mouse CD16/CD32 Fc blocker (Table of Materials) prior to staining with antibodies against surface or intracellular markers.
5. Flow cytometry analysis
- Cell-surface staining and analysis
- Resuspend 5-10 × 105 isolated lamina propria cells in 50 mL of FACS buffer (1% BSA, 2 mM EDTA in PBS, pH 7.4).
- Incubate cells with anti-mouse CD16/CD32 (Table of Materials) at a 1:50 dilution to block Fc receptors on ice for 10 min.
- Wash cells with 500 µL of ice-cold FACS buffer to remove unbound anti-CD16/CD32 prior to cell-surface staining.
- Surface stain colonic single-cell suspensions (106 cells/50 mL) with fluorescent-labelled antibody at 1:100 dilution on ice for 30 min to evaluate colonic lamina propria.
- Wash labeled cells with 500 µL of ice-cold FACS buffer twice to remove unbound antibodies.
- Analyze labeled mononuclear cells by flow cytometry. Gate for Live, then for FSC+SSC+ followed by CD11b+ Cx3Cr1+, and then analyze other macrophage activation markers including MHCII, CD80, CD86 and CD40.
- Intracellular cytokine staining and analysis
- For intracellular cytokine staining, fix and permeabilize the surface-stained cells using a Fixation/Permeabilization Solution Kit (Table of Materials); please follow the manufacturer's instructions for detailed steps.
- Gate lamina propria cells for Live, then for FSC+SSC+ followed by CD11b+ Cx3Cr1+IL23+ to detect intracellular level of IL23 cytokine and CD11b+ Cx3Cr1+IL1β+ to detect intracellular level of IL1β cytokine.
- αSMA staining and analysis
- Wash cells with FACS buffer twice by centrifuging at 200 x g and 4 °C for 5 min to remove excess fixative buffer.
- To determine the αSMA level, permeabilize cells with a Fixation/Permeabilization Solution Kit (Table of Materials).
- Incubate cells with anti-αSMA-AF488 antibody (Table of Materials) using 1:1,000 dilution on ice for 30 min.
- Wash cells twice and then do FACS analysis. Gate for Live, FSC+SSC+ followed by detection of αSMA+ cells in colonic cells.
6. RNA isolation, RT-PCR, real-time PCR
- Isolate RNA from MACS or FACS purified cells or colon excised tissue by homogenizing them in extraction reagent (Table of Materials).
NOTE: Use safety goggles and other lab protective gear when working with this reagent as it is a lung and skin irritant. Work safely in a hood. - Add 0.5 µL of RNase-free glycogen from 20 µg/mL glycogen stock solution (Table of Materials) to improve the recovery of total RNA prior to precipitating RNA with isopropanol.
- Resuspend the RNA pellet in 50 µL of RNase free water (Table of Materials) and incubate at 55 °C for 5 min to dissolve the RNA palate completely.
- Read RNA concentrations using a spectrophotometer at 260 nm.
- Synthesize cDNA using 1 µg of total RNA and a reverse transcription synthesis kit (Table of Materials).
- Analyze gene expression using 2 µL of cDNA as templates via real-time PCR. Use a 96-well PCR plate qPCR Master Mix kit (Table of Materials). Use CT values to calculate the fold change of RNA abundance after normalizing the GAPDH/HPRT values.
7. Western blotting
- Lyse colon tissue by using RIPA lysis buffer (1% NP40).
- Resolve protein lysate in an 8% bis-Tris gel at a constant voltage of 80 V.
- Transfer gel-protein to nitrocellulose membrane(s) in cold transfer buffer running at a constant current of 50 mA for 2 h at 4 °C.
- Block non-specific regions on the protein transferred membrane using 5% non-fat milk in TBST (25 mM Tris-HCl, pH 7.4, 1.5 M NaCl, 0.05% Tween-20) for at least 1 h at room temperature.
- To detect αSMA levels, incubate membrane(s) with αSMA primary detection antibody at 4 °C overnight.
- Wash membranes 3-4 times using TBST in 15 min intervals.
- Incubate with HRP-conjugated secondary antibody (1:10,000) in 5% non-fat milk in TBST.
- Develop membranes using an ECL developing kit.
- Normalize protein signal intensities with GAPDH as a loading control for densitometry analysis.
8. Statistical analysis
- Analyze the data using data analysis software of choice by comparing between wild type and KO animals.
- Consider P-value of <0.05 to be significant (*P < 0.05; **P < 0.01; ***P < 0.001).
- Use Student's t-test to test the differences between two groups and ANOVA test for analysis between more than two groups.
Results
We adopted the TNBS colitis mouse model to study and elucidate the underlying mechanisms of intestinal fibrosis8. Here, we performed a detailed time course study of TNBS-mediated colitis, where TNBS was rectally administrated weekly to wild type mice for up to six weeks as represented schematically (Figure 1A). After six weeks of TNBS treatment, we noticed that colonic lengths shorten progressively over the course of the TNBS treatment, from an average of 5 ± 0.5 cm in the control group to 3 ± 0.5 cm in the TNBS group; such quantitative analysis of colon length represents a very apparent reduction in colon length (Figure 1B). To ensure that the TNBS Crohn's disease model is comparable to the human Crohn's fibrosis model and was not an artifact related to the methodology, we analyzed the fibrotic markers at multiple levels in a detailed time course study for the TNBS injection to the wild type. Accumulation of alpha-smooth muscle actin (αSMA) positive cells and collagen deposition within submucosal layers have been reported in most of the fibrosis incidences and is regarded as a hallmark for fibrotic events14. We found that the colon sections of TNBS-treated mice that were stained with αSMA showed a 4-6-fold increase in colonic submucosa layer positively stained with αSMA (Figure 1C). Besides, the Trichrome blue staining for these sections also showed a 2-4-fold increase, suggesting significant collagen deposition, which validates severe intestinal fibrosis (Figure 1D). We further assessed the activation of myofibroblasts by detecting αSMA-positive cells by FACS analysis in TNBS-treated mice colon and found a significant accumulation of αSMA-positive staining (Figure 1E). Furthermore, we found substantial induction in the expression of αSMA, Col-I, and Col-III measured by qPCR analysis in TNBS-treated mice (Figure 1F). Increased expression of αSMA protein in western blot analysis revealed increased fibrosis (Figure 1G). Overall, TNBS kinetics treatment provides an opportunity to access putative immune response in chronic conditions, which closely mimics the CD chronic phase condition and is essential to fibrosis development.
To compare TNBS fibrosis with Crohn's associated fibrosis, we analyzed the expression of fibrosis markers and cytokines in fresh tissue biopsy from the ileum of patients with active CD or under remission. Remarkably, we found marked induction of thickening of αSMA-positive layers and increased collagen deposition as detected by trichrome staining in active CD sections (Figure 2A). We also performed Western blot analysis and confirmed the induction of αSMA expression in active CD samples (Figure 2B). In addition, we observed significant induction of fibrosis markers including αSMA, Col1, as detected by qPCR analysis (Figure 2C).
Next, to determine a mechanism to limit TNBS fibrosis we evaluated the effects of rapamycin, a pharmacological inhibitor of mTOR activity15,16. Accordingly, we treated mice with both TNBS and rapamycin and analyzed αSMA and collagen level in colon histology and have shown quantitative measurement of αSMA and collagen in densitometry plot (Figure 3A). Our data suggests that rapamycin reduces the αSMA-positive staining in submucosal layer and lessens the collagen deposition. To further validate and quantify fibrotic responses, we determined the αSMA, collagen and TGFβ expressions by qPCR, and αSMA expression by flow cytometry in TNBS-treated colon (Figure 3B, 3C). We have also shown Cx3Cr1+ mononuclear phagocytes induce an inflammatory immune response to injury9. Thus, we wanted to see if administration of rapamycin in TNBS-treated mice could reverse the inflammatory and fibrotic effects. Therefore, we purified Cx3Cr1+ resident mononuclear phagocytes from colonic single cell suspensions by using magnetic microbeads (Figure 3D). We found an increased level of p-p70 and p-S6 in Cx3Cr1+ resident mononuclear phagocytes by western blot analysis from TNBS-treated mice, and this level was blocked by rapamycin (Figure 3E). Besides, we found that rapamycin treatment dampens down the IL-23 and IL-1β in the TNBS-treated group (Figure 3F). Moreover, these findings elucidate the effective mechanism involved in the induction of TNBS-fibrosis and have shown that rapamycin attenuates the induction of fibrosis.
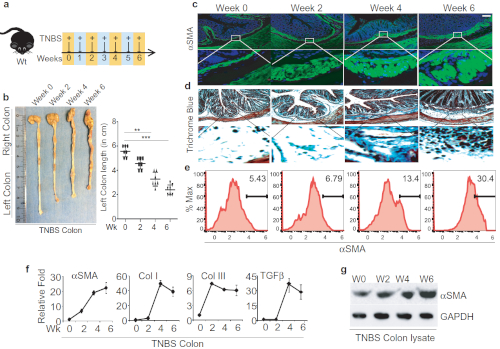
Figure 1: Successful TNBS administration leads to developing intestinal fibrosis in mice. A. Schematic diagram representation of weekly TNBS treatment given to wild-type mice. B. Colon images and measurement of colon lengths from TNBS-treated mice, harvested on weeks 0, 2, 4, and 6 post-TNSB treatment. C-D. Colon sections' histological analysis stained with anti-αSMA antibody for activation of myofibroblasts and trichrome blue staining for collagen; scale bar 100 µm. E. FACS analysis to identify αSMA-positive cells in the colon and quantification of αSMA-positive cells. F. Fibrotic markers and cytokines detected by qPCR. G. western blot analysis of αSMA from colon lysate of TNBS-treated and control mice. This modified figure is being reused with the permission of previous publication9 in Mucosal Immunology, 2019 by Mathur et al. Please click here to view a larger version of this figure.
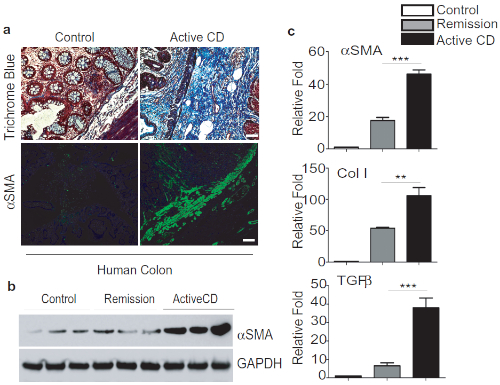
Figure 2: TNBS Fibrosis is comparable to Crohn's-associated Intestinal fibrosis. A. Representative images of colon biopsies of control, active CD showing a significant increase of trichrome blue staining and αSMA-positive staining in submucosal layers, scale bar 50 µm. B. Western blot analysis of αSMA expression and quantification. C. qPCR analysis of fibrotic markers and cytokines. This modified figure is being reused with the permission of previous publication9 in Mucosal Immunology, 2019 by Mathur et al. Please click here to view a larger version of this figure.
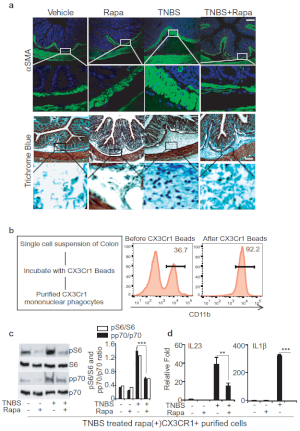
Figure 3: Rapamycin treatment effectively ameliorates TNBS-induced fibrosis. A. Colon histological analysis - representative images of myofibroblast staining with anti-αSMA antibody and collagen staining with Trichrome blue, scale bar 100 µm. B. qPCR analysis of αSMA, Collagen and TGFβ expression in Control/TNBS-treated mouse colons. C. FACS analysis of αSMA in single cell suspension from mouse colon treated with Control/TNBS. D. Schematic for purification of Cx3Cr1+ cells from colonic lamina propria fraction and FACS analysis of purified cells. E. Western blot analysis of p-p70 and p-S6 levels in purified Cx3Cr1+ mononuclear phagocytes from mice treated with TNBS and/or rapamycin. F. qPCR analysis of the expression in purified Cx3Cr1+ mononuclear phagocytes, which produces IL-23 and IL-1β. This modified figure is being reused with the permission of previous publication9 in Mucosal Immunology, 2019 by Mathur et al. Please click here to view a larger version of this figure.
Discussion
Wound healing or tissue repair is a tightly regulated biological process17. During tissue injury with a chemical, mechanical and infection condition, an inflammatory response triggers the tissue repair process. However, a dysregulated and pathological inflammatory response leads to developing scarring or a fibrotic reaction, which could impair the tissue repair function9,18,19. Here, we show the procedure for the TNBS-induced fibrosis animal model, which significantly shares pathophysiology with human Crohn's disease. Successive inoculation of TNBS chemical exposure to damage the mouse epithelium causes deep ulcerations and induces fibrosis development. With a reliable, low cost, and rapid induction of disease onset, this method is widely accepted by multiple research groups involved in studies for tissue injury, transmural inflammation and the gut-brain axis.
To successfully implement the TNBS fibrosis model, there are several essential steps. For example, adequate dosage and timing of TNBS administration are very important. A 6-8-week TNBS inoculation allows deep tissue ulceration and is highly recommended for chronic fibrotic studies. Outcoming stool from mice and the retrograde reflex of inoculated TNBS are two major problems, which could result in delivery of variable doses to mice. Gentle pressure near the mice rectum may help release stools before TNBS administration. Holding the head of the animal down for a few seconds dramatically helps to stop reverse reflux of TNBS. Keeping the mice in a cage, placing the cage on a heat pad, and providing the mice with Napa nectar could also be useful strategies in preventing high mortality.
Here, we also discuss the gut inflammation during TNBS fibrosis and their impact on fibrotic response. mTOR/autophagy role is broadly implicated on intestinal homeostasis and in IBD pathogenesis20,21. We identified that mTOR/autophagy signaling is critical to modulate pro-inflammatory responses from IL-23 and IL1β cytokines from Cx3Cr1+ mononuclear phagocytes that affect pro-fibrotic IL-23/IL-22 axis (Figure 3A)9. Thereby, purifying single Cx3Cr1+ mononuclear cells for immunoprofiling and gene expression is a critical step of the model. We discuss in detail the protocol for isolating lamina propria and provide the purification procedure for Cx3Cr1+ mononuclear cells using magnetic beads.
Collectively, despite the presence of genetic and spontaneous models for Crohn's disease, TNBS-colitis remains a potent tool to study the immuno-pathogenesis of CD and has the potential to evaluate the Crohn's fibrosis treatments. The major limitation of using chemically induced fibrosis models such as TNBS is the chance of high variability from user to user and the possibility of outliers in the data. A sample size of 5-8 animals per group along with greater user experience can increase the consistency of the model. However, finding a suitable genetic model causing spontaneous Crohn's fibrosis is and will always be warranted.
Disclosures
Competing interests: The authors declare no competing interests.
Acknowledgements
This work was supported by NIH grant R01NS093045 (Y.H.), NIH grant K08DK088950 (X.Z.), R03DK099566 (X.Z.), and The Crohn's & Colitis Foundation of America research Fellowship (CCFA) 481637 (R.M.).
Materials
| Name | Company | Catalog Number | Comments |
|---|---|---|---|
| Anti-mouse aSMA, AF488 conjugated, Clone#1A4 | e-bioscience | 53-9760-82 | |
| Anti-mouse aSMA, purified Clone#M1/77 | e-bioscience | 149760-80 | |
| Anti-mouse CD11b, APCCy7 conjugated, Clone#M1/70 | Biolegend Inc | 101226 | |
| Anti-mouse CX3cr1 PE conjugated, Clone#SA011F11 | Biolegend | 149006 | |
| Anti-mouse purified CD16/32 Fc block | Biolegend Inc | 14-9760-80 | |
| Anti-PE MicroBeads | Miltenyi | 130-105-639 | |
| Anti-rabbit IgG, HRP-linked Antibody | e-bioscience | 7074 | |
| Bovine Serum Albumin | InvivoGen | tlrl-isdn | |
| Collagenase type IV | Roche | 1088866001 | |
| DAPI | SIGMA | D9542 | |
| DMEM | Corning | 10013-CV | |
| DNase I from bovine pancreas | Roche | D263-5vl | |
| Falcon® 40µm Cell Strainer | Corning | 352340 | |
| Fixation/Permeabilization Solution Kit with BD GolgiPlug kit | BD Bioscience | 555028 | |
| FlowJo | FlowJo LLC | www.flowjo.com | |
| Glycogen | Roche | 10901393001 | |
| Goat anti-Rabbit IgG (H+L) Secondary Antibody, Alexa Fluor 488 conjugate | e-bioscience | 5018 | |
| Graphpad Prism 7 | GraphPad Software Inc | www.graphpad.com | |
| H&E kit | American Mastertech Kit | HXMMHPT | |
| Image J | NIH | www.imagej.nih.gov/ij/ | |
| Mouse: C57BL/6J | Jackson Laboratories | 664 | |
| MS Columns | Miltenyi | 130-042-201 | |
| Percol | GE Healthcare | 17-0891-01 | |
| PMA/Ionomycin salt | Sigma | P8139 | |
| PowerUp SYBR Green Master Mix | Thermofisher | A25777 | |
| Rabbit Anti mouse GAPDH, Clone# D16H11 | Cell signaling | 5174 | |
| Rabbit Anti mouse p70 S6 Kinase, Clone#49D7 | Cell signaling | 2708 | |
| Rabbit Anti mouse Phospho-p70 S6 Kinase, Clone#S371 | Cell signaling | 9208 | |
| Rabbit Anti mouse Phospho-S6 Ribosomal Protein (Ser235/236), Clone# D57.2.2E | Cell signaling | 4858 | |
| Rabbit Anti mouse S6 Ribosomal Protein | Cell signaling | 2217 | |
| Rapamycin | LC LABORATORIES | 1003799 | |
| TNBS | Sigma | 92823 | |
| Trichorme staining kit | American Mastertech Kit | STOSTBPT | |
| TRIzol | Life technologies | 15596018 | |
| Verso cDNA Synthesis Kit | Thermofisher | AB1453B | |
| Zen black 2.1 | Carl Zeiss | www.zeis.com | |
| Zen blue lite 2.3 | Carl Zeiss | www.zeis.com |
References
- Garrett, W. S., Gordon, J. I., Glimcher, L. H. Homeostasis and inflammation in the intestine. Cell. 140, 859-870 (2010).
- Park, S. G., et al. T regulatory cells maintain intestinal homeostasis by suppressing gammadelta T cells. Immunity. 33, 791-803 (2010).
- Speca, S., Giusti, I., Rieder, F., Latella, G. Cellular and molecular mechanisms of intestinal fibrosis. World Journal of Gastroenterology. 18, 3635-3661 (2012).
- Keubler, L. M., Buettner, M., Hager, C., Bleich, A. A Multihit Model: Colitis Lessons from the Interleukin-10-deficient Mouse. Inflammatory Bowel Disease. 21, 1967-1975 (2015).
- Strober, W., Nakamura, K., Kitani, A. The SAMP1/Yit mouse: another step closer to modeling human inflammatory bowel disease. Journal of Clinical Investigation. 107, 667-670 (2001).
- Ostanin, D. V., et al. T cell transfer model of chronic colitis: concepts, considerations, and tricks of the trade. American Journal of Physiology-Gastroenterology and Liver Physiology. 296, G135-G146 (2009).
- Antoniou, E., et al. The TNBS-induced colitis animal model: An overview. Annals of Medicine and Surgery. 11, 9-15 (2016).
- Loeuillard, E., et al. 2,4,6-trinitrobenzene sulfonic acid-induced chronic colitis with fibrosis and modulation of TGF-beta1 signaling. World Journal of Gastroenterology. 20, 18207-18215 (2014).
- Mathur, R., et al. Induction of autophagy in Cx3cr1(+) mononuclear cells limits IL-23/IL-22 axis-mediated intestinal fibrosis. Mucosal Immunology. 12, 612-623 (2019).
- Joeris, T., Muller-Luda, K., Agace, W. W., Mowat, A. M. Diversity and functions of intestinal mononuclear phagocytes. Mucosal Immunology. 10, 845-864 (2017).
- Mathur, R., et al. A mouse model of Salmonella typhi infection. Cell. 151, 590-602 (2012).
- Zhao, X., et al. Noninflammatory Changes of Microglia Are Sufficient to Cause Epilepsy. Cell Reports. 22, 2080-2093 (2018).
- Murugaiyan, G., et al. MicroRNA-21 promotes Th17 differentiation and mediates experimental autoimmune encephalomyelitis. Journal of Clinical Investigation. 125, 1069-1080 (2015).
- Hinz, B., Celetta, G., Tomasek, J. J., Gabbiani, G., Chaponnier, C. Alpha-smooth muscle actin expression upregulates fibroblast contractile activity. Molecular Biology of the Cell. 12, 2730-2741 (2001).
- Yang, J., et al. Rapamycin Inhibition of mTOR Reduces Levels of the Na+/H+ Exchanger 3 in Intestines of Mice and Humans, Leading to Diarrhea. Gastroenterology. 149, 151-162 (2015).
- Mutalib, M., et al. The use of sirolimus (rapamycin) in the management of refractory inflammatory bowel disease in children. Journal of Crohns and Colitis. 8, 1730-1734 (2014).
- Shaw, T. J., Martin, P. Wound repair at a glance. Journal of Cell Science. 122, 3209-3213 (2009).
- Paul, J., et al. IL-17-driven intestinal fibrosis is inhibited by Itch-mediated ubiquitination of HIC-5. Mucosal Immunology. 11, 427-436 (2018).
- Sohail, I., Ghosh, S., Mukundan, S., Zelewski, S., Khan, M. N. Role of Inflammatory Risk Factors in the Pathogenesis of Streptococcus pneumoniae. Frontiers of Immunology. 9, 2275(2018).
- Laplante, M., Sabatini, D. M. mTOR signaling in growth control and disease. Cell. 149, 274-293 (2012).
- Xavier, R. J., Podolsky, D. K. Unravelling the pathogenesis of inflammatory bowel disease. Nature. 448, 427-434 (2007).
Reprints and Permissions
