This protocol describes transillumination-assisted microdissection of segments of adult mouse seminiferous tubules representing specific stages of seminiferous epithelial cycle, and cell types therein, and subsequent immunostaining of squash preparations and intact tubule segments.
Method Article
Transillumination-Assisted Dissection of Specific Stages of the Mouse Seminiferous Epithelial Cycle for Downstream Immunostaining Analyses
In This Article
Summary
Abstract
Spermatogenesis is a unique differentiation process that ultimately gives rise to one of the most distinct cell types of the body, the sperm. Differentiation of germ cells takes place in the cytoplasmic pockets of somatic Sertoli cells that host 4 to 5 generations of germ cells simultaneously and coordinate and synchronize their development. Therefore, the composition of germ cell types within a cross-section is constant, and these cell associations are also known as stages (I–XII) of the seminiferous epithelial cycle. Importantly, stages can also be identified from intact seminiferous tubules based on their differential light absorption/scatter characteristics revealed by transillumination, and the fact that the stages follow each other along the tubule in a numerical order. This article describes a transillumination-assisted microdissection method for the isolation of seminiferous tubule segments representing specific stages of mouse seminiferous epithelial cycle. The light absorption pattern of seminiferous tubules is first inspected under a dissection microscope, and then tubule segments representing specific stages are cut and used for downstream applications. Here we describe immunostaining protocols for stage-specific squash preparations and for intact tubule segments. This method allows a researcher to focus on biological events taking place at specific phases of spermatogenesis, thus providing a unique tool for developmental, toxicological, and cytological studies of spermatogenesis and underlying molecular mechanisms.
Introduction
Differentiation of male germ cells from diploid spermatogonia to mature haploid spermatozoa, i.e., spermatogenesis, is a complex process that takes place in the epithelium of seminiferous tubules in the testes of a sexually-mature individual1. Mitotic descendants of A1 spermatogonia first divide five times to expand the differentiation-committed population, then enter meiosis as spermatocytes that ultimately give rise to haploid spermatids. Differentiation of round spermatids into spermatozoa, i.e., spermiogenesis, involves complex changes in cellular morphology, including nuclear compaction and construction of sperm-specific structures such as the acrosome and the flagellum. In mouse, the whole process of spermatogenesis takes 35 days to complete2,3.
At any given locale, the seminiferous epithelium hosts up to five cohorts of differentiating germ cells plus the germline stem/progenitor cells and the somatic Sertoli cells1. Differentiating germ cells form concentric layers the composition of which is predictable, and haploid cells at a given step of development always associate with certain types of spermatocytes and spermatogonia4,5. Therefore, any cross-section of a tubule hosts cohorts of germ cells of a constant composition. These specific cell associations are defined as the stages of the seminiferous epithelium. Stages per se do not present stagnant check-point-like states but continually develop as the differentiation of germ cell cohorts progresses in synchrony1,2,6. In mice, there are 12 stages (I-XII)2 that are arranged in a segmental fashion along the longitudinal axis of the seminiferous tubule, and they follow each other in a logical order thus forming the wave of seminiferous epithelium, or spermatogenic wave7,8,9 (Figure 1). Completion of spermatogenesis takes four cycles, and hierarchical layers or cohorts of differentiating germ cells within any seminiferous tubule cross-section are temporally one seminiferous cycle apart from one another. The length of the cycle is species-dependent and in the mouse each cycle takes 8.6 days10.
The stages can be identified on the basis of the cellular composition and organization of the seminiferous epithelium on histological testis sections5 (Figure 1 and Figure 2). However, histological analysis is laborious, time-consuming and requires fixing and staining, and cannot, therefore, be applied to live tissue. Importantly, staging can also be performed on living tissue under a dissection microscope by taking advantage of distinct light absorption/scatter patterns exhibited by different stages of the cycle (Figure 2). The ability of each stage to absorb and scatter light is relative to the level of chromatin condensation of late post-meiotic spermatids that any given stage hosts and the packing of these cells in bundles7,11. Spermatid differentiation, i.e., spermiogenesis, is further divided into 16 developmental steps, including 8 steps of round spermatid (step 1-8) and 8 steps of elongating spermatid (steps 9-16) differentiation (Figure 1). Step 9-11 elongating spermatids (stage IX-XI) display only a low level of chromatin condensation resulting in low amount of light being absorbed. Chromatin condensation begins in step 11 spermatids (stage XI), and step 15-16 elongating spermatids (stage IV-VIII) contain fully condensed chromatin, and therefore exhibit maximal light absorption (Figure 3). Chromatin needs to be condensed in order to be tightly packed into the sperm head. Additional factors that contribute to light absorption pattern are location of elongating spermatids within the epithelium (basal vs. apical) and bundling of elongating spermatids (pronounced in stages II-V)11 (Figure 3). Bundles are seen as spots in the middle of the tubules and as stripes on the edges under a dissection microscope and the more condensed the chromatin, the darker the spot/stripe11.
This article describes the use of transillumination-assisted microdissection method for the isolation of seminiferous tubule segments representing specific stages of the seminiferous epithelial cycle. Once isolated, staged tubule segments can be subject to various downstream analyses, including biochemical RNA and protein analyses12,13,14,15, flow cytometry16, ex vivo tubule culture17 and immunostaining18. Here we also provide detailed downstream protocols to prepare squashed monolayers of staged tubule segments for live cell morphological analysis and subsequent immunostaining, as well as whole-mount immunostainings of tubule segments. The workflow in a nutshell in described in Figure 4.
The transillumination-assisted microdissection method allows accurate identification and isolation of germ cells at specific steps of differentiation thanks to the synchronized cellular composition of the stages. Importantly, it also enables the study of stage-dependent events during spermatogenesis on live tissue. Given the lack of scalable in vitro models for spermatogenesis, this method also has a unique advantage of allowing targeted short-term developmental and toxicological studies on stage-specific tubule segments ex vivo12,17. While we describe the method here for the mouse, the same procedure can be applied to any mammalian species with longitudinal and segmental arrangement of seminiferous epithelial stages, such as the rat4,7,15,19,20.
Protocol
Maintenance of laboratory mice and all animal experiments were done in accordance with the relevant guidelines and regulations for the care and use of laboratory animals in University of Turku.
1. Preparation of seminiferous tubules for microdissection
- Sacrifice an adult male mouse (≥8 weeks old, testis 80–120 mg depending on the strain and age) via CO2 asphyxiation followed by cervical dislocation.
NOTE: The mouse should be sexually mature, and preferably at least 8 weeks old. Transillumination pattern of juvenile mice differs from adult because the wave of the seminiferous epithelium has not yet been fully established, and the timing of the first wave of spermatogenesis is distinct21,22. Lack of elongating spermatids in <4-week-old male mice precludes their use for transillumination-assisted microdissection. All mouse strains that have normal spermatogenesis can be used. - Spray the ventral abdomen with 70% ethanol. Open the abdominopelvic cavity using sterile scissors, making a V-shaped opening.
- Pulling on the epididymal fat pad with sterile forceps, locate the testes, dissect them using scissors and place them on a sterile 100-mm Petri dish containing PBS.
NOTE: To maintain sterility, make sure all labware and surgical tools are sterile. - Using fine-tipped scissors decapsulate the testes by cutting a slit in the tunica albuginea, the thick fibrous sheet encapsulating the testis. Then tear the tunica open using a pair of forceps. Force the tubules out by pressing with forceps and discard the tunica.
NOTE: While discarding the tunica, it might be beneficial for some downstream applications that arteria testicularis is removed together with the tunica. Avoid damaging the seminiferous tubules. - Move the seminiferous tubules to a new Petri dish and pour enough sterile PBS to cover the bottom of the Petri dish. Next, gently pull the tubules apart but avoid damaging the tubules.
NOTE: Too much mechanical stress will impinge on the transillumination pattern and affect the viability of the tissue and its cellular architecture. The tubules can also be processed for whole-mount immunostainings from this point without staging (3B). Sometimes it is sufficient to define the stage retrospectively by including antibodies against proteins expressed in differentiating spermatogonia, such as SALL4, c-KIT and DNMT3A18,23. The density of spermatogonia is a relatively reliable stage indicator (Figure 2).
2. Transillumination-assisted microdissection
- Place the Petri dish under a dissection microscope firmly by taping it to the stage.
NOTE: It is important to tape the Petri dish well to prevent its movement which could cause mixing of the collected staged seminiferous tubule segments. - To reveal the light absorption pattern of seminiferous tubules under focus, make sure that the sample is illuminated from below and the light passes through the sample, i.e., it is transilluminated.
NOTE: The amount of light absorbed/scattered is relative to the level of chromatin condensation in elongating spermatids and their bundling inside the seminiferous tubule: the more condensed, the more light is absorbed, i.e., appears darker. - Get acquainted with the light absorption pattern of different stages as described in Figure 2, Figure 5A and Figure S1 by carefully moving bundles of tubules using fine forceps.
NOTE: The stages always follow each other in a logical order, forming the wave of seminiferous epithelium. However, it is important to know that the direction of the spermatogenic wave occasionally reverses and then reverts back again (also known as modulations4,9), sometimes complicating the procedure. Also, the length of each stage, in terms of how many mm of tubule, varies considerably. - Carefully lift the tubule of interest using forceps with a hooked tip, and then cut a segment of appropriate length using microdissection scissors (see Supplementary Video 1). A hook at the tip of the forceps makes lifting and holding a tubule easier and helps to avoid squeezing it.
NOTE: The length of the segments to be cut depends on downstream applications. For the collection of pooled tubule pieces of a specific stage for protein or RNA analysis12,13 (II–V, VII–VIII and IX–XI, Figure 5B) the length is typically 2–5 mm. When standard phenol-chloroform extraction is used, around 200 ng of RNA can be derived from 1 mm of tubule. For whole-mount staining of staged tubule segments, the length of the segments should be >5 mm. For squash preparations the length of segments should not exceed 1–2 mm because the cells in the middle of the segment may fail to exit if too long. Use a mm scale under the Petri dish for an accurate measurement of the tubule length.
3. Immunostaining of different preparations
- Squash preparation: stage verification and immunostaining
NOTE: Stage-specific tubule pieces can be squashed on a microscope slide with a cover glass to perform morphological analysis of living cells by phase-contrast microscopy and subsequent immunostaining. A beginner is recommended to use this approach to verify the stages when getting acquainted with the transillumination-assisted microdissection method.- Collect the segment in a volume of 10 μL using a pipette and move it onto a microscope slide.
- Squash the tubule by placing a cover glass (20 mm x 20 mm) carefully on the tubule. As a result, cells will flow out the tubule and form a live-cell monolayer. Place a filter paper on the edge of the cover glass to facilitate the spreading of cells. Avoid squashing the cells too much to keep them alive.
- Monitor cell spreading under a microscope. Use a phase-contrast microscope at 40x objective to verify stage recognition by examining the cell types present (Figure 2, Figure S2).
- Once the cells have spread to form a round monolayer from both ends of the tubule, dip the slide into a container containing liquid nitrogen while holding it with forceps. Keep it submerged for 10 s. Alternatively place the slide on a dry ice plate for freezing.
- Remove the cover glass by flipping it off using a scalpel.
- Without a delay, proceed with the fixation and quickly place the slide in a container with 90% ethanol for 2–5 min.
NOTE: Make sure the squash preparation does not thaw before placing it to 90% ethanol. Other fixatives can also be used, such as acetone, for 10 min. - Air-dry and store at room temperature (RT) (up to some days) or at -80 °C (long-term).
- For immunostaining, post-fix the samples in 4% paraformaldehyde (PFA) for 10 min at RT.
- Rinse in PBS and permeabilize with 0.1% Triton X-100 in PBS for 5 min.
- Rinse in PBS and draw a grease ring around each squash sample.
- Add 50–100 μL of 10% BSA (bovine serum albumin) in 0.1% Tween in PBS (PBST) inside the grease ring and block samples for 30 min at RT.
- Remove the BSA solution and incubate with a primary antibody diluted in 10% BSA in PBST for 1 h at RT.
- Wash 3x for 5 min with PBST.
- Incubate with a secondary antibody diluted in 10% BSA in PBST.
NOTE: To stain the acrosomes, the samples can be incubated with Rhodamine-labeled Peanut agglutinin antibody (PNA, 1:1000) in 10% BSA in PBST for 1 h at RT (Figure S3) instead of specific primary and secondary antibodies. - Wash 3x for 5 min each with PBST, rinse with PBS and mount with a mountant containing DAPI.
- Whole-mount immunostaining of seminiferous tubules
NOTE: The protocol below describes whole-mount staining for staged (from step 2.4) tubule segments. If a researcher wants to perform whole-mount staining without staging (from step 1.5), pay attention to notes in 3.2.1 and 3.2.7.- Using a pipette, transfer the tubule segments (from step 2.4) in ice-cold PBS into a 15 mL conical tube and allow them to sediment on ice.
NOTE: If using unstaged tubules from 1.5., separate the tubules in a Petri dish by pipetting up and back onto a tilted dish several times. Use a 1-mL pipette with a cut tip. This step is intended to open up the structure of the tissue. However, avoid too much pipetting as it might damage the tubules. Sedimentation of tubules will take some tens of seconds. Small tubule fragments, interstitial cells and cell debris stay in the supernatant. - Carefully remove the supernatant (SN) by pipetting or with an aspirator. Add 10 mL of ice-cold PBS and mix by inversion.
- Allow to sediment and then remove SN as before.
- Add 5 mL of 4% PFA and fix for 5 h on a rotating table (20–30 rpm) at +4 °C.
NOTE: Fixation time depends on the proteins of interest and their subcellular localization. For nuclear and cytoplasmic proteins, a 2 h fixation is typically sufficient, however, membrane markers, such as GFRα1 (GDNF family receptor alpha 1; Figure 6A,B), benefit from a longer fixation, up to 6 h. - Allow to sediment, remove SN (PFA) as before, and rinse briefly by adding 10 mL of PBS and inverting the tube.
- Allow to sediment, remove SN as before, and repeat the PBS washing step three times for at least 10 min each on a rotating table at +4 °C and proceed with staining or store at +4 °C.
NOTE: If the working conditions are sterile and clean the samples can be stored and used for at least some weeks. Alternatively, add Sodium Azide to a final concentration of 0.02% (w/v) from a 2% stock solution to help preserve the tubules prior to storing at +4 °C. - Using a 1-mL pipette, move 10–20 fixed tubule segments to a 2-mL round-bottom tube. Allow to sediment and remove SN.
NOTE: If working with long tubules that have not been staged, pour the tubules onto a Petri dish and using microdissection scissors and forceps cut segments of around 5–20 mm. Too long segments will tangle during the staining procedure, whereas too short segments are easily lost. - Add 1 mL of 2% BSA + 10% FBS (fetal bovine serum) in 0.3% Triton X-100 in PBS (PBSX). Block for at least 1 h on a rotating table (20–30 rpm) at RT.
- Rinse with 1 mL of PBSX, remove SN by pipetting and add 250 μL of primary antibody diluted in 1% BSA in PBSX (1:100–1:2000 dilution). Incubate for 2 h at RT or overnight at +4 °C on a rotating table (20–30 rpm).
- Remove the antibody solution by pipetting and rinse the tubules with 1 mL of PBSX as above. Wash three times for 1 h in PBSX on a rotating table (20–30 rpm) at RT.
NOTE: After this first wash the sample can be left overnight at +4 °C if necessary. - Remove SN and add 250 μL of secondary antibody diluted in 1% BSA in PBSX (typically 1:500 dilution of a fluorescent-labeled antibody). Cover in foil and incubate on a rotating table (20–30 rpm) at RT for 1 h.
- Repeat 3.2.10.
- Finally remove SN and pour the tubules to a microscope slide. Gently separate and arrange tubules in linear strips using gel-loading tips. Drain off excess buffer and add mounting medium and a coverslip.
NOTE: Avoid drying of the tubules while arranging them. Counter-staining of the nuclei with DAPI is not necessary in most cases. Seal off the edge of the coverslip with nail polish to prevent sample drying and deterioration. Slides can be stored for 1–2 weeks at +4 °C before imaging.
- Using a pipette, transfer the tubule segments (from step 2.4) in ice-cold PBS into a 15 mL conical tube and allow them to sediment on ice.
Results
A successful transillumination-assisted staging and microdissection of mouse seminiferous tubules depends primarily on finding the proper lighting conditions and a suitable dissection microscope, and the ability to recognize specific features that characterize each stage. Stages VII-VIII appear homogenously dark because they contain a high number of fully condensed elongating spermatids that are aligned at the apical surface of the epithelium (Figure 5A and Figure S1). After mature spermatozoa are released into the lumen in spermiation, the tubule appears very pale at stages IX–XI due to the absence of condensed elongating spermatids in the epithelium. The easiest feature to identify on transilluminated tubules is the point of spermiation (asterisk in Figure 5A and Figure S1), that is the sudden transition from the dark zone (VII–VIII) to the pale zone (IX–XI). The pale zone is followed by the weak spot zone (XII–I). The spotty appearance originates from the organization of elongating spermatids with condensed chromatin in bundles. The bundles become very prominent in the following strong spot zone (II–V). Furthermore, spermatid bundles migrate towards Sertoli cell nuclei that are located close to the basal lamina, which is reflected as striped appearance of stage II–V tubule when transilluminated (Figure 2, Figure 5A,B and Figure S1). Bundles finally disperse at stage VI and condensing elongating spermatids move close to the lumen to be released from the epithelium at stage VIII.
The exact stage of the tubule segment can be accurately verified by phase-contrast microscopy of squash preparations (Figure 2 and Figure S2). The specific stages in squash preparations are recognized on the basis of the acrosomal development of step 1–8 round spermatids, the status of chromatin condensation in elongating spermatids, and the presence of spermatid bundles16 (Figure 3 and Figure S2). Furthermore, the presence of earlier cell types, such as type B spermatogonia and leptotene or zygotene spermatocytes, that can be recognized on the basis of their morphological features, can be used to support stage recognition. The size of pachytene spermatocyte nuclei increases in size at around stage VI, which may also provide additional help in staging.
Staged squash preparations can be used to study the expression and localization of proteins of interest in the seminiferous epithelium using immunostaining. This allows very accurate analysis of cell type-specific expression because of the well-defined cellular composition at each stage. Stage-specific expression can be further augmented by co-staining of the acrosome (e.g., with PNA) that enables visualization of distinct steps of round spermatid differentiation. Representative images of PNA-stained acrosomes at various stages are provided in Figure S3. The acrosomal staining can also be used to define the stage retrospectively. However, the transillumination-assisted staging is a considerably easier and faster method to find the desired stage than using unstaged fragments in a haphazard manner.
Seminiferous tubule whole-mount staining is typically used to study the cell types that are in contact with the basement membrane of the seminiferous epithelium, either on the tubular side (spermatogonia, preleptotene spermatocytes and Sertoli cells; Figure 6A,B) or the interstitial side (peritubular myoid cells and peritubular macrophages; Figure 6C and Figure S4A)24. However, the method can also be used to study cells or structures that are located deeper in the epithelium, such as the blood-testis barrier (Espin, Figure S4B), or postmeiotic germ cells (acrosome marker PNA, Figure S4C). If using unstaged tubule segments, it is possible to estimate a given stage retrospectively using an antibody against a protein that is expressed in differentiating spermatogonia (A1, A2, A3, A4, In and B; collectively Adiff) (Figure 2). Staging then relies on density of syncytial Adiff that undergo six mitotic divisions in a stage-dependent manner during the first cycle of spermatogenic differentiation1, therefore doubling the number of Adiff spermatogonia in syncytia after each division1,25. However, retrospective staging is less accurate than transillumination-assisted staging because there are no specific markers for distinct generations of Adiff and assessment of Adiff density may be prone to error.
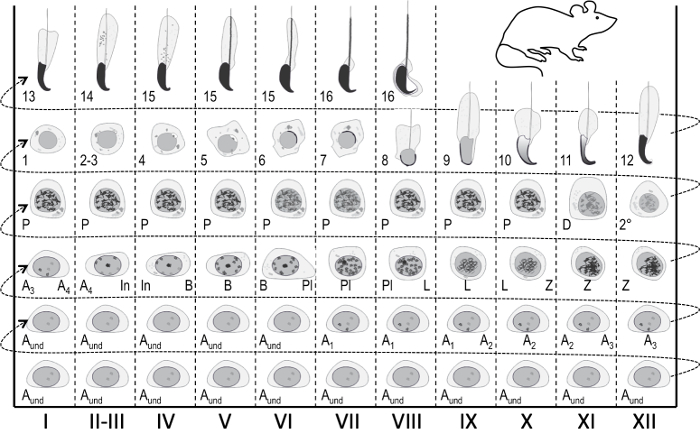
Figure 1: Seminiferous epithelial cycle map for staging of mouse spermatogenesis. Vertical columns show cell associations at different stages of the seminiferous epithelial cycle (marked with Roman numerals I–XII). The most immature germ cells are at the bottom, whereas the most differentiated are at the top. To follow the progress of germ cell differentiation, one has to move from left to right, and from bottom to top. A cycle of the seminiferous epithelium is a complete series of stages that follow one another in a numerical order. Aund, undifferentiated spermatogonia; A1–4, type A1–A4 spermatogonia; In, intermediate spermatogonia; B, type B spermatogonia; Pl, preleptotene spermatocytes; L, leptotene spermatocytes; Z, zygotene spermatocytes; P, pachytene spermatocytes; D, diplotene spermatocytes; 2°, secondary spermatocytes plus meiotic divisions. Arabic numerals 1-16 refer to steps of post-meiotic spermatid maturation (spermiogenesis). Please click here to view a larger version of this figure.
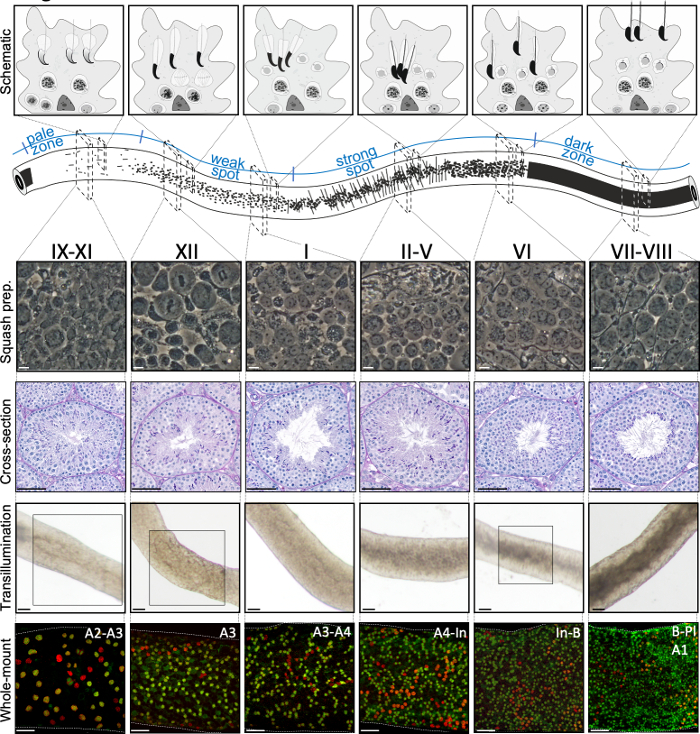
Figure 2: Cell associations in stages of the mouse seminiferous epithelial cycle. Stages of the seminiferous epithelial cycle follow each other in a logical order, and thus form the spermatogenic wave along the longitudinal axis of a seminiferous tubule. The top panel illustrates the germ cell associations at different stages, and the location of cell types within the cytoplasmic pockets of Sertoli cells (light grey) in the seminiferous epithelium. The illustration of the seminiferous tubule visualizes the spermatogenic wave and specific transillumination patterns of the pale, weak spot, strong spot and dark zones. From each indicated stage, representative living cell phase-contrast images of squash preparations and periodic acid-Schiff (PAS)-stained testis cross-sections are shown. Bottom two panels show segments of seminiferous tubule after transillumination (top) or staining with antibodies (bottom) against SALL4 (red, a pan-spermatogonial marker) and DNMT3A (green, an Adiff marker). The transillumination patterns for stages IX-XI, XII and VI are highlighted with boxed areas. Both light absorption pattern (top) and density of DNMT3A-positive differentiating spermatogonia (bottom) can be used to define the (approximate) stage of the seminiferous cycle. Successive generations of Adiff are referred to as type A1–A4, intermediate (In) and type B spermatogonia. Division of each results in doubling of spermatogonial cell density. The highest cell density on the basement membrane of the seminiferous epithelium is seen in stages VI–VIII when meiotic preleptotene spermatocytes (Pl) are observed. Scale bars: squash prep. 10 μm, others 50μm. Please click here to view a larger version of this figure.
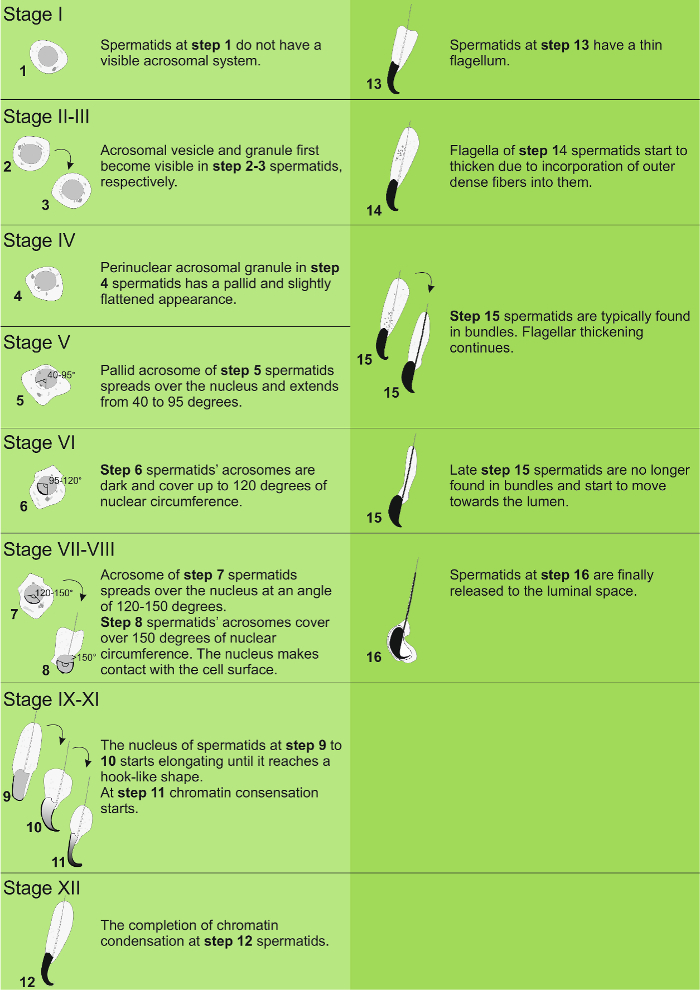
Figure 3: Steps of spermiogenesis. Distinctive features of spermatids at different steps of spermiogenesis. Please click here to view a larger version of this figure.
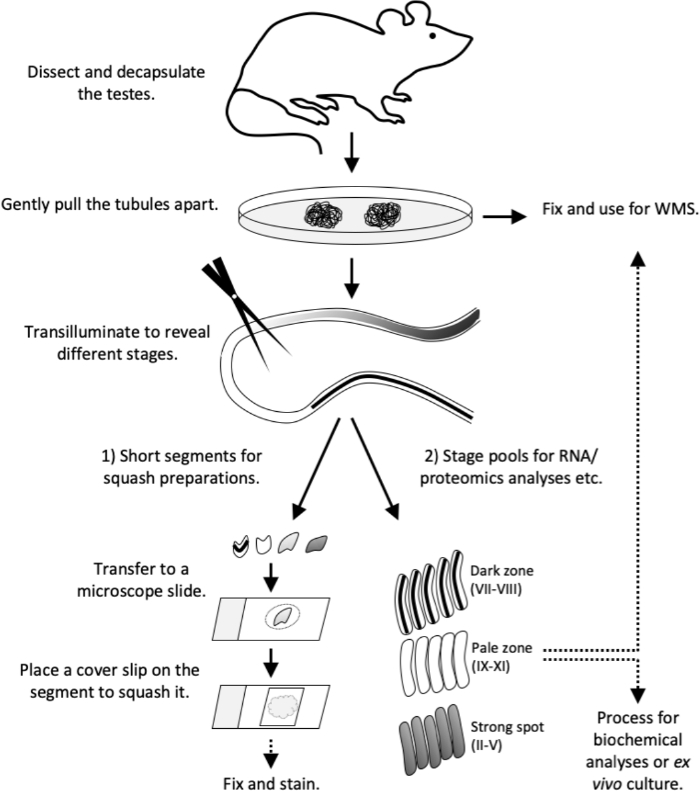
Figure 4: Workflow of this study. Transillumination pattern has been fully established in an adult (>8-week old) mouse. Sacrifice the mouse and proceed with testis dissection and decapsulation without delay. Gently pull the tubules apart on a Petri dish. Fix tubules for whole-mount stainings or proceed with transillumination. Under transillumination 1) cut short tubule segments of specific stage(s) for squash preparations (quality control or for immunostaining) or 2) cut longer segments to collect stage pools for RNA and proteomics analyses, tissue culture or for whole-mount stainings. Transfer short tubule segments to a microscope slide in 10 µL volume of PBS. Place a cover slip on the segment to force out the cells and to form a live cell monolayer. Observe the cell types under a microscope, then fix and stain. WMS, whole-mount staining. Please click here to view a larger version of this figure.
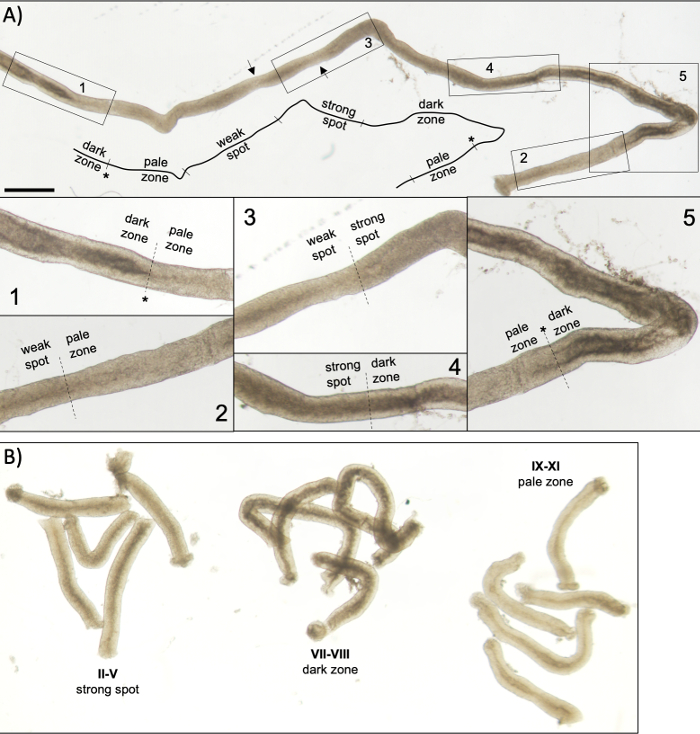
Figure 5: Seminiferous tubule of an adult mouse as seen under transillumination microscopy. (A) A long segment of seminiferous tubule as seen under transillumination displaying the wave of seminiferous epithelium. Four distinct zones can be identified based on chromatin compaction in spermatids and their localization within the epithelium: dark zone (stages VII–VIII), pale zone (stages IX-XI), weak spot zone (stages XII–I), and strong spot zone (stages II–VI). Asterisk, spermiation point. Arrows indicate two short segments within the weak spot zone that have a pale appearance due to mechanical stress on the tubule. Scale bar: 500 μm. Insets 1–5 are higher magnifications from selected tubule segments. (B) Pooled segments of seminiferous tubule representing stages II–V (strong spot zone), VII–VIII (dark zone) and IX–XI (pale zone). Please click here to view a larger version of this figure.
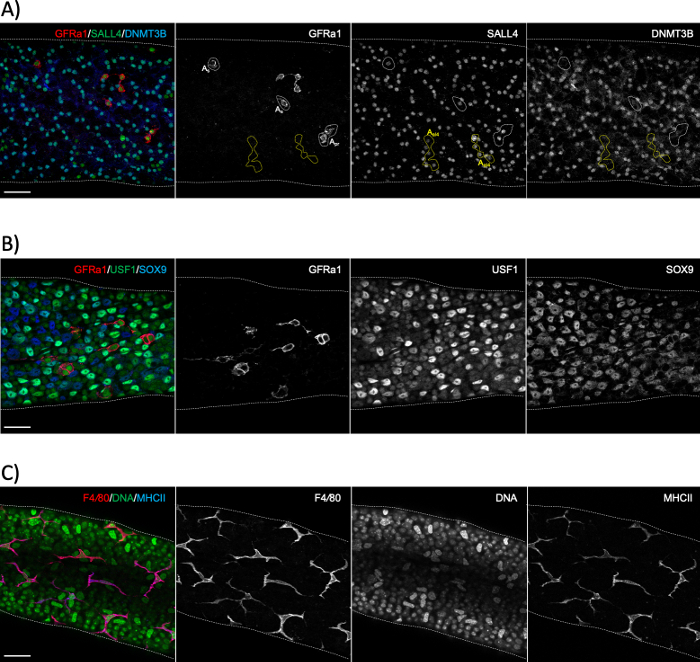
Figure 6: Whole-mount immunostainings using spermatogonial, Sertoli cell and peritubular macrophage markers. (A) Whole-mount staining for a segment representing stage XI–II with antibodies against GFRα1 (red), SALL4 (green) and DNMT3B (blue). The staining reveals three distinct populations of spermatogonia: singly-isolated (As) or paired (Apr) undifferentiated stem spermatogonia (GFRα1+/SALL4+/DNMT3B-; white dotted areas), short syncytial (here 4 aligned cells; Aal4) progenitor spermatogonia (GFRα1-/SALL4+/DNMT3B-; yellow dotted areas) and differentiating spermatogonia (GFRα1-/SALL4+/DNMT3B+). SALL4+/DNMT3B+ cells are type A3–A4 spermatogonia. (B) Whole-mount seminiferous tubule staining with antibodies against GFRα1 (red), USF1 (green) and SOX9 (blue). GFRα1 stains the stem subset of spermatogonia. USF1 is expressed by both spermatogonia and SOX9+ Sertoli cells. (C) Peritubular macrophages in adult mice are positive for both F4/80 (red) and MHCII (blue). DAPI stains DNA (green). Bright large nuclei are peritubular myoid cell nuclei. Scale bars: 50 μm. Please click here to view a larger version of this figure.
Figure S1: A long segment of seminiferous tubule as seen under transillumination displaying the wave of seminiferous epithelium. Four distinct zones can be identified based on chromatin compaction in spermatids and their localization within the epithelium: weak spot zone (stages XII–I), strong spot zone (stages II–VI), dark zone (stages VII–VIII), and pale zone (stages IX–XI). Spermiation point (asterisk) can be recognized as the dark zone abruptly transits into the pale zone. Scale bar: 500 μm. Insets 1–4 are higher magnifications from selected tubule segments. Please click here to download this figure.
Figure S2: Phase-contrast microscopy of live-cell monolayers of different stages of the seminiferous epithelial cycle. (A) Stage I. Step 1 round spermatids still lack the acrosomal structure. They are characterized by a small round nucleus (red circles) with a distinctive single chromocenter (white arrows). The chromatoid body is visible in the cytoplasm as a dark granule in close contact with the nuclear membrane (blue arrows). Sertoli cell nucleus (white circle) contains three dark foci: a large nucleolus with two satellite chromocenters. Sertoli cells are unoften seen in squash preparations but they occasionally flow out from the tubule along with germ cells. (B) Stage II–IV. In step 4 round spermatids (red circles), the acrosomal structure (red arrows) appears as a white slightly flattened vesicle attached to the nuclear envelope. Elongating spermatids form bundles and have already a thick flagellum (white arrows) indicating the presence of mitochondrial sheath in the mid piece of the sperm tail. The nuclei of pachytene spermatocytes (PSpc) are roughly twice as large as those of round spermatids and are characterized by dark chromatin regions distributed throughout the nucleus. (C) Stage V–VI. In step 5–6 round spermatids (red circle), the acrosome is further flattened and spreads over the nucleus (red arrows). The area of the nuclear envelope facing the acrosome appears dark due to the presence of the acroplaxome, a protein-rich plate between the acrosomal membrane and the nuclear membrane. Elongating spermatids are released from bundles (white arrows). Pachytene spermatocytes (PSpc) are frequently observed in the epithelium. (D) Stage VII-VIII. The acrosome (red arrows), a dark lining on the nuclear envelope with white shadows, is fully extended and covers almost the entire apical side of step 7-8 round spermatids (red circles). This stage is characterized by mature spermatids (white arrows) that may be abundant on many parts of the squash preparation. The nucleus of pachytene spermatocytes (PSpc) grows in size during development and appear larger in stage VII–VIII than in previous stages. The dark chromatin areas inside the nucleus of pachytene spermatocytes (PSpc) appear fuzzy due to high transcriptional activity and meiotic events. (E) Stage X. Step 10 spermatid nuclei (white arrows) have initiated elongation but the chromatin has not condensed yet. Acrosomes start forming a hook at the nuclear tip (red arrow). The nuclei of pachytene spermatocytes (PSpc) appear very large as they are preparing for meiotic divisions. (F) Stage XII. Stage XII is characterized by the presence of meiotic metaphase plates (white dashed circles). Small round cells with typical condensed chromatin pattern are zygotene spermatocytes (ZSpc), in which the sister chromosomes are aligning to initiate synaptonemal complex formation. Scale bars: 10 μm. Please click here to download this figure.
Figure S3: Identifying the stage of seminiferous epithelial cycle on the basis of acrosomal and nuclear staining. Acetone-fixed squash preparations were stained with Rhodamine-conjugated PNA and DAPI. Stage I: While no acrosome exists in step 1 round spermatids a fully developed acrosome can be detected in elongating spermatids. Stages II–IV: Acrosomal development begins with the appearance of proacrosomal/acrosomal granules in round spermatids. The acrosomal vesicle on the nuclear surface appears round until step 3 spermatids, and then flattens in step 4 spermatids. Stage V: The angle subtended by the acrosome extends from 40 degrees to a maximum of 95°. Stages VI–VII: The angle subtended by the acrosome extends from 95 degrees to 120 degrees. Stages VIII-IX: The acrosome is fully extended in step 8 spermatids (stage VIII), and nuclei polarize on the apical side of the cell making contact with the plasma membrane (not shown). By stage IX the spermatids nucleus becomes deformed; dorsal and ventral surfaces are first seen. Stages X-XI: Spermatids show the dorsal angle. Stage XII: This stage is best characterized by the appearance of meiotic divisions; metaphase plates are indicated with white arrows. Elongating spermatids with their acrosomes are also seen. Scale bars: 10μm. Please click here to download this figure.
Figure S4: Whole-mount staining for unconventional markers. (A) Alpha smooth muscle actin (aSMA) is expressed by peritubular myoid cells. (B) Espin localizes to Sertoli cell tight junctions and contributes to the blood-testis barrier. (C) PNA localizes to acrosomes of spermatids. Scale bars: 50μm. Please click here to download this figure.
Supplementary video 1: Cutting a short segment of seminiferous tubule representing stage VII-VIII. Please click here to download this video.
Discussion
The transillumination-assisted microdissection method that we have described above enables a stage-oriented approach for the study of spermatogenesis. Spermatogenesis is a highly synchronized process, and all key steps during the spermatogenic differentiation are regulated and executed in a stage-dependent manner, such as differentiation commitment (at stages VII-VIII), onset of meiosis (VII-VIII), meiotic divisions (XII), onset of spermatid elongation (VIII) and spermiation (VIII)1,26,27. The stage-oriented analysis provides a powerful tool to study these particular events that are restricted to specific steps of spermatogenesis and therefore found only at defined stages of the seminiferous epithelial cycle. Mastering the method takes some practice and use of a good quality dissection microscope and proper illuminating conditions are key to success. Implementing this method as a part of the everyday toolkit has a capacity to greatly improve the impact and biological relevance of research on male reproductive functions by allowing more accurate dissection of molecular events during spermatogenesis.
All WT mouse strains that we have studied display a similar transillumination pattern and exhibit conserved cell associations at stages of the seminiferous epithelial cycle. On the condition that spermiogenic differentiation of germ cells is not grossly different from WT mice, the same also applies to all the knock-out mouse models that we have studied. Moreover, it can be applied to other species that exhibit longitudinal segmental arrangement of stages of the seminiferous epithelial cycle7. However, species with non-segmental stages (such as human) cannot be used. Given the essential role of chromatin condensation in elongating spermatids in defining the transillumination pattern, it is clear that any misregulation of this process will inevitably impinge on the implementation of this method. In juvenile mice and young adults (5-6 weeks) the transillumination pattern has not yet been fully established, and, therefore, only mice older than 8 weeks should be used. It is also important to bear in mind that squeezing and pulling the tubules will inevitably impinge on the transillumination pattern because it distorts the cellular architecture within the seminiferous epithelium.
The isolated seminiferous tubule segments can also be cultured enabling ex vivo observation and manipulation of spermatogenesis-coupled processes, including meiosis. To ensure viability of the tissue and to prevent RNA and protein degradation, the samples should be collected and processed no more than 2 hours after sacrificing the mouse. For ex vivo culture of seminiferous tubules, the time from sacrifice to onset of culture should not exceed 1 hour. The integrity of tubule fragments can typically be maintained up to 72 hours in vitro if harvested properly.
The stage of the seminiferous epithelial cycle can be verified and even more accurately defined using phase-contrast microcopy of squash preparations16. Microscopy is performed on living cells, which provides an additional dimension into the analysis and allows observation of organelle or cell movements in specific stages of spermatogenesis28,29,30. Phase-contrast microscopy provides exact staging for subsequent immunostaining, which enables very detailed analysis of protein expression and localization dynamics during spermatogenesis, including stage-specific changes.
While cells are released from the epithelial context in squash preparations, whole-mount immunostainings of tubule segments enable the study of spermatogenic cells in their physiological environment. Therefore, whole-mount preparations may provide a better visualization of seminiferous tubule architecture and its intercellular contacts than immunostaining on cross-sections. Importantly, transillumination-assisted staging of the tubule segments prior to immunostaining makes the approach even more powerful by including information on the specific stage of a given segment. Whole-mount staining is a particularly useful tool for the study of cells at the periphery of seminiferous tubules, such as peritubular myoid cells, peritubular macrophages and spermatogonia, but might also open novel insights into research on meiotic and postmeiotic germ cells.
Disclosures
The authors have nothing to disclose.
Acknowledgements
This work was supported by grants from Academy of Finland [315948, 314387 to N.K.]; Sigrid Jusélius Foundation [to N.K., J.T.]; Emil Aaltonen Foundation [to J.-A.M., T.L.]; Turku Doctoral Programme of Molecular Medicine [S.C.-M., O.O.].
Materials
| Name | Company | Catalog Number | Comments |
|---|---|---|---|
| bovine serum albumin (BSA) | Sigma | A9647 | |
| cover glass 20x20 mm | Menzel Gläser | 11961988 | |
| Falcon conical tube 15-ml | Sarstedt | 62.554.502 | |
| fetal bovine serum (FBS) | Biowest | S1810 | |
| grease pen (ImmEdge) | Vector Laboratories | H-4000 | |
| microscope slide Superfrost Plus | Thermo Scientific | 22-037-246 | |
| Parafolmaldehyde (PFA) | Electron Microscopy Sciences | 15714 | |
| Petri dish (100-mm) | Greiner | 664160 | |
| phosphate-buffered saline (PBS) | Gibco | 11503387 | |
| ProLong Diamond Antifade Mountant | Thermo Fisher | P36962 | |
| rhodamine-labelled Peanut agglutinin (PNA) | Vector Laboratories | RL-1072 | |
| Triton X-100 | Sigma | 93443 | |
| Tween-20 | Sigma | P2287 |
References
- Mäkelä, J. A., Toppari, J. Testis Physiology: Seminiferous Cycle. Encyclopedia of Reproduction. , Elseiver. (2018).
- Oakberg, E. F. Duration of spermatogenesis in the mouse and timing of stages of the cycle of the seminiferous epithelium. The American Journal of Anatomy. 99 (3), 507-516 (1956).
- Clermont, Y. Kinetics of spermatogenesis in mammals: seminiferous epithelium cycle and spermatogonial renewal. Physiological Reviews. 52 (1), 198-236 (1972).
- Perey, B., Clermont, Y., Leblond, C. The wave of the seminiferous epithelium in the rat. American Journal of Anatomy. 108 (1), 47-77 (1961).
- de Lima e Martins Lara, N., Costa, G., Avelar, G., Lacerda, S., Hess, R., França, L. Testis Physiology-Overview and Histology. Encyclopedia of Reproduction. , ELseiver. (2018).
- Leblond, C. P., Clermont, Y. Definition of the stages of the cycle of the seminiferous epithelium in the rat. Annals of the New York Academy of Sciences. 55 (4), 548-573 (1952).
- Parvinen, M. Regulation of the seminiferous epithelium. Endocrine Reviews. 3 (4), 404-417 (1982).
- Kotaja, N., et al. Preparation, isolation and characterization of stage-specific spermatogenic cells for cellular and molecular analysis. Nature Methods. 1 (3), 249-254 (2004).
- Nakata, H., Sonomura, T., Iseki, S. Three-dimensional analysis of seminiferous tubules and spermatogenic waves in mice. Reproduction. 154 (5), Cambridge, England. 569-579 (2017).
- Russell, L. D., Ettlin, R. A., SinhaHikim, A. P., Clegg, E. D. Histological and histopathological evaluation of the testis. , Cache River Press. Clearwater, FL. (1990).
- Parvinen, M., Hecht, N. B. Identification of living spermatogenic cells of the mouse by transillumination-phase contrast microscopic technique for "in situ" analyses of DNA polymerase activities. Histochemistry. 71 (4), 567-579 (1981).
- Ventelä, S., Mäkelä, J. A., Kulmala, J., Westermarck, J., Toppari, J. Identification and regulation of a stage-specific stem cell niche enriched by Nanog-positive spermatogonial stem cells in the mouse testis. Stem Cells. 30 (5), Dayton, Ohio. 1008-1020 (2012).
- Faisal, I., et al. Transcription factor USF1 is required for maintenance of germline stem cells in male mice. Endocrinology. 160 (5), 1119-1136 (2019).
- Wright, W. W., et al. Identification of stage-specific proteins synthesized by rat seminiferous tubules. Biology of Reproduction. 29 (1), 257-270 (1983).
- Johnston, D. S., et al. Stage-specific gene expression is a fundamental characteristic of rat spermatogenic cells and Sertoli cells. Proceedings of the National Academy of Sciences of the United States of America. 105 (24), 8315-8320 (2008).
- Toppari, J., Bishop, P. C., Parker, J. W., diZerega, G. S. DNA flow cytometric analysis of mouse seminiferous epithelium. Cytometry. 9 (5), 456-462 (1988).
- Mäkelä, J. A., et al. Hedgehog signalling promotes germ cell survival in the rat testis. Reproduction. 142 (5), Cambridge, England. 711-721 (2011).
- La, H. M., et al. Identification of dynamic undifferentiated cell states within the male germline. Nature Communications. 9 (1), 04827(2018).
- Toppari, J., Parvinen, M. In vitro differentiation of rat seminiferous tubular segments from defined stages of the epithelial cycle morphologic and immunolocalization analysis. Journal of Andrology. 6 (6), 334-343 (1985).
- Parvinen, M., Vanha-Perttula, T. Identification and enzyme quantitation of the stages of the seminiferous epithelial wave in the rat. The Anatomical Record. 174 (4), 435-449 (1972).
- Kluin, P. M., Kramer, M. F., de Rooij, D. G. Spermatogenesis in the immature mouse proceeds faster than in the adult. International Journal of Andrology. 5 (3), 282-294 (1982).
- Yoshida, S., et al. The first round of mouse spermatogenesis is a distinctive program that lacks the self-renewing spermatogonia stage. Development. 133 (8), Cambridge, England. 1495-1505 (2006).
- Chan, A. L., et al. Germline stem cell activity is sustained by SALL4-dependent silencing of distinct tumor suppressor genes. Stem Cell Reports. 9 (3), 956-971 (2017).
- Lokka, E., et al. Generation, localization and functions of macrophages during the development of testis. Nat Commun. 11 (1), 4375(2020).
- Mäkelä, J. A., Toppari, J. Testis physiology: Spermatogenic cell syncytium. Encyclopedia of Reproduction. , Elseiver. (2018).
- Griswold, M. D. Spermatogenesis: The commitment to meiosis. Physiological Reviews. 96 (1), 1-17 (2016).
- Mäkelä, J. A., Toppari, J. Spermatogenesis. Endocrinology of the Testis and Male Reproduction. , 1-39 (2017).
- Ventela, S., Toppari, J., Parvinen, M. Intercellular organelle traffic through cytoplasmic bridges in early spermatids of the rat: mechanisms of haploid gene product sharing. Molecular Biology of the Cell. 14 (7), 2768-2780 (2003).
- Parvinen, M., Parvinen, L. M. Active movements of the chromatoid body. A possible transport mechanism for haploid gene products. The Journal of Cell Biology. 80 (3), 621-628 (1979).
- Parvinen, M., Söderström, K. O. Chromosome rotation and formation of synapsis. Nature. 260 (5551), 534-535 (1976).
Reprints and Permissions
