The aim of this article is to give the viewer a solid understanding of how to transform their small-volume, vapor-diffusion protocol, for growing large, single protein crystals, into a large-volume batch micro-crystallization method for serial crystallography.
Method Article
Optimizing the Growth of Endothiapepsin Crystals for Serial Crystallography Experiments
In This Article
Summary
Abstract
Here, a protocol is presented to facilitate the creation of large volumes (> 100 µL) of micro-crystalline slurries suitable for serial crystallography experiments at both synchrotrons and XFELs. The method is based upon an understanding of the protein crystal phase diagram, and how that knowledge can be utilized. The method is divided into three stages: (1) optimizing crystal morphology, (2) transitioning to batch, and (3) scaling. Stage 1 involves finding well diffracting, single crystals, hopefully but not necessarily, presenting in a cube-like morphology. In Stage 2, the Stage 1 condition is optimized by crystal growth time. This strategy can transform crystals grown by vapor diffusion to batch. Once crystal growth can occur within approximately 24 h, a morphogram of the protein and precipitant mixture can be plotted and used as the basis for a scaling strategy (Stage 3). When crystals can be grown in batch, scaling can be attempted, and the crystal size and concentration optimized as the volume is increased. Endothiapepsin has been used as a demonstration protein for this protocol. Some of the decisions presented are specific to endothiapepsin. However, it is hoped that the way they have been applied will inspire a way of thinking about this procedure that others can adapt to their own projects.
Introduction
Room temperature (RT) macromolecular crystallography is popular again within the structural biology community. The development of X-ray Free Electron Laser (XFEL) light sources has spurred the development of RT sample delivery approaches1,2,3,4, and these methods have now been applied to synchrotrons5,6,7,8. Not only do RT methods open up the possibility of pump-probe experimental strageties9,10,11,12, but there is also mounting evidence that they promote alternative conformational states within proteins13,14,15,16,17.
However, the principal reason why cryo-methods gained traction over RT approaches in the late 1990s was the slowing of radiation damage by sub-zero crystal temperatures18. Cryo-methods19 began to allow for the collection of a complete dataset from a single protein crystal. Modern RT methods at XFELs and synchrotrons solved the problem of single-crystal radiation damage by the development of rapid (> 100 Hz) crystal delivery strategies1,2,3,4. These methods allow for the collection of a complete dataset from thousands of individually exposed crystals. These RT delivery approaches therefore require the production of large quantities of solutions containing homogenous micro-crystals (> 100 µL of < 50 µm crystals). However, since cryo-methods tend to only require single crystals, methods to create such micro-crystalline slurries are currently not ubiquitous across protein crystallography laboratories.
There are examples in the literature of how to do parts of the micro-crystallization optimization procedure for serial crystallography samples. Here, a distinction should be made between membrane and soluble proteins. Protocols to optimize the growth of micro-membrane protein crystals grown in monoolein (or some other lipid), for lipidic cubic phase (LCP), have been well described20,21,22. However, methods for the micro-crystallization of soluble proteins, including membrane proteins grown in non-LCP conditions, are generally lacking. Previous studies have focused on specific parts of the process, such as micro-crystal screening23,24, enhancing nucleation24, and scaling using free-interface diffusion25, but not a complete method.
However, a method was recently described26 that attempts to offer a complete protocol. Like many aspects of protein crystallography, it is not new. Many of the ideas proposed were already described by Rayment (2002)27. The method aims to show crystallographers how to perform the conversion from a single, crystal grown using vapor diffusion, to a batch methodology to grow thousands of micro-crystals. The method focuses on vapor diffusion as a common starting point, as 95% of all Protein Data Bank (PDB) depositions come from crystals grown in vapor diffusion plates26. Vapor diffusion is, however, not the ideal method for micro-crystallization26, so a methodology is described to convert vapor diffusion to batch crystallization. Once crystals can be grown in batch, scaling routes to larger volumes become more practicable. Given the vagaries of protein crystallization, the authors would stress that this method is not failsafe. However, the protocol should, at least, provide an insight into the 'crystallization space' of a protein.
This method relies on the protein crystallization phase diagram and how an understanding of that diagram can act as a guide during micro-crystallization optimization. A protein phase diagram is commonly depicted as an x/y plot with precipitant and protein concentrations on the x and y axes, respectively (Figure 1A). From the pure water point (bottom left corner - Figure 1A), the concentration of both protein and precipitant increases until the solubility line is reached. The solubility line marks the point of supersaturation (purple line - Figure 1A). When a protein is supersaturated, the solution becomes thermodynamically unstable and will begin separating into two phases: 'protein-rich' and a stable saturated solution. This separation can occur anywhere beyond the solubility line and its kinetics are dependent upon the properties of the protein and the components of the solution.
When the protein and precipitant concentrations are too great, the protein will decompose unstably out of solution and result in amorphous precipitate (pink region - Figure 1A). However, ordered phase separation can occur in the nucleation region [see Garcia-Ruiz (2003)28 for detailed description] and crystal nucleants have the propensity to form (green region - Figure 1A). Nucleation and growth removes protein from the solution and moves the drop into the metastable region where growth can continue until the solubility line is reached [see McPherson and Kuznetsov (2014)29 for detailed discussion]. The diagram is, for the vast majority of crystallization conditions, a gross oversimplification30. Regardless of this however, the diagram is still of great utility for micro-crystallographers as the mapping of the diagram allows for the solubility line and the kinetics of nucleation to be determined.
In terms of creating micro-crystals, the two factors during crystallization that need to be optimized are the number of crystals (Xn) and their mean, longest dimension (Xs). Xn will be proportional to the number of nucleation events (n) (Eq. 1).
 Eq. 1
Eq. 1
Xs is proportional to the concentration of free protein above the solubility line (Ps) divided by Xn (Eq. 2).
 Eq. 2
Eq. 2
In a perfect situation, every nucleation event would yield a possible crystal and every one of these crystals, would have equal access to the available protein in solution. Figure 2 is a graphical representation from an ideal scenario of the relationship between Xn and Xs. Practically, the principal control a crystallographer has over Xn and Xs is by influencing the amount of nucleation or by the addition of seed crystals. The micro-crystallographer must judge how to increase Xn such that a suitable crystal concentration and crystal size can both be created.
The majority of crystallization techniques require a 'transitionary period' (Figure 1B). For example, in a vapor diffusion experiment, upon mixing the protein and precipitant solutions, the concentrations of each will change as the drop equilibrates with the well solution. One hopes that these changes will gradually transition the drop into the nucleation zone where the propensity for crystallization will increase. As crystals begin to nucleate and grow, the amount of protein in solution will begin to fall, decreasing the probability of further nucleation. The ultimate amount of nucleation will be protein and condition specific, and also dependent upon the depth of penetration of into the nucleation zone. Given the limited nucleation zone penetration of methods that require a transitionary step, the level of nucleation will ultimately be limited to the rate of nucleation at the metastable-nucleation region boundary.
Due to the importance of being able to enhance the level of nucleation for a micro-crystallographer, it is important to move to a batch crystallization methodology. Batch can take greater advantage of the whole nucleation region (Figure 1C). In batch methods, the idea is to mix the protein and precipitant together such that a supersaturated solution is created without the need of any changes in component concentrations. Nucleation should be possible immediately upon mixing. Batch methods therefore allow for the entire nucleation zone to be theoretically reached. Any increase in nucleation kinetics beyond the metastable-nucleation boundary can then be utilized.
If the basal-level of crystal nucleation is not enough to generate a large Xn, micro-seeding methods can be used. In micro-seeding, pre-grown crystals are broken up to create a slurry of crystalline fragments which can act as a scaffold for fresh crystal growth31,32. Micro-seeding has been widely used in serial crystallographic sample preparation as a way to increase Xn without the need of increasing crystal nucleation (Figure 1C).
The transition from vapor diffusion to batch can be visualized on a phase diagram as moving the experimental starting point from either the non-supersaturated or metastable regions to the nucleation zone. This can be done by increasing the protein and/or precipitant concentrations, and/or the ratio of the two within the drop (Figure 1D), and observing which conditions yield crystals appearing rapidly (< 24 h)26. Complete vapor diffusion drop equilibration can take days or weeks33. Therefore, by looking for conditions that show rapidly appearing crystals, batch conditions can be found without having to move to alternative crystallization screening formats such as micro-batch34,35,36,37.
Once the nucleation zone has been found, a batch condition has been found and a morphogram - here, a rough phase diagram - can be created. The morphogram is of great utility when contemplating whether to use a seeded-batch or straight batch protocol. By plotting the Xn as a function of the protein and precipitant concentration, an assessment of the nucleation kinetics can be made26. If Xn remains low across the whole nucleation region, seeded-batch may be required to make Xn large enough to limit crystal growth. This assessment is the first step in the process of scaling to larger volumes (> 100 µL).
This method was designed such that it could be conducted in the majority of crystallization laboratories by using standard vapor diffusion crystallization equipment. Many studies have also been conducted which describe techniques to facilitate many parts of this process, should the equipment be available. These include, but are not limited to, dynamic light scattering (DLS)25,27, non-linear imaging20,24,25, powder diffraction20,24,27, and electron microscopy26 [see Cheng et al. (2020)40 for a nice review].
The aim of this work is to provide a visual demonstration of the method to transition from small volume (< 500 nL) vapor diffusion crystallization to large volume (> 100 µL) batch crystallization. Endothiapepsin from Cryphonectria parasitica has been used as an example system for demonstrating this translation. The type of experiment and sample delivery method that the micro-crystals are required for will influence the ideal Xs output26. For mixing experiments requiring a millisecond time resolution41 or gas-dynamic virtual nozzles42, a final Xs of < 5 µm may be desirable. In this case, the goal was to produce protein crystals that diffract to approximately 1.5 Å, for a photon-activated pump-probe experiment, and using a fixed-target delivery approach.
To give an illustration of the sample requirements of such a serial crystallography experiment using endothiapepsin, Table 1 shows the experimental parameters of a hypothetical experiment. The sample information was based upon the protocol described below. Given some conservative estimates on hit rates and data collection requirements, 50 mg is the total sample consumption estimate for the whole experiment.
Figure 3 shows a flow-chart of the complete optimization process from initial small volume vapor diffusion crystallization to large scale batch. For the majority of serial crystallography projects, this protocol will begin at Step 2: 'transitioning to batch', since the target protein will already have been crystallized. However, Step 1 has been included for completeness and to remind readers of its importance. Finding a condition that gives rise to a well diffracting, single, large crystal is the best starting point for micro-crystal optimization. In Step 2, this condition can then be optimized from vapor diffusion to batch, and a morphogram of the nucleation and metastable regions can be plotted. Once this has been done, scaling the batch condition to larger volumes can be performed in Step 3. By the end of the flow-chart, a crystallographer will have created a repeatable, large-volume (> 100 µL), micro-crystallization, batch protocol for endothiapepsin. This method can then be applied to their particular protein of interest.
Protocol
NOTE: All 96-well sitting-drop crystallization experiments were setup using either 2 or 3-drop plates. A liquid handling robot and a crystallization imager/hotel were used to facilitate the preparation and monitoring of all 96-well screens. All reagent concentrations for crystallization experiments are given at their starting concentrations prior to mixing.
1. Optimizing crystal morphology
NOTE: Steps 1.1.1. and 1.1.6. describe how endothiapepsin crystallization conditions were found, and how these conditions were optimized to find a single condition that yielded single, well-diffracting crystals.
- Sparse-matrix optimization
- Prepare fresh endothiapepsin solution.
NOTE: Endothiapepsin, when procured as Superan 600, must be buffer transferred out of its storage solution and concentrated.- Prepare 3 L of 0.1 M Na Acetate pH 4.6 at 4 °C.
- Cut 20 cm of dialysis tubing and briefly wash in the buffer. Seal one end of the tubing using a clip, place 50 mL of the endothiapepsin solution into the tubing and then seal the other end.
- Leave the solution to dialyze for at least 4 h (or overnight) at 4 °C in 1 L of the Na Acetate buffer. Due to the components of the storage buffer, the solution in the dialysis bag will now be approximately 100 mL.
- Transfer the dialysis bag containing the endothiapepsin into a fresh liter of 4 °C, 0.1 M Na Acetate pH 4.6. Repeat this step once more such that the original buffer has been diluted 2000x against the Na Acetate.
- The endothiapepsin will now be at approximately 10 mg/mL. Concentrate to 100 mg/mL using a 10 kDa centrifugal concentrator and a centrifuge.
- Flash cool the endothiapepsin solution in liquid nitrogen in 50 µL aliquots and store at -80 °C.
- Prepare a PACT Premier 96-well sparse-matrix screen.
- Using a liquid handling robot, dispense 100 nL of 70 mg/mL endothiapepsin and 100 nL of well solution into a single sub-well per well. Mix the protein and well solution 3 times upon addition of the crystallization buffer.
- Seal the plate and leave for 28 days at 20 °C taking images every day for the first week and then every week thereafter for 4 weeks.
- Sparse-matrix analysis
- Identify hits that produce single endothiapepsin crystals. From the PACT screen, conditions that contained MgCl2 grew as singletons rather than needle clusters.
- Sparse-matrix optimization
- From the MgCl2 containing conditions identified in Step 1.1.3.1, create a 96-well screen randomly combining and varying the different well components.
- Using a liquid handling robot, dispense 100 nL of 70 mg/mL endothiapepsin and 100 nL of well solution into a single sub-well per well. Mix the protein and well solution 3 times upon addition of the crystallization buffer.
- Seal the plate and leave for 28 days at 20 °C taking images every day for the first week and then every week thereafter for 4 weeks.
- Optimization analysis
- Using suitable spreadsheet software, rank the crystallization conditions that give rise to crystals based on the crystal quality and precipitation level, no crystals (0) to ideal (5) and low (0) to high (5), respectively. With respect to crystal quality, the broad criteria are single crystals with a box-like morphology.
- Perform a Pearson's correlation analysis between the crystallization condition contents and the crystal quantity and precipitation level.
- Plot these data as a heat map. Look for components and conditions that were correlated with the preferred outcomes.
- Diffraction analysis.
- Confirm that the crystals grown from the identified conditions in Step 1.1.5 are suitable for serial crystallography by performing an X-ray diffraction experiment.
- Load a sample of the endothiapepsin crystals from each of the identified conditions onto supports that allow for data collection at either 100 or 293 K and perform an X-ray diffraction experiment. If working under cryo, use 25% ethylene glycol as the cryo-protectant.
- Process these data via a suitable software suite. Endothiapepsin crystals should diffract to beyond 1.5 Å. Check for twinning, as twinned crystals can significantly complicate serial crystallographic data processing.
- If crystals are singletons and diffract to 1.5 Å proceed to Step 2. If not, go back to Step 1.1.2 and try more sparse-matrix screens to identify promising conditions. After the analyses conducted in Steps 1.1.5. and 1.1.6., a crystallization condition of 25% (w/v) PEG 6,000, 0.1 M Tris-HCl pH 7.0 and 0.15 M MgCl2 should have been found as the approximate ideal.
- Prepare fresh endothiapepsin solution.
2. Transitioning to batch
- Morphogram experiment
- Create a micro-crystal seed stock.
NOTE: It is best practice when making seed-stocks, to make the seeds from crystals specifically grown for the task. This greatly helps with reproducibility. Other ideas presented in Steps 2.1.1.1 to 2.1.1.11 are to always use the crystals grown from a standard number of wells - here 5 - and aliquot the stocks once they are made to negate freeze-thaw cycles.- Prepare a 96-well crystallization plate with wells containing the crystallization buffer: 25% (w/v) PEG 6,000, 0.1 M Tris-HCl pH 7.0 and 0.15 M MgCl2.
- Using a liquid handling robot, dispense 200 nL of defrosted 70 mg/mL endothiapepsin and 200 nL of well solution into a single sub-well per well. Mix the protein and well solution 3 times upon addition of the crystallization buffer.
- Seal the plate and leave for 24 h.
- Fill a 1.5 mL centrifuge tube with 250 µL of crystallization buffer and 10-15 1 mm glass beads. Leave the centrifuge tube on ice to cool for 5-10 min.
- Select 5 wells with crystals, open the wells with a scalpel and, using a pipette tip, crush the crystals in the wells.
- Aspirate 1 µL of buffer from the iced centrifuge tube and use to homogenize the crushed crystal slurry. Once homogeneous, aspirate the entire slurry and collect in the cooled centrifuge tube.
- Repeat Step 2.1.2.6 for each of the 5 sub-wells.
- Vortex the centrifuge tube containing the buffer, pooled slurries and beads at 1000 rpm for 30 s.
- Return the centrifuge tube to ice for 30 s.
- Repeat Steps 2.1.2.8 and 2.1.2.9 two more times.
- The seed-stock is now ready and can be aliquoted into 10 µL batches and stored at -20 °C.
- Perform morphogram experiment.
- Prepare a 2-drop 96-well grid screen. Vary the concentration of PEG 6,000 from 5 to 40% (w/v) along the plate columns, keeping the buffer and salt at 0.1 M Tris-HCl pH 7.0 and 0.15 M MgCl2, respectively.
- Prepare a sequential dilution of endothiapepsin in 0.1 M Na Acetate pH 4.6 from 100 to 12.5 mg/mL over 8 steps. A different concentration of endothiapepsin will be used for each row of the plate.
- Using a liquid handling robot, dispense 150 nL of endothiapepsin into both sub-wells 1 and 2. In sub-well 1, dispense 150 nL of the well solution. In sub-well 2, multi-aspirate 50 nL of defrosted seed-stock and 100 nL of well solution, and then dispense both into the protein solution. Mix the solutions 3 times upon addition of the crystallization buffer.
- Seal the plate and leave at 20 °C taking images every 0, 3, 6, 12, 18, 24 h, then every day for the first week, and every week for the next four. If automatic imaging is not possible, do not worry about the hourly imaging on day 1.
- Create a micro-crystal seed stock.
- Morphogram analysis
- Looking at the images taken after 24 h, estimate the number of crystals that are present in each well and record these estimates in the "morphogram generator" worksheet provided. These estimates do not have to be precise; individually counting thousands of micro-crystals, if present, is not practical or necessary. Principally try to ensure the estimates are consistent over the whole plate.
NOTE: The 24 h rule was based upon the observations made in Beale et al. (2019)26. Vapor diffusion crystallization conditions can take days or weeks to equilibrate. Crystals that appear rapidly are more likely to have grown via a batch process rather than by the gradual equilibration of the drop components. The 24 h criterion is, therefore, somewhat arbitrary and an exact cut-off time between a batch and vapor diffusion experiment will depend on the specific mixture of the condition [see Beale et al. (2019)26 for full details]. - Input the starting concentrations of endothiapepsin and PEG 6,000 in the boxes indicated.
- The worksheet will automatically plot the results in the traditional phase diagram format with precipitant and protein concentration on the x and y axes, respectively. Well conditions that only give rise to crystals in their seeded drops indicate the metastable region of the diagram (transparent blue), whereas conditions that have crystals in both the seeded and non-seeded drops indicate the nucleation zone (solid green).
NOTE: Ideally, the majority of the nucleation zone should be present on the diagram (i.e., there are some clear wells on the bottom of the diagram and some precipitate should be visible at high protein and precipitant concentrations). If this is not the case, perhaps, repeat the experiment but increase the protein and/or precipitant concentration (if possible). - If crystal have appeared in less than 24 h, proceed to Step 2.3.1. If not, proceed to Step 2.4 and continue optimizing towards batch.
- Looking at the images taken after 24 h, estimate the number of crystals that are present in each well and record these estimates in the "morphogram generator" worksheet provided. These estimates do not have to be precise; individually counting thousands of micro-crystals, if present, is not practical or necessary. Principally try to ensure the estimates are consistent over the whole plate.
- Crystal analysis
- As said at the end of Step 1, before moving to the next step, ensure these crystals have the desired morphology and diffraction quality. With regard to morphology, are the crystals observably untwinned and forming as singletons rather than needle-ball-like or fan-like structures? With regard to diffraction, collect diffraction data from the crystals if possible. If these crystals do not diffract, it is improbable that the crystals grown in a larger volume will diffract.
- Load a sample of the endothiapepsin crystals from the morphogram experiment onto supports that allow for data collection at either 100 or 293 K and perform an X-ray diffraction experiment. If working under cryo, use 25% ethylene glycol as the cryo-protectant.
- Process these data via a suitable software suite. Endothiapepsin crystals should diffract to beyond 1.5 Å. Across the sample of crystals, observe the cell size, the total number of observations, and the mosaicity; these measures will give an indication as to the homogeneity of the diffracting crystals.
- If the crystal morphology and diffraction quality is sufficient, proceed to Step 3.
- Optimize crystal growth time.
NOTE: The morphogram analysis (Step 2.2) will have given an indication of the crystallization starting point (i.e., the region of the phase diagram where the drop is located when the precipitant and protein solutions were mixed). Is the drop in the metastable region or below the solubility line? Batch crystallization begins in the nucleation zone (Figure 1C). The goal of this step is to move this starting point from either below the solubility line or metastable region, into the nucleation zone (Figure 1D). If the seeded-drops from Step 2.2. have yielded crystals rapidly, this is an indication that the drop mixture is already in the metastable region, if not, then it is likely the drop is not supersaturated.- Optimizing crystal growth time.
- Using the same screen as in Step 2.1.3, prepare a 96-well vapor diffusion crystallization experiment in a 3-drop plate.
- Increase the starting protein concentration of endothiapepsin on the y axis (i.e., concentrate the protein further, perhaps 120 mg/mL for endothiapepsin).
- Perform a serial dilution, as in Step 2.1.3.2, such that each row of the plate contains a sequentially lower protein concentration.
- Use different drop ratios in each of the three drops on the plate: 1:1, 1:2, and 2:1, protein:precipitant.
- View or image the plate on the first day at 0, 3, 6, 12, 18, 24 h and then every day for the first week, and every week for the next four. If automatic imaging is not possible, do not worry about the hourly imaging on day 1.
- Identify drops that produce the most rapidly appearing crystals and makes these the starting points of repeated optimizations until crystal growth occurs within 24 h.
- When a rapidly appearing crystal-condition has been identified return to Step 2.1 to replot the morphogram as a prelude to begin scaling.
- Optimizing crystal growth time.
3. Scaling
- Rank scaling routes. At this stage, it is not necessary to decide on a single scaling route, only to identify and rank the options so that they can be explored in turn. As the volume of the batch mixture is increased during the scaling procedure, changes will occur in the rate of nucleation and the range of crystal sizes. However, these can be overcome by careful tweaking of component concentrations as the scaled volume is increased.
NOTE: Steps 3.1.1 and 3.1.2 describe how to discern, from the morphogram, whether a batch or seeded-batch protocol is more appropriate.- Straight batch protocol
- Is the Xn in the nucleation zone proportional to the protein and/or precipitant concentration? I.e. does Xn increase as a function of either precipitant and/or protein concentration? - Yes? Go to Step 3.1.1.2. No? Go to Step 3.1.2.
- Locate conditions that yield crystals of the required size and go to Step 3.2.
- Seeded-batch protocol
- Is the Xn flat across the nucleation zone? I.e., Xn does not increase as a function of either precipitant and/or protein concentration.
- Locate seeded conditions that yield crystals of the required size and go to Step 3.2. If all crystals are too large - go to Step 3.1.2.3.
- Repeat the morphogram experiment (Step 2.1) but this time increase the concentration of the seed-stock used in the seeded wells. The seed stock can be increased by using more crystals in its creation. For example, instead of 5 wells in Step 2.1.1.5, use 10 wells.
- View or image the plate over the first 0, 3, 6, 12, 18, 24 h.
- The Xn should have increased and the Xs decreased in the seeded-drops. Repeat this cycle if smaller crystals are needed and then follow a seeded-batch protocol.
- Straight batch protocol
- Gradually scaling
- Scaling in 96-well plates. From the endothiapepsin morphogram, a straight batch method using the crystallization condition 0.1 M Tris-HCl pH 7.0, 0.15 M MgCl2, and 30% (w/v) PEG 6,000, was initially selected for scaling. 100 mg/mL endothiapepsin mixed with the crystallization buffer in a 1:1 ratio.
- Prepare 2-3 wells in a 2-well 96-well sitting-drop plate with 100 µL of 0.1 M Tris-HCl pH 7.0, 0.15 M MgCl2, and 30% (w/v) PEG 6,000.
- Using freshly defrosted 100 mg/mL endothiapepsin solution, dispense 0.5 µL of protein and 0.5 µL precipitant per well, seal and store at 20°C.
- View or image the plate over the first 0, 3, 6, 12, 18, 24 h. Note any changes in the range of Xs and Xn.
- If changes have occurred, repeat Steps 3.2.1.1 to 3.2.1.2 but increase or decrease the protein, precipitant, and/or seed concentration to restore any changes to the range of Xs and Xn.
- When the range of Xs and Xn are acceptable, proceed to Step 3.2.2.
- Scaling in 24-well hanging-drop plates
- Prepare a single well of a 24-well hanging-drop plate by greasing the edges of the well with vacuum grease.
- Prepare 0.5 mL of 0.1 M Tris-HCl pH 7.0, 0.15 M MgCl2, and 30% (w/v) PEG 6,000 and fill the greased well.
- Using freshly defrosted endothiapepsin solution, pipette 1 µL of protein onto the surface of a glass coverslip. Pipette 1 µL of crystallization buffer onto the protein drop and mix using the pipette.
- View or image the plate over the first 0, 3, 6, 12, 24 h. Note any changes in the range of Xs and Xn.
- If changes have occurred, repeat Steps 3.2.2.1 to 3.2.2.4 but increase or decrease the protein, precipitant, and/or seed concentration to restore any changes to the range of Xs and Xn.
- When/if the range of Xs and Xn are acceptable, proceed to Step 3.2.2.7.
- Repeat Steps 3.2.2.1 to 3.2.2.5, increasing the total volume of the experiment gradually to 10 µL.
- Once at a volume of 10 µL or larger, proceed to centrifuge tubes in Step 3.2.3.
- Scaling in centrifuge tubes
NOTE: The refinement of the endothiapepsin batch condition principally happened at the point of 200 µL volumes (see Results, Scaling). The process began with a crystallization condition of 0.1 M Tris-HCl pH 7.0, 0.15 M MgCl2, and 30% (w/v) PEG 6,000. However, the PEG concentration ultimately changed to 40% (w/v). Seeds were also required to control the Xn, and to prevent crystals growing too large, crystal growth had to be quenched. Steps 3.2.3.1 to 3.2.3.7 detail the process of condition optimization. Step 3.2.4. describe the final batch protocol.- Prepare 1 mL crystallization buffer: 0.1 M Tris-HCl pH 7.0, 0.15 M MgCl2, and 30% (w/v) PEG 6,000.
- Using freshly defrosted 100 mg/mL endothiapepsin add 25 µL of protein to a 1.5 mL centrifuge tube.
- Thoroughly mix the crystallization buffer with the protein solution in a 1:1 ratio with a pipette tip. Place the tube in a revolver/rotator with high agitation at 20 °C.
- Take regular (5, 10, 30, 60 min, 2, 5, 10, 24 h) 2.5 µL aliquots and view in a hemocytometer. Record the Xn and the Xs range.
- If changes have occurred, repeat Steps 3.2.3.1. to 3.2.3.4. but increase or decrease the protein, precipitant, and/or seed concentration to restore any changes to the range of Xs and Xn
- When the range of Xs and Xn are acceptable, proceed to Step 3.2.3.7.
- Repeat Steps 3.2.2.1 to 3.2.2.5, increasing the total volume of the experiment gradually to 200 µL or larger, as required.
- Final seeded-batch protocol
- Prepare seed-stock.
- Prepare 2 mL of crystallization buffer: 0.1 M Tris-HCl pH 7.0, 0.15 M MgCl2, and 40% (w/v) PEG 6,000.
- Using freshly defrosted 100 mg/mL endothiapepsin add 100 µL of protein to a 1.5 mL centrifuge tube.
- Thoroughly mix the crystallization buffer with the protein solution in a 1:1 ratio with a pipette tip. Place the tube in a revolver/rotator with high agitation at 20 °C for 24 h to allow 50 µm crystals to grow.
- Add 10-15 1 mm glass beads to the 50 µm crystal slurry.
- Vortex the centrifuge tube containing the slurry and beads at 1000 rpm for 30 s.
- Return the centrifuge tube to ice for 30 s.
- Repeat Steps 3.2.4.1.5 and 3.2.4.1.6 10 more times.
- This is now 200 µL of a 1x seed-stock. Dilute the seed-stock 10x by the addition of 1.8 mL of crystallization buffer. Aliquot the 10x seed-stock in 50 µL batches and store at -20 °C.
- Seeded-batch protocol.
- Prepare crystallization buffer: 0.1 M Tris-HCl pH 7.0, 0.15 M MgCl2, and 40% (w/v) PEG 6,000.
- In a centrifuge tube, mix 100 µL of crystallization buffer with the 50 µL of freshly defrosted 10x seed-stock.
- Using freshly defrosted 100 mg/mL endothiapepsin add 150 µL of protein to a 1.5 mL centrifuge tube.
- Thoroughly mix the crystallization buffer/seed mixture with the endothiapepsin solution with a pipette tip and place the tube in a revolver/rotator with high agitation at 20 °C.
- Monitor the crystallization by taking regular 2.5 µL aliquots and view the crystals in a hemocytometer. Record the Xn and the Xs range.
- After approximately 80 min, when the crystals have reached an Xs of 15 µm, quench the reaction by the addition of 150 µL of 0.05 M Na Acetate pH 4.6, 0.05 M Tris-HCl pH 7.0, 0.075 M MgCl2, and 20% (w/v) PEG 6,000 (a solution composed of endothiapepsin buffer and crystallization buffer, mixed 1:1).
- Store the crystals at 20 °C.
- Has the protocol produced an acceptable crystal size range and number for the intended experiment? Yes - DONE- No - return to Step 3.1. and attempt an alternative scaling option. For example, a different protein:precipitant ratio may be possible or adding seeds if this was not done previously. When these are all exhausted, it might be necessary to find a new condition at Step 1.
- Prepare seed-stock.
- Scaling in 96-well plates. From the endothiapepsin morphogram, a straight batch method using the crystallization condition 0.1 M Tris-HCl pH 7.0, 0.15 M MgCl2, and 30% (w/v) PEG 6,000, was initially selected for scaling. 100 mg/mL endothiapepsin mixed with the crystallization buffer in a 1:1 ratio.
Results
Optimizing crystal morphology
Step 1, optimizing crystal morphology, has been included to remind reader of its importance. It may be possible to create perfect micro-crystals from poorly diffraction needle-balls; however, the authors would suggest that it is better to optimize the two separately. First, find conditions that give rise to well-diffracting, single crystal via vapor diffusion, and then convert these conditions into batch rather than trying to do combine the two steps together. Discovering highly nucleating conditions, at this stage, is not necessary; morphology and diffraction quality are the principal goals.
Before beginning the micro-crystallization of endothiapepsin, an analysis of deposited structure crystallization conditions from the PDB was conducted. Crystallization conditions and approximate protocols could be obtained for 47 of the 48 depositions of enthothiapepsin. These were broadly all based upon the first crystallization of endothiapepsin conducted by Moews and Bunn (1970)46. Given the similarities of these conditions and their 'classical' origin, a 96-well, vapor diffusion, sparse-matrix screen was performed to explore a wider variety of crystallization conditions. Endothiapepsin was concentrated to 70 mg/mL and a PACT sparse-matrix screen47 was performed in a 96-well sitting-drop plate at 20 °C mixing 100 nL of protein with 100 nL of well solution. Every condition from this experiment after 36 h gave rise to crystals. However, an analysis of the crystal morphology indicated that some conditions might prove better for micro-crystallization optimization.
Figure 4A shows a drop from the PACT screen that was broadly representative of those observed in the majority of the plate. At first glance, it may be tempting to think that these crystals might be worth optimizing further for micro-crystallization. The crystals are large and there appears to be significant nucleation. However, the overall crystal morphology is not ideal. Firstly, the crystals are not observably singletons as it appears that multiple crystals are growing from single nucleation points. Secondly, the crystal size is highly asymmetric with growth principally occurring down a single axis. Such crystals are theoretically more likely to preferentially align when delivered to the X-ray beam. Both characteristics present problems during collection and processing of serial crystallographic data.
Figure 4B, however, shows endothiapepsin crystals grown in the presence of MgCl2. This morphology was consistent across all conditions that contained MgCl2 and therefore suggested that their morphology was due to MgCl2. The MgCl2 conditions produced single, more box-like crystals that represented a better target for the ultimate serial experiments.
There were four conditions within the PACT screen that contained MgCl2. To better understand the influence of all the different components of these conditions on endothiapepsin crystallization, a random optimization was performed. A screen was created containing a random combination of the buffers and precipitants at a range of concentrations and pHs. The MgCl2 concentration was also varied and then the resulting drops were arbitrarily graded from 0-5 (0 being no crystals or precipitation) in terms of their visual crystal quality and precipitation level.
Figure 5A shows a heatmap of the results from a Pearson's correlation analysis between the precipitation level and crystal quality, and the screen variables (examples of the drops from this experiment are shown in Figure 5B, C and D). The results indicated that the pH of the solution was highly correlated to the level of precipitation, with alkaline buffers resulting in more precipitation. MgCl2 concentration was slightly correlated to the level of precipitation, as was the pH and precipitant concentration to crystal quality.
Based on these results, the decision was taken to take the crystals grown in 0.1 M Tris-HCl pH 7.0, 0.15 M MgCl2, 20% (w/v) PEG 6,000 to the next step of the protocol - Transitioning to batch. The morphology of crystals was acceptable and an analysis of the X-ray diffraction and data quality metrics from these crystals suggested that there was no significant difference between the crystals grown in and out of the presence of Mg2+ (Figure 9).
Transitioning to batch
For many serial crystallography micro-crystallization optimizations, Step 2 will be the starting point. The protein of interest will have already been crystallized for cryo-crystallography and the crystallization protocol will now need transforming to create micro-crystal slurries. This protocol has only used 96-well vapor diffusion plates to perform the transformation to batch since vapor diffusion is the crystallization method used by 95% of PDB entries26. The protocol has avoided moving into microbatch34,35,37 since this transition might still incur a similar optimization. This is not to say that this protocol can only be done in vapor diffusion plates. All of the steps presented, would also work in microbatch if this was the original crystallization method.
To assess the crystallization of endothiapepsin in the chosen condition, a morphogram - or a rough phase diagram - was created. The purpose of the morphogram experiment is threefold. Firstly, an analysis of the morphogram is of great utility when assessing scaling routes in Step 3 - Scaling. Secondly, the morphogram acts as an optimization tool, helping to discover vapor diffusion conditions that give rise to crystals via batch [i.e., rapidly appearing crystals (< 24 h)]. Thirdly, if crystals have not appeared rapidly, an analysis of the seeded drops can give the crystallographer an idea of the approximate location of the current condition on the phase diagram. For example, if the seeded conditions give crystals but the unseeded do not, those conditions are likely to be in the metastable region.
The morphogram experiment of endothiapepsin was performed based on the 0.1 M Tris-HCl pH 7.0, 0.15 M MgCl2, 20% (w/v) PEG 6,000 condition. The protein and PEG concentrations were varied from 100 to 12.5 mg/mL and 5 to 40% (w/v), respectively. The drops were analyzed and results plotted using the worksheet provided (Figure 6A).
It was also already clear from the Optimizing crystal morphology stage that endothiapepsin crystal growth in this condition, and at these protein concentrations, would result in crystals grown in under 24 h. This indicated that crystallization was occurring via a batch rather than a vapor diffusion driven process. The crystal grown in these conditions were, therefore, suitable for scaling to larger volumes.
If crystals had not been visible in the unseeded-drops after 24 h, then it would have been likely that crystallization was still dependent upon a transition (Figure 1B) and, therefore, not batch. In this case, the results from the morphogram experiment are still of interest. They give an indication of the probable starting point for crystallization on the phase diagram and hence, how the subsequent optimization should proceed. Look at the seeded drops. The seeds will allow for crystal growth in the metastable region regardless of nucleation. For example, if crystals appear within 24 h in the seeded-drops but not the unseeded drops, this indicates part of the metastable region can be observed. If no crystals are observed in either the seeded or unseeded-drops, all wells remain undersaturated.
Scaling
Looking at the morphogram (Figure 6A), a number of observations could be made. The amount of nucleation did appear to be affected by both the protein and precipitant concentrations. There was also a very clear demarcation of drops that lead to protein precipitation, with drops either containing: nothing, crystals or precipitate (Figure 6B). The addition of seeds (Figure 6D) also greatly increased Xn when compared to the drops without seeds (Figure 6C).Taking all these results together, it was decided to attempt to scale both a batch and seeded-batch protocol at 30% (w/v) PEG 6,000 and 100 mg/mL endothiapepsin.
The initial test scaling was done in 24-well hanging drop plates. The drop volumes were gradually increased so that any changes in crystallization behavior could be observed (Figure 7). As can be seen, in both the unseeded and seeded drops crystal growth has occurred. All the unseeded drops grew a range of crystal sizes, but predominantly large crystals (100-200 µm - longest dimension). The seeded drops, however, produced smaller crystals (5 - 50 µm - longest dimension). These initial tests suggested that seeds would be required to decrease Xs, but also, that this condition should be suitable for larger volumes.
When the volume was increased in 200 µL, the crystallization volume was continually agitated during crystal growth. The principal reason for this agitation was to ensure that the crystallization solution remains homogenous and that growing crystals do not settle on the bottom or sides of the tubes. Settling of crystals can lead to a heterogenous crystal population with both very large and small crystals. Agitating the crystallization solution can also promote nucleation44,45.
Unfortunately, the unseeded 30% (w/v) PEG 6,000 produced no crystals, so the PEG concentration was increased to 35% (w/v). This increase improved the crystallization markedly, with a final Xn and Xs range of 3.6 ± 1.2 x 10⁶ crystals·mL-1 and 42 ± 4.1 µm, respectively (Figure 8A and B - black). Although a significant improvement and an acceptable crystal concentration, the final crystals were too large for the planned experiment, so further optimizations were undertaken. To reduce the size of the final crystals two avenues were explored (Figure 1E): decreasing the protein concentration to try and limit the final crystal growth (Figure 8A and B - hot pink), and increasing the PEG concentration to try and increase nucleation (Figure 8A and B - green).
The reduction of the protein concentration unfortunately also dramatically reduced the Xn, which ultimately produced even larger crystals. Increasing the PEG concentration to 40% yielded a final Xn and Xs range of 3.1 ± 0.7 x 10⁶ crystals·mL-1 and 39 ± 2.3 µm, respectively. These were not significantly different to the 35%, but since the final crystal size was reduced, this condition was continued with the further optimizations.
To increase the Xn, seeds were added. This dramatically increased the Xn (1.1 ± 1.8 x 10⁸ crystals·mL-1) and lead to a smaller Xs (4.2 ± 4.0 µm) (Figure 8A and B - dashed purple). These crystals, although very suitable for some serial crystallography experiments, were deemed too small so the concentration of the added seeds was changed.
This tuning of the added seed stock, however, proved difficult to reliably repeat; therefore, quenching was attempted. After the addition of a seed stock, the crystal size was monitored and once a suitable crystal size was achieved (approximately 10 - 20 µm), the batch crystallization was quenched (Figure 8C and D). Quenching was proposed, with regard to micro-crystallization, in Kupitz et al. (2014)25. Although perhaps not an ideal method, as protein solution will ultimately be wasted26, the technique was very useful in this situation as crystal growth was difficult to control. The idea behind quenching is to rapidly return the crystallization mixture to a point just above the solubility line (Figure 1F). Once the solution has returned to the solubility line, the solution has returned to a stable saturated solution and no further crystal growth will occur.
Attempting to quench a crystallization reaction is not without risk. If too great a quenching solution is added, the protein in solution might be diluted so much that the solubility line is passed. In this case, the solution will become undersaturated and the crystals will start dissolving. To prevent this, it is possible to estimate the amount of required quenching solution based on the morphogram results. At the point of quenching, take the concentration of the protein solution. By comparing the protein concentration at the solubility line and the protein concentration in solution, an estimate of the required dilution can be made.
The quenched version of the 40% (w/v) PEG 6,000, 10 x diluted seed experiment gave a final crystal concentration and size range of 2.6 ± 3.1 x 10⁶ crystals·mL-1 and 15 ± 3.9 µm, respectively.
Throughout the entire process, test X-ray data collections of the endothiapepsin crystals were collected at the Swiss Light Source PXII beamline using a 10 x 30 µm focus, an energy of 12.4 keV attenuated by 80%, and under cryo-conditions. The data were processed using dials and Figure 9 shows a comparison of CC½. No dramatic change in in CC½ was observed over the course of the optimization.
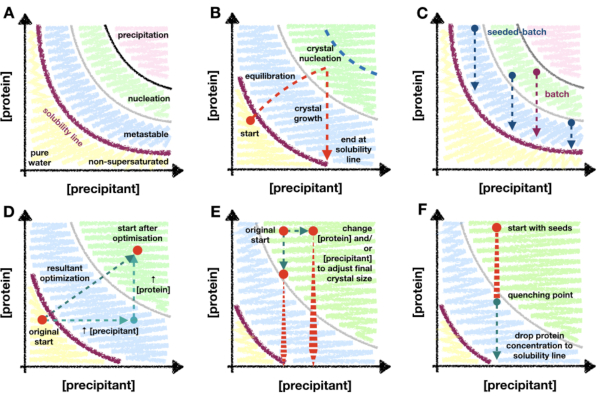
Figure 1: An overview of transitionary and batch crystallization, and scaling methods mapped onto a phase diagram. A. The zones and limits of the archetypical protein crystallization phase diagram. The precipitant and protein concentrations are plotted on the x and y axes, respectively, with the pure water point at the origin. The purple line indicates the protein supersaturation boundary, and the metastable, nucleation, and precipitation zones are shown in blue, green and pink, respectively. B. An example of the nucleation zone penetration limits of a 'transitionary phase' crystallization method, such as vapor diffusion. In this theoretical experiment, the drop precipitant and protein concentrations begin just below the solubility line - not yet supersaturated. While the drop equilibrates, the drop component concentrations increase such that the drop becomes supersaturated, and continues to move - or transition - into the nucleation zone. Upon crystal nucleation, the protein concentration in solution begins to drop. The concentration continues to fall as crystals grow until finally stopping at the solubility line. The blue dotted line marks a theoretical limit of the transition into the nucleation zone. As soon as nucleation begins, the protein concentration will drop, preventing further penetration. C. Example batch and seeded-batch crystallization trajectories. In batch, the mixing of the protein and precipitant must create a supersaturated solution within the nucleation zone so that crystal growth can occur. In seeded-batch, it is not strictly necessary to be in the nucleation zone due to the addition of micro-seeds, so locations in the metastable region can also be explored. D. A hypothetical optimization of the crystallization experiment shown in B from vapor diffusion to batch. The original vapor diffusion starting point has transitioned, via the resultant optimization vector, to the new start position; inside the nucleation zone. The resultant vector is the product of two optimizations: an increase in both protein and precipitant concentrations. E. Example optimizations when scaling batch conditions to tailor the final Xn and Xs. F. Quenching the crystallization experiment by the addition of crystallization buffer. It is essential that the quenching does not take the protein concentration out of the metastable region and, therefore, below the point of protein supersaturation. Otherwise, crystals will start to dissolve back into solution. B. and C. have been adapted from Beale et al. (2019)26 with the permission of the authors. Please click here to view a larger version of this figure.
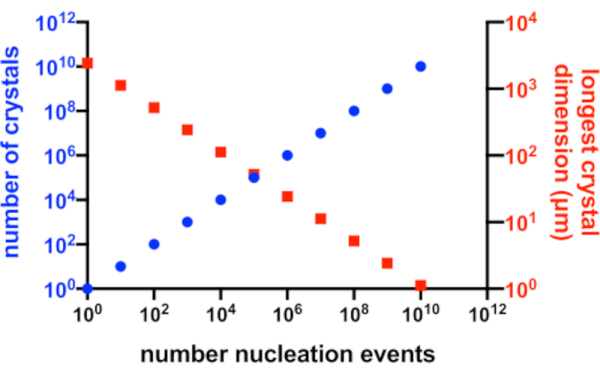
Figure 2: Increasing Xn and decreasing Xs. The idealized relationship between the number of crystals produced from a crystallization experiment and their mean longest dimension. To create this graph, the crystallization of a hypothetical 10 kDa model protein was used. The protein crystallized at a concentration of 10 mg/mL and yielded P212121 crystals with dimensions of 49x50x51 Å. Every nucleation event was assumed to yield a crystal. Crystal growth was assumed to be homogeneous from every face. Please click here to view a larger version of this figure.
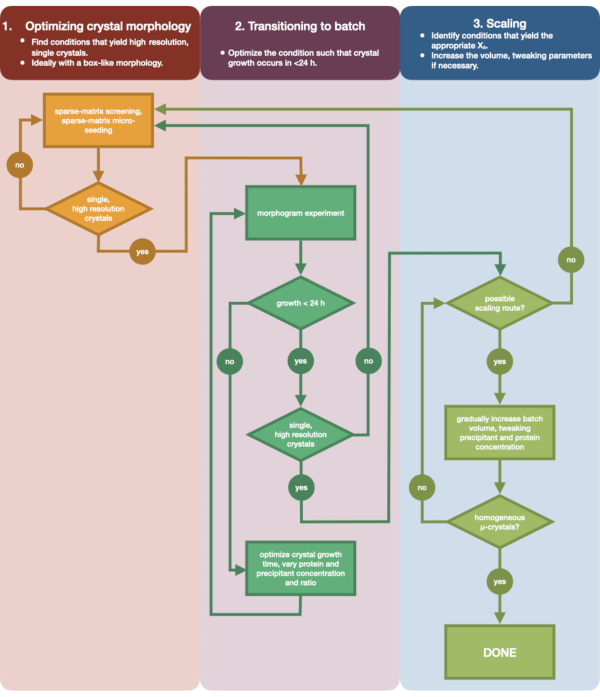
Figure 3: A flow-chart showing the steps to optimize a crystal grown in a small-volume (<500 nL), vapor diffusion experiment into a large-volume (> 100 µL) batch experiment. Crystal optimization is divided into three stages: (1) Optimizing crystal morphology. (2) Transitioning to batch. (3) Scaling. In Stage 1 it is important to identify suitable crystals for micro-crystallization. Some proteins only present in a single crystal morphology regardless of the crystallization condition. However, it is worth looking for conditions that give rise to single, cube-like crystals, or as close to these as humanly possible. Single, cube-like crystals, hypothetically and anecdotally, will generally give rise to better outcomes from serial crystallography experiments. Once a crystal morphology has been selected and the diffraction confirmed, it is then necessary to move the crystallization experiment from vapor diffusion to batch (Stage 2). Here, crystals should be optimized by their nucleation time. The goal is to find conditions that yield rapidly appearing crystals (> 24 h) as these conditions are likely to hit the nucleation zone immediately, and are therefore batch. Once a condition in the nucleation zone has been found, a morphogram can be created. The morphogram allows for the majority of the nucleation zone to mapped and potential scaling routes identified for Stage 3. The volume of an identified batch condition can then be either gradually or rapidly scaled in size to yield a final volume of >100 µL. Please click here to view a larger version of this figure.
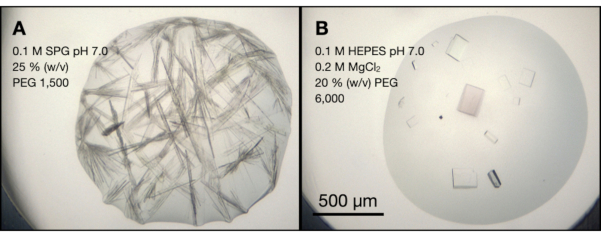
Figure 4: An analysis of endothiapepsin crystallization conditions from a PACT sparse-matrix screen. A. and B. are photos after 24 h of wells A4 and C10, respectively from the PACT screen. The crystallization buffer components are highlighted on the figure. The SPG buffer is succinic acid, sodium dihydrogen phosphate, and glycine mixed in a 2:7:7 molar ratio. Please click here to view a larger version of this figure.
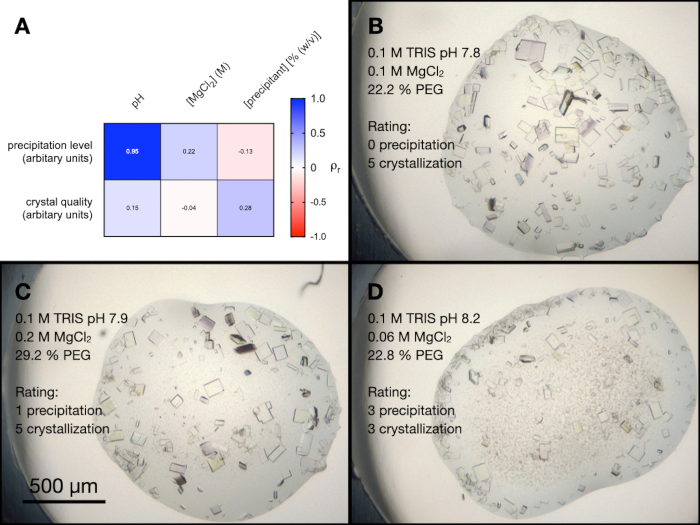
Figure 5: An analysis of the endothiapepsin crystallization optimization from the PACT MgCl2 conditions. A. A heat map of the results from a Pearson's correlation analysis between buffer pH, MgCl2 concentration, and precipitant concentration and the precipitation level and crystal quality. The precipitation level and crystal quality were both assessed arbitrarily on a scale of 0-5 (with 0 being no crystals or precipitation) after 24 h. B. C. and D. show examples of the crystallization and precipitation in three different drops. The crystallization condition and assessments of the precipitation level and crystal quality are also shown. Please click here to view a larger version of this figure.
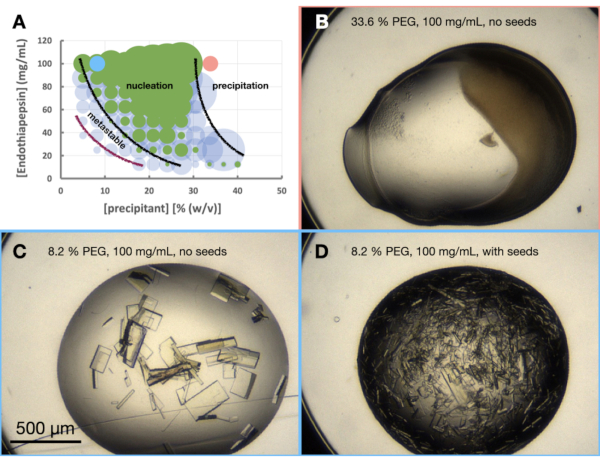
Figure 6: An endothiapepsin morphogram when crystallized in 0.1 M Tris-HCl pH 7.0, 0.15 M MgCl2 and PEG 6,000. A. A morphogram created from the "phase-diagram-generator" spreadsheet provided. The relative number of crystals in each drop is denoted by the size of the circles, and the results from drop 1 (protein and precipitant) and drop 2 (protein, precipitant and seeds) are highlighted in green and blue, respectively. The values of the protein and precipitant concentrations, on the x and y axis, respectively, denote pre-mixed values of each rather than final volumes. Based on the results, black lines and a purple line have been drawn to show the boundaries of the nucleation zone and metastable zone, respectively. B. C. and D. show some example results from the experiment. The red and blue dots marked on A. indicate the locations of B., and C. and D., respectively. Please click here to view a larger version of this figure.
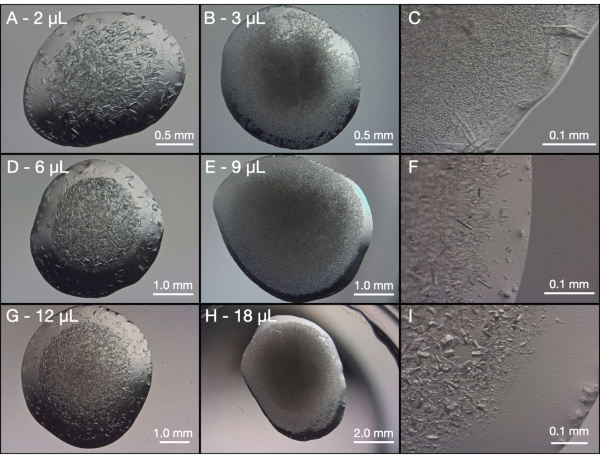
Figure 7: Initial scaling trials of endothiapepsin in 24-well hanging drop plates. The same protein and precipitant concentrations were used for all trails: 100 mg/mL endothiapepsin in 0.1 M Na Acetate pH 4.6 and 0.1 M Tris-HCl pH 7.0, 0.15 M MgCl2, and 30% (w/v) PEG 6,000, respectively. All of the displayed images were taken after 24 h and the final drop volumes are labelled on each image. The left panel (A, D, and G) are a 1:1 mix of protein and precipitant, the middle panel (B, E, and H) are a 1:2:3 mix of seeds, precipitant, and protein and the right panel (C, F, and I) are magnified images of the middle panel. Please click here to view a larger version of this figure.
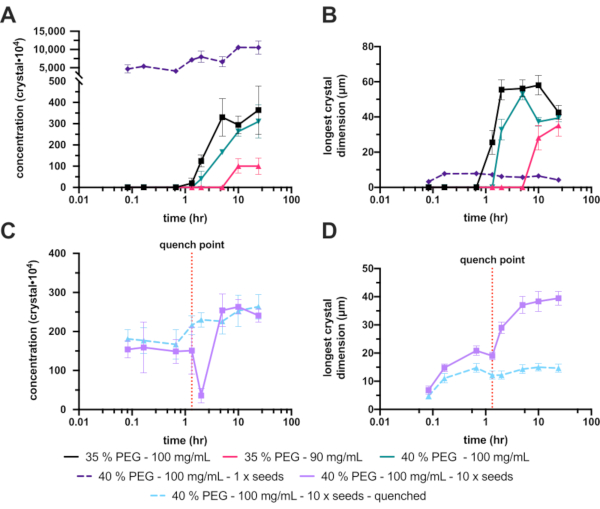
Figure 8: Analysis of the endothiapepsin micro-crystallization in 200-300 µL volumes. A. and C. show how Xn changed over the experiment time. B. and D. show how Xs (longest dimension) changed over time. The results of the experiments have been separated for clarity. The red dotted line on C. and D. show the point at which quenching was performed. Please click here to view a larger version of this figure.
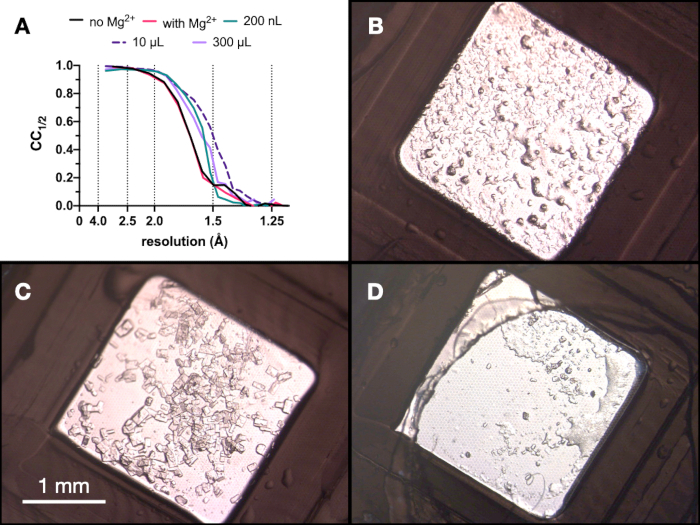
Figure 9: CC½ results and images of crystals obtained at each stage of the micro-crystallization process to assess diffraction quality. A. CC½ plotted against resolution from data collected from crystals grown: with and without Mg - part of the Stage 1 optimization, in a 200 nL volume, a 10 µL volume and the final 300 µL volume. B.C. and D. show the crystals from the 200 nL, 10 µL and 300 µL volume, respectively. Please click here to view a larger version of this figure.
| Protein Information | |
| Protein | Endothiapepsin |
| Molecular Weight (kDa) | 33.8 |
| Spacegroup | P1211 |
| a, b, c (Å) | 45.2, 73.3, 52.7 |
| α, β, ɣ (°) | 90.0, 109.2, 90.0 |
| Fixed-target parameters | |
| Volume loaded per chip (µL) | 150 |
| Aperatures per chip | 25,600 |
| Required crystal concentration (crystals/mL) | 500,000 |
| Sample Information | |
| Protein mass used to make 200 µL of sample (mg) | 10 |
| Crystal longest dimension (µm) | 15 |
| Crystal concentration (crystals/mL) | 2,500,000 |
| Experimental Variables | |
| Number of time points required | 5 |
| Number of images required per time point | 50,000 |
| Hit rate (integrated patterns/images collected) | 0.3 |
| Fixed-targets required per time point (rounded up) | 7 |
| Sample requirements | |
| Sample volume required per time point (µL) | 1,050 |
| Total sample volume required for experiment (mL) | 5.25 |
| Total mass of protein required (mg) | 52.5 |
Table 1: An example of the sample requirements for a hypothetical optical pump-probe experiment performed using fixed-targets. The protein used in this theoretical experiment was endothiapepsin. The fixed-target parameters were based on experiments reported in Ebrahim et al. (2019)48 and Davy et al. (2019)49. The sample information came from the protocol reported in this video article and the experimental variables were conservative estimates based on lived experience. The following sample requirements were subsequently calculated given the previous assumptions.
Discussion
The method presented shows how to optimize the crystallization of endothiapepsin from large crystals (≥ 100 µm longest dimension), grown in sparse-matrix 96-well screens, to micro-crystals, grown in centrifuge tubes (300 µL volume) via batch. The idea behind the protocol is that the steps taken to optimize endothiapepsin could also be used for other proteins. Ultimately, answering the problem of creating large volumes (>100 µL) of micro-crystals (10-20 µm) for serial crystallography experiments at XFELs and synchrotrons.
The protocol divides the task of large volume micro-crystallization into three steps: (1) Optimizing crystal morphology, (2) Transitioning to batch, and (3) Scaling. In Step 1, the range of crystal forms that a protein can create should be explored in vapor diffusion plates. Conditions that give rise to single, box-like crystals that diffract to the required resolution should be the goal. In Step 2, selected conditions can then be transformed from vapor diffusion into batch. Here, the optimization criterion is crystal growth time and to find conditions that give rise to protein crystals within 24 h. A morphogram can also be plotted giving the experimenter an idea of the location of the solubility line and nucleation zone boundaries. This morphogram is of great utility in Step 3, Scaling. The morphogram will give an indication of the whether nucleation alone can increase Xn and drive down Xs. As the volume of the experiment is increased, Xn and Xs can be continually assessed as the key criteria of scaling success.
In the case of Endothiapepsin, Step 1 unearthed what potentially was a previously unknown crystal morphology for endothiapepsin. This morphology had the same spacegroup as those previously reported but, importantly for serial crystallography, a more box-like shape. Single crystals also seemed to grow from single nucleation points, unlike the fans created from other conditions (Figure 4). For the selected condition, Step 2 was already partially satisfied as crystal growth occurred in < 24 h. The morphogram indicated that both a straight or seeded-batch protocol might be successful when scaling in Step 3. Initial scaling in straight batch, created a condition that produced crystals with an Xn and Xs range of 3.6 ± 1.2 x 10⁶ crystals·mL-1 and 42 ± 4.1 µm, respectively. These crystals, although acceptable for some serial crystallography experiments, were deemed too large. So additional optimizations were performed. The final protocol produced crystals with a concentration and size range of 3.1 x 10⁶ crystals·mL-1 and 15 ± 3.9 µm, respectively. This was more than ideal for the planned experiments.
The method focuses on the transformation of 'soluble' protein crystals grown in vapor diffusion plates to batch. The reason for this focus is that the vast majority of soluble protein crystals are grown via vapor diffusion26. However, the concepts presented could also be applied to soluble protein crystals grown using other methods, such as micro-batch. The concepts may also be applicable to membrane protein crystals grown in LCP; as this too is a batch crystallization process.
A key aspect of the protocol is the process of transforming the conditions of crystals grown in vapor diffusion plates such that they can be grown in batch. For this transformation, the method uses the criterion proposed by Beale et al. (2019)26. Crystals grown via a batch process, even in vapor diffusion plates, will form rapidly (< 24 h). This criterion is an approximation based on the speed of vapor diffusion drop equilibration, and is most true for PEG-based precipitant conditions. However, crystallization conditions will contain a wide variety of compounds that will influence the equilibration time. The equilibration of salt-based crystallization conditions, e.g. highly concentrated ammonium chloride, can happen in 1-2 days. Therefore, the 24 h criterion may not be true for salt-based conditions. Salt-based conditions also can have more complex phase diagrams26, 30 that may not conform to the archetype presented in this protocol. A reduction in the time criterion for salt-based conditions to 12 or 6 h may be necessary if scaling into larger volumes proves impossible.
Another limitation of this method is its apparent complexity. The protocol that was followed to optimize the micro-crystallization of endothiapepsin actually changed the original condition from the sparse-matrix screen relatively little. The first hit observed in the PACT screen was 0.1 HEPES pH 7.0, 0.2 M MgCl2, and 20% (w/v) PEG 6,000. The final scaled crystallization buffer was 0.1 Tris-HCl pH 7.0, 0.15 M MgCl2, and 40% (w/v) PEG 6,000. It is also very possible that the change in buffer from HEPES to Tris-HCl, and MgCl2 concentration, contributed little to the success of the process. Leaving the increase in PEG 6,000 concentration the sole optimization, and one that could have been achieved quite simply.
This assessment, however, is also too simplistic. It not only discounts the problems encountered during scaling (i.e., the use of seeds and quenching), but also the fact that just because this protein proved straightforward, there is no guarantee the next will also prove to be. The steps advised in the protocol, were devised because optimizing the scaling of protein crystallization volumes can be very protein expensive. Over the seven endothiapepsin scaling trials that are shown, 100 mg of protein were consumed. Admittedly some of these steps were performed to show their consequences in the light of this protocol. Even so, 100 mg of a protein, plus potentially a further 50 mg for protein consumed during an experiment (Table 1), can be a significant investment in either time or money.
Fortunately, it is not clear that this mass of required sample is ubiquitous across all proteins. Endothiapepsin was highly soluble, and therefore required a large protein concentration to reach supersaturation. In others (currently under optimization), supersaturation can be reached at 10 or even 5 mg/mL. Such variables are protein specific and need to be embraced when they appear.
Other limitations of the method include its reliance on complex equipment such as liquid handling robots for screen and plate creation, and imagers to automatically image plates when required. Alternative routines have been offered to limit the need of some of these pieces of equipment, but the protocol will be more time consuming to follow without them. The protocol also suggests testing the diffraction of optimized crystals. For crystallographers without regular access to a synchrotron, these tests could prove challenging. Controls at every step may not be necessary, but these tests are strongly recommended once a hit has been identified, and pre-and post-scaling. Non-diffracting crystals at an XFEL are, unfortunately, not an uncommon occurrence. Given this, it is better to err on the side of caution regarding assumptions about crystal diffraction.
Ultimately, this protocol and results presented here will offer a guide, ideas, and an example to those struggling with producing samples for serial crystallography experiments. Hopefully, as serial crystallography is further developed, the sample demands of the technique will be reduced such that the need for protocols like this will be reduced. However, even in this event, the strategies presented here will still be useful to those wishing to explore the crystallization space of their protein.
Disclosures
The authors have no conflicts of interest to disclose.
Acknowledgements
This project has received funding from the European Union's Horizon 2020 research and innovation program under the Marie Skłodowska-Curie grant agreement No 701647. Many thanks for the assistance and support of beamline scientists at the Swiss Light Source beamline X10SA-PXII.
Materials
| Name | Company | Catalog Number | Comments |
|---|---|---|---|
| Swissci 96-well 2-Drop plates | Molecular Dimensions | MD11-002 | 96-well 2-drop crystallisation plate |
| Swissci 96-well 3-Drop plates | Molecular Dimensions | MD11-003 | 96-well 3-drop crystallisation plate |
| mosquito LCP liquid handling robot | sptlabtech | mosquito LCP | Crystallisation robot |
| ClearVue Sheets | Molecular Dimensions | MD6-015 | 96-well crystallization plate seals |
| Safe-Tube 1.5 mL | Eppendorf | 30120086 | 1.5 mL centrifuge tubes |
| Scaple | Swan and Morton | No. 3 scalple and No. 3 handle | Scalple for cutting open plate seals |
| MS 3 Vortex | IKA | 3319000 | Vortex for mixing solution and making seed stocks |
| 24-well XRL Plate | Molecular Dimensions | MD3-11 | 24-well hanging-drop plates |
| Tube revolver/rotator | Thermo Fischer Scientific | 88881001 | Tube revolver for mixing solution during scaling |
| Eppendorf Research plus pipettes | Eppendorf | Range of manual pipettes, 0.5-10, 1-20, 10-100, 100-1000 µL | |
| Eppendorf pipette tips | Eppendorf | Range of tip sizes for manual pipettes | |
| Suparen 600 | Prochem AG | Suparen 600 | Endothiapepsin solution |
| Sodium Acetate | Sigma-Aldrich | 241245-1KG | Sodium Acetate |
| Tris | Merck | 8382T014 | Tris |
| Magnesium Chloride | Sigma-Aldrich | M2670-1kg | Magnesium Chloride |
| PEG 6,000 | Sigma-Aldrich | 81255-1kg | PEG 6,000 |
| Ethelyene glycol | Sigma-Aldrich | 324558-1L | Ethelyene glycol for cyro-protecting the crystals |
| PACT Premier HT screen | Molecular Dimensions | MD1-36 | PACT Premier 96-well crystal screen |
| DOW CORNING high vacuum grease | Molecular Dimensions | MD6-02 | Grease for sealing 24-well plates |
| Hirschmann 22 x 22 mm glaser cover slides | Hirschmann | 8000104 | Cover slides for sealing 24-well sitting drop plates |
| Crystal pins | PSI | Manufactured inhouse | Thin-film supports for micro-crystals. |
| 1-1.3 mm SiLibeads Type S | Faust | 6239547 | Glass beads for making mico-seed stocks |
| Macbook Pro | Apple | Macbook Pro | Computer for performing data analysis |
| CCP4 software suite | CCP4 | Diffraction pattern data processing software | |
| Excel | Microsoft | Microsoft Office | Plotting tool for phase diagram |
| Hausser Scientific Bright-Line counting chamber | Thermo Fischer Scientific | 02-671-51B | Tool to calculate crystal concentration |
| PACT Premier | Molecular Dimensions | MD1-29-ECO | Sparse-matrix crystallization screen |
| Rock Imager | Formulatrix | Rock Imager | Temperature controlled crystal plate storage and imager |
| Rock MakerWeb | Formulatrix | Rock MakerWeb | Crystal plate creation and image storage stoftware |
| Formulator | Formulatrix | Formulator | 96-well crystal screen creation liquid handling robot |
| Leica MZ16 Microscope | Leica | Leica MZ16 | Light microscope |
| LAS V4.6 | Leica | LAS V4.6 | Software for Leica microscopes |
| Spectra/Por 3.5 kDa dialysis tubing | Spectrumlabs | Spectra/Por 3 Dialysis Membrane | 3.5 kDa dialysis membrane |
| Dialysis tubing closures | Spectrumlabs | Spectra/Por 3 Duniversal Closures | Clips to seal the dialysis tubing ends |
| Amicon 10 kDa centrifugal concentrator | Merck-Millipore | Amicon Ultra-15 10 kDa centrifugal concentrator | 10 kDa centrifugal filter |
| 5810 R swing bucket centrifuge | Eppendorf | 5810 R Centrifuge | Swing bucket centrifuge |
References
- DePonte, D. P., et al. Gas dynamic virtual nozzle for generation of microscopic droplet streams. Journal of Physics D: Applied Physics. 41 (19), 195505(2008).
- Hunter, M. S., et al. Fixed-target protein serial microcrystallography with an x-ray free electron laser. Scientific Reports. 4 (1), 6026(2014).
- Weierstall, U., et al. Lipidic cubic phase injector facilitates membrane protein serial femtosecond crystallography. Nature Communications. 5 (1), 1-6 (2014).
- Roessler, C. G. G., et al. Acoustic Injectors for Drop-On-Demand Serial Femtosecond Crystallography. Structure. 24 (4), 631-640 (2016).
- Sherrell, D. A., et al. A modular and compact portable mini-endstation for high-precision, high-speed fixed target serial crystallography at FEL and synchrotron sources. Journal of Synchrotron Radiation. 22 (6), 1372-1378 (2015).
- Roedig, P., et al. A micro-patterned silicon chip as sample holder for macromolecular crystallography experiments with minimal background scattering. Scientific Reports. 5 (1), 1-11 (2015).
- Botha, S., et al. Room-temperature serial crystallography at synchrotron X-ray sources using slowly flowing free-standing high-viscosity microstreams. Acta Crystallographica Section D Biological Crystallography. 71 (2), 387-397 (2015).
- Weinert, T., et al. Serial millisecond crystallography for routine room-temperature structure determination at synchrotrons. Nature Communications. 8 (1), 542(2017).
- Tenboer, J., et al. Time-resolved serial crystallography captures high-resolution intermediates of photoactive yellow protein. Science. 346 (6214), 1242-1246 (2014).
- Nango, E., et al. A three-dimensionalmovie of structural changes in bacteriorhodopsin. Science. 354 (6319), 1552-1557 (2016).
- Suga, M., et al. Light-induced structural changes and the site of O=O bond formation in PSII caught by XFEL. Nature. 543 (7643), 131-135 (2017).
- Mehrabi, P., et al. Liquid application method for time-resolved analyses by serial synchrotron crystallography. Nature Methods. 16 (10), 979-982 (2019).
- Halle, B. Biomolecular cryocrystallography: structural changes during flash-cooling. Proceedings of the National Academy of Sciences of the United States of America. 101 (14), 4793-4798 (2004).
- Fraser, J. S., et al. Hidden alternative structures of proline isomerase essential for catalysis. Nature. 462 (7273), 669-673 (2009).
- Fenwick, R. B., van den Bedem, H., Fraser, J. S., Wright, P. E. Integrated description of protein dynamics from room-temperature X-ray crystallography and NMR. Proceedings of the National Academy of Sciences of the United States of America. 111 (4), 445-454 (2014).
- Keedy, D. A., et al. Mapping the conformational landscape of a dynamic enzyme by multitemperature and XFEL crystallography. Elife. 4, (2015).
- Thomaston, J. L., et al. XFEL structures of the influenza M2 proton channel: Room temperature water networks and insights into proton conduction. Proceedings of the National Academy of Sciences of the United States of America. 114 (51), 13357-13362 (2017).
- Haas, D. J., Rossmann, M. G. Crystallographic studies on lactate dehydrogenase at -75 °C. Acta Crystallographica Section B Structural Crystallography and Crystal Chemistry. 26 (7), 998-1004 (1970).
- Hope, H. Cryocrystallography of biological macromolecules: a generally applicable method. Acta Crystallographica Section B Structural Science. 44 (1), 22-26 (1988).
- Wu, W., et al. Batch crystallization of rhodopsin for structural dynamics using an X-ray free-electron laser. Acta Crystallographica Section:F Structural Biology Communications. 71 (7), 856-860 (2015).
- Ishchenko, A., Cherezov, V., Liu, W. Preparation and delivery of protein microcrystals in lipidic cubic phase for serial femtosecond crystallography. Journal of Visualized Experiments. (115), e54463(2016).
- Andersson, R., et al. Well-based crystallization of lipidic cubic phase microcrystals for serial X-ray crystallography experiments. Acta Crystallographica Section D: Structural Biology. 75 (10), 937-946 (2019).
- Luft, J. R., et al. The detection and subsequent volume optimization of biological nanocrystals. Structural Dynamics. 2 (4), 041710(2015).
- Lee, D. B., et al. Supersaturation-controlled microcrystallization and visualization analysis for serial femtosecond crystallography. Scientific Reports. 8 (1), 1-10 (2018).
- Kupitz, C., et al. Microcrystallization techniques for serial femtosecond crystallography using photosystem II from Thermosynechococcus elongatus as a model system. Philosophical transactions of the Royal Society of London. Series B, Biological Sciences. 369 (1647), 20130316(2014).
- Beale, J. H., et al. Successful sample preparation for serial crystallography experiments. Journal of Applied Crystallography. 52, Pt 6 1385-1396 (2019).
- Rayment, I. Small-scale batch crystallization of proteins revisited: An underutilized way to grow large protein crystals. Structure. 10 (2), 147-151 (2002).
- García-Ruiz, J. M. Nucleation of protein crystals. Journal of Structural Biology. 142 (1), 22-31 (2003).
- McPherson, A., Kuznetsov, Y. G. Mechanisms, kinetics, impurities and defects: Consequences in macromolecular crystallization. Acta Crystallographica Section F:Structural Biology Communications. 70 (4), 384-403 (2014).
- Rupp, B. Origin and use of crystallization phase diagrams. Acta crystallographica. Section F, Structural biology communications. 71, Pt 3 247-260 (2015).
- Luft, J. R., DeTitta, G. T. A method to produce microseed stock for use in the crystallization of biological macromolecules. Acta Crystallographica Section D Biological Crystallography. 55 (5), 988-993 (1999).
- Ireton, G. C., Stoddard, B. L. Microseed matrix screening to improve crystals of yeast cytosine deaminase. Acta crystallographica. Section D, Biological crystallography. 60 (3), 601-605 (2004).
- Forsythe, E. L., Maxwell, D. L., Pusey, M. Vapor diffusion, nucleation rates and the reservoir to crystallization volume ratio. Acta Crystallographica Section D Biological Crystallography. 58 (10), 1601-1605 (2002).
- Chayen, N. E., Shaw Stewart, P. D., Maeder, D. L., Blow, D. M. IUCr An automated system for micro-batch protein crystallization and screening. Journal of Applied Crystallography. 23 (4), 297-302 (1990).
- Chayen, N. E., Shaw Stewart, P. D., Blow, D. M. Microbatch crystallization under oil - a new technique allowing many small-volume crystallization trials. Journal of Crystal Growth. 122 (1-4), 176-180 (1992).
- Chayen, N. E. Comparative studies of protein crystallization by vapour-diffusion and microbatch techniques. Acta Crystallographica Section D: Biological Crystallography. 54 (1), 8-15 (1998).
- D'Arcy, A., Mac Sweeney, A., Stihle, M., Haber, A. The advantages of using a modified microbatch method for rapid screening of protein crystallization conditions. Acta Crystallographica - Section D Biological Crystallography. 59 (2), 396-399 (2003).
- Darmanin, C., et al. Protein crystal screening and characterization for serial femtosecond nanocrystallography. Scientific Reports. 6, 25345(2016).
- Gati, C., et al. Atomic structure of granulin determined from native nanocrystalline granulovirus using an X-ray free-electron laser. Proceedings of the National Academy of Sciences of the United States of America. 114 (9), 2247-2252 (2017).
- Cheng, R. K. Y. Towards an optimal sample delivery method for serial crystallography at XFEL. Crystals. 10 (3), 215(2020).
- Schmidt, M. Mix and Inject: Reaction Initiation by Diffusion for Time-Resolved Macromolecular Crystallography. Advances in Condensed Matter Physics. 2013, 1-10 (2013).
- Oberthuer, D., et al. Double-flow focused liquid injector for efficient serial femtosecond crystallography. Scientific Reports. 7 (1), 44628(2017).
- McPherson, A., Gavira, J. A. Introduction to protein crystallization. Acta crystallographica. Section F, Structural biology communications. 70, Pt 1 2-20 (2014).
- Yaoi, M., et al. Effect of stirring method on protein crystallization. Japanese Journal of Applied Physics, Part 2: Letters. 43 (10), 1318(2004).
- Castro, F., Ferreira, A., Teixeira, J. J., Rocha, F. Influence of Mixing Intensity on Lysozyme Crystallization in a Meso Oscillatory Flow Reactor. Crystal Growth & Design. 18 (10), 5940-5946 (2018).
- Moews, P. C., Bunn, C. W. An X-ray crystallographic study of the rennin-like enzyme of Endothia parasitica. Journal of Molecular Biology. 54 (2), 395-397 (1970).
- Newman, J., et al. Towards rationalization of crystallization screening for small- to medium-sized academic laboratories: the PACT/JCSG+ strategy. Acta crystallographica. Section D, Biological. 61, Pt 10 1426-1431 (2005).
- Ebrahim, A., et al. Resolving polymorphs and radiation-driven effects in microcrystals using fixed-target serial synchrotron crystallography. Acta Crystallographica Section D Structural Biology. 75, Pt 2 151-159 (2019).
- Davy, B., et al. Reducing sample consumption for serial crystallography using acoustic drop ejection. Journal of Synchrotron Radiation. 26 (5), (2019).
Reprints and Permissions
