This study aims to show that the Progressive-Ratio Computer-assisted Alcohol-Infusion System (CAIS) paradigm is a reliable and sensitive method that can be used to examine the motivating properties associated with alcohol self-administration in humans.
Method Article
The Motivation for Alcohol Reward: Predictors of Progressive-Ratio Intravenous Alcohol Self-Administration in Humans
In This Article
Summary
Abstract
The Progressive Ratio (PR) self-administration paradigm is a common pre-clinical method used to examine the motivation for a drug attributed to a craving, reward, or the relief of negative affect. The Computer-assisted Alcohol Infusion System (CAIS) enables intravenous alcohol self-administration behavior in humans. This system provides the investigator with control over the trajectory of each incremental breath alcohol concentration (BrAC) reward and the maximum BrAC allowed in a session. This paradigm allows participants to earn these alcohol rewards using a sequence of button presses specified by the investigator. The system employs a physiologically-based pharmacokinetic model-based algorithm to achieve the same incremental BrAC exposure in every participant. Participants (n = 11) took part in two identical sessions to examine test-retest reliability, and an additional group (n = 73) completed a single session. Sessions began with a 25 min priming phase: participants were instructed to press a button an increasing number of times per reward, accumulating four standardized incremental BrAC trajectories. The second phase comprised an ad-lib, PR paradigm lasting 125 min. Each reward required an increasing number of button presses. Measures of self-administration included: average and peak BrAC, total rewards earned, total grams of ethanol consumed per unit of total body water, the total number of button presses, and the average rate of button pressing. Self-administration measures were highly correlated both between and within sessions, demonstrating test-retest reliability and internal consistency. Recent drinking history was strongly associated with self-administration measures; heavier drinkers chose greater alcohol self-administration. These results indicate the reliability and sensitivity of this progressive-ratio intravenous alcohol self-administration method for assessing the motivational properties of alcohol, with the potential for improved testing of the efficacy of new medications thought to reduce consumption of alcohol. This method can be used to understand the genetic and environmental determinants of alcohol self-administration in humans.
Introduction
The addictive properties of drugs can be evaluated using self-administration paradigms. Self-administration paradigms have been used to study the development of alcohol dependence in animal models1,2,3, as well as the effectiveness of medications used to treat alcohol dependence by reducing drinking in individuals4,5,6. In order to assess the motivational properties of alcohol, a progressive ratio (PR) schedule paradigm was developed using intravenous alcohol. PR schedules require a pre-defined, increasing amount of work to obtain the next reward. The last completed level of work to obtain a reward (total rewards earned) is called the breaking point (BP). Thus, BP is a measure of the motivation for that reinforcer.
Pre-clinical investigations have used the PR schedule paradigm to assess a variety of factors involved in the motivation to work for ethanol, such as sigma receptors7,8, glucocorticoid receptor9, genetic determinants10, as well as screening for molecular targets for medication development11. Human studies have been less extensive in their use of the PR paradigm to characterize the motivation for seeking alcohol, although it has been used to study other drugs of abuse such as heroin and cocaine12,13.
Human alcohol studies employing a PR schedule have mostly used oral alcohol self-administration methods, examining the effect of naltrexone14, as well as the role of dopamine15 and nicotine16 in alcohol self-administration. In these studies, alcohol is typically administrated by ingestion of a mixture of alcohol at various concentrations in a variety of vehicles and is often conducted in a 'laboratory bar setting'. They offer either "standardized drinks" that contain fixed amounts of alcohol per drink or body weight-adjusted amounts of alcohol per drink4,5,6,17,18, generally setting a maximal exposure. The ingestion PR paradigms encounter several difficulties related to dosing. Substantial variability in the absorption and lesser amounts in the distribution and metabolism of alcohol across participants means that the incremental BrAC trajectory following consumption of each reward cannot be controlled or standardized. The amount of alcohol provided must be limited so that the cumulative BrAC of the fastest absorber does not exceed safe limits19. The motivation to seek alcohol is also subject to variation in the participants' expectations and experience regarding the beverage characteristics employed.
An alternative approach includes the intravenous (IV) administration of alcohol. The intravenous alcohol self-administration system method described here uses a physiologically-based pharmacokinetic (PBPK) model to continuously compute the precise rates of infusion required to produce a specified BrAC. The PBPK model's parameters are individualized, based on known values of age, sex, height, and weight. Compensation for individual differences in the pharmacokinetics of alcohol, and avoidance of the variability in absorption, enables the direct control of incremental exposure to alcohol rather secondarily through its dosing. This real-time adjustment provides the experimenter with control over the time course of a person's incremental BrAC to any desired rate, level, and duration of exposure20,21. The incremental exposures are the same for every participant, yielding a paradigm in which variation in the overall trajectory reflects variation in the participant's motivation rather than pharmacokinetic variations. Since this intravenous alcohol self-administration system computes the future time course of BrAC in real-time, initiation of a reward that would exceed a preset safety limit can be precluded22. Thus, every participant enjoys safe access to the entire range of exposure designed into the experiment. With IV administration, the participant also has no experience on which to base expectations of the consequence of drinking other than the effect of alcohol.
Prior intravenous alcohol self-administration studies using a free-access paradigm demonstrated high variability between individuals in self-administration behavior23 and high test-retest reliability in repeated sessions in healthy non-dependent drinkers24. Intravenous alcohol self-administration was used in a pilot study that employed an attentional task as the form of work required. The study concluded that the paradigm is effective for detecting an interaction between genotype and lorazepam treatment in the motivation for seeking alcohol25. Subsequent work identified sex differences in response to abstinence26. This model has shown to be a human translational parallel model for pre-clinical "wanting" behaviors27. Another study using this system demonstrated that those induced in a negative mood condition who exhibited greater negative urgency scores had a higher breakpoint and higher cumulative work with gender-specific effects28,29.
In the current study, BrAC rewards were delivered by infusing a 6% V/V ethanol solution through a vein in the ante-cubital fossa of the elbow30. Work was defined by the number of button presses necessary to receive an incremental increase in BrAC. The number of button presses increased for each subsequent reward. By the time the participant was working for their 10th reward, s/he was required to press the button 1,600 times, and for the 15th, almost 10,000 times. Each reward comprised a 7.5 mg/dL increase over the current BrAC, ascending at the rate of 3.0 mg/dL per minute for 2.5 min, then descending at the rate of -1.0 mg/dL per minute until the next reward was initiated. The first 25 min comprised four priming exposures prompted 2.5 min apart, i.e., receiving all four priming exposures within the first 10 min, resulting in a peak BrAC close to 30 mg/dL. This procedure allowed the participant to experience an alcohol reward as well as practice using the button. Then the participant rested for 15 min. Following this 25 min priming interval, an ad-lib PR period lasting 2 h began. Measures of self-administration included: average and peak BrAC, total rewards earned, total grams of EtOH consumed per unit of total body water, the total number of button presses, and the average rate of button pressing.
To date, there have been a small number of studies on PR schedules with alcohol in humans and fewer using IV alcohol. Therefore, the study aimed to develop a model with a PR schedule using a computer-assisted self-administration system that humans would respond to. The second aim was to evaluate the test-retest reliability of PR alcohol measures such as BrAC exposure resulting from alcohol self-administration behavior and response in non-dependent healthy participants. The third aim was to examine the influence of recent drinking history and sex on this alcohol self-administration behavior. Because the incremental BrAC exposure was the same across participants, the influence of these factors could be assessed, as well as individual responses to alcohol. Other factors of interest were personality and expectancy measures.
By demonstrating the repeatability of the individual's response to the PR schedule and its sensitivity to various determinants (such as recent drinking history), this paradigm can be qualified to evaluate the efficacy of medications on motivation for alcohol use disorder, as well as the role of genetics in alcohol use disorder. This laboratory approach would improve the understanding of both genetic and environmental determinants of alcohol self-administration behavior and motivation to consume alcohol.
Protocol
This protocol follows the guidelines of the National Institutes of Health's human research ethics committee.
1. Initial nursing measures and set-up
- Perform a breathalyzer test to ensure a zero BrAC.
- Take vitals of interest such as temperature, respiration rate, blood pressure, and heart rate. Confirm age and sex. Take height (cm) and weight (kg).
- Collect a urine sample for a urine drug screen for all participants. Run a urine beta-hCG pregnancy test for females. Ensure both are negative to continue the study.
- Provide participants with a standardized 350 kcal metabolic meal.
- Complete a brief medical history to determine any recent hospital visits, illnesses, new medications since their screening visit for any changes that may significantly impact their safety during the study and quality of the data collected.
- Administer a recent drinking history questionnaire to assess any changes in alcohol consumption since their screening visit.
- If there are any clinically significant medical findings, alert nursing and research staff.
- Insert a 20 G IV catheter into a vein in the antecubital fossa of the non-dominant arm for the alcohol infusion. Secure the positioning, Flush the indwelling catheter with a 5 mL of pre-filled saline flush, and cap the catheter.
- Confirm delivery of alcohol infusate, including participant name, age, sex, and date of expiration.
- Obtain aliquots from both IV bags and test the solution for correct alcohol concentration amount using a refractometer.
- Instruct the participant to void the bladder.
- Administer baseline measures of interest.
2. Set up IV pump
- Ensure the IV pump is plugged into an outlet.
- Connect the standard IV tubing to the infusion bags. Run the infusate through the entire length of the IV tubing using the IV pump to saturate the inner-tubing surface area and flush out any significant air bubbles.
- Choose enough tubing sets between the participant's arm to be infused and IV pump based on proximity to the bathroom so that the participant may use the restroom while remaining connected to the IV pump.
- Connect the ethernet cable from the computer to the pump.
- Switch on the pump by pressing the gray Power ON button on the upper right side.
- Press the Volume Infused button on the left side. Make sure the numbers read zero.
- If the numbers do not read zero, press the Clear button.
- Press the Options/Edit button. Press the number 4 to select the computer control option.
- Use the arrow buttons on the top row of the pump to select Yes and press Enter.
- Ensure that there is a Computer Control flashing on the top of the pump screen.
3. Set up the laptop (Figure 1)
NOTE: The sections below are performed using the software and the accessories associated with the CAIS system.
- Connect the Drink button that the participant uses to click for drinks into the USB portal closest to the participant.
- Ensure the Drink button is connected prior to opening the software, or the software will not detect the button.
- Insert the dongle.
- Select the drive to enter the password.
- Once the password has been accepted, open the drive titled SecuDrive to access the software.
- Double click the software icon.
- Click on File > New Session
- Create a filename using desired participant number.
- Save the data to the desktop, not the dongle, as the software may overload the dongle and crash.
- Select the PR experiment from the drop-down menu labeled Select Experiment.
- When the set-up screen appears requesting further information on the participant, fill in the fields requesting participant identification number, select "Standard" as study type, then enter sex and age in the appropriately labeled fields.
- Enter height (cm) and weight (kg) in the required fields using the data collected earlier in the visit.
- Click on the Submit button.
NOTE: The graph panel and the "welcome" window for the participant will now appear on the screen. - Move the window over to the participant's monitor by clicking and dragging across the screen. Enlarge to full screen so the participant can see it.
4. Progressive Ratio (PR) self-administration session (Figure 2)
- Offer participants a bathroom break before beginning. Afterward, connect IV tubing from the infusion bags to the participant. Read instructions to the participant.
NOTE: Instructions should include what participants are not allowed to do (i.e., read, do work, use their phone), what will happen during the experiment, such as serial measures collected, and any information regarding the increasing work scale for receiving drinks. - On the laptop, click on the Start/Run button at the top of the screen.
NOTE: A prompt appears on the participants' monitor, informing them to click the Drink button for their priming rewards. - Instruct the participant to press the Drink button as soon as the monitor prompts them to for their four individually standardized priming doses. Remind the participant to begin pressing the Drink button each time the screen prompt appears so that they reach their expected BrAC within 10 min.
NOTE: The entire priming phase should last 10 min. The doses require 2, 4, 7, and 10 button presses respectively in order to reach approximately 30 mg/dL (0.030 g/dL). - At the 10 min mark (immediately following the last priming drink), collect the BrAC and blood pressure. Administer the subjective response measures.
- Enter the BrAC into the software by pressing Ctrl + B and typing in the value (i.e., 0.030). This will cause the algorithm to adjust if need be. Repeat this step every time a BrAC is collected.
- Allow the participant to rest for 10 min.
NOTE: The infusion system will continue to deliver the infusate with a rate profile that achieves a linear descent in BrAC and will not count any button pushes until the ad-lib phase begins. - At the 20 min mark, collect the BrAC and blood pressure. Administer the subjective response measures.
- At the 25 min mark, inform the participant that the bar is open and include any further instructions required for the experiment. Do not interrupt work efforts when collecting measures from the participant.
NOTE: This instruction marks the transition from the priming to voluntary self-administration phase; participants are now working towards earning a reward any time and rate they wish or to pause or stop. Each drink requires increasing numbers of button presses before the reward is initiated. - At the 45 min mark, collect the BrAC, blood pressure, and subjective response measures.
- Continue to collect subjective response measures, blood pressure, and BrAC every 15 min until the 165 min mark.
- Enter BrAC measures immediately into the system to adapt to any modeling errors.
5. End of session
- Click the Data tab on the software and select Export.
NOTE: The system will create a .CAS file of all time-stamped data relevant to the experiment, including participant number, dates, morphometric data, PBPK parameters, BrAC trajectory, infusion rate profile, BrAC measurements, button push history, alcohol used, bathroom breaks, and any technician comments entered during the session. The .CAS file is write-protected but can be used to replay the session at any future date. - Remove the IV catheter.
- Press the Volume Infused button on the left side of the pump to see the values.
- Record the total volume of infusate used on the flowsheet.
- Remove the IV catheter.
- Continue to collect BrAC every 15-30 min until BrAC is below 20 mg/dL (0.02), or until the study-specific discharge criteria are met.
NOTE: The protocol ends here. The following steps are for potential troubleshooting issues and data analysis.
6. Drink button troubleshooting
- Do not stop the session if the Drink button loses connection with the software and no longer responds to a press.
- Remove the Drink button from the port and place it in a different port on the computer.
NOTE: The original port is no longer recognized by the software. - Click View on the software screen, scroll to the bottom, and select Map Drink Buttons.
- After a pop-up window appears on the screen, select the Drink button (signaling the software its new location) so that the address of the button's new location is entered for the Drink button.
- Select OK on the pop-up window on the computer screen.
- Press the Drink button again, and let the participant accept the drink.
Results
Volunteers were pre-screened via telephone interview and brought in for an initial screening visit. A physical examination and medical history, blood tests for liver function and routine blood chemistry, and a urine screen for illegal drugs were conducted. Recent drinking history was assessed using the 90-day Timeline Followback (TLFB)31 and Alcohol Use Disorder Identification Test (AUDIT)32.
Participants were excluded if they have any clinically significant medical problems, use of prescription or over-the-counter (OTC) medication known to interact with alcohol in the past 2-4 weeks, lifetime or current diagnosis of substance or alcohol dependence; currently seeking treatment for alcohol use disorders; the presence of withdrawal symptoms that are clinically significant (a score >8 on the Clinical Institute Withdrawal Assessment (CIWA))33, or pregnancy in women. Other IV alcohol administration studies have included participants with a lifetime diagnosis of alcohol dependence, as well as current if the participant is non-treatment seeking.
To better understand the role of alcohol expectancies on motivation for alcohol rewards, the Alcohol Effects Questionnaire (AEFQ)34 was administered. Additionally, subjective response measures were collected at baseline and serially during the study session to examine the urge for alcohol using the CAIS Experience Questionnaire (CEQ), Alcohol Urge Questionnaire (AUQ)35 and the effects of alcohol using the Drug Effects Questionnaire (DEQ)36. Measures of progressive ratio work include the total number of button presses across all rewards, the total number of false button presses (an incomplete attempt to press the button/or pressing faster than the maximal rate), total reward time (the amount of time spent pressing the button for alcohol), average rate of button pressing, and false button press fraction. Other measures included: peak BrAC, average BrAC, total rewards earned, and total ethanol consumed. These measures do not include the priming portion of the session.
Data were analyzed using General Linear Model Univariate to compare IV-ASA measures for males and females (Table 1) and Low Responders and High Responders (Table 2). Pearson's r correlational analyses were conducted to compare session 1 and session 2 IV-ASA measures (Figure 3) and IV-ASA measures with recent drinking history measures (Figure 4). Finally, General Linear Model Univariate analyses were conducted to compare Low and High Responders on measures of alcohol expectancies (Figure 5) and subjective response measures during the priming phase (Figure 6) and for peak subjective response scores (Figure 7).
One hundred and fifteen healthy, non-alcohol-dependent participants were recruited for this study. Sixteen participants were excluded due to availability issues, eight due to system crashes during 2nd infusion visit, six due to medical reasons (i.e., low blood pressure, fainting, etc.), and one from not meeting inclusion criteria (i.e., alcohol dependence diagnosis). Therefore, a total of 84 participants were used in the final analysis. The sample was 54.8% male (n = 46) and 67.9% identified as White/Caucasian (n = 57). Table 3 summarizes the demographics of the analytical sample.
Effects of sex differences were assessed on both drinking history measures as well as the session outcomes (Table 1). Females and males were not significantly different on recent drinking history measures as reported by the AUDIT and TLFB 90 Days. As for session measures, the only statistically significant sex difference was the total amount of EtOH consumed. This significant difference was expected given that males have larger total body water volumes of alcohol distribution than females, and these pharmacokinetic differences are adjusted for by the program. Sex was a covariant in all further analyses.
A subset of participants (N = 11) completed two identical sessions. Pearson's r correlation coefficients were calculated comparing session 1 and session 2 self-administration variables of peak BrAC, total rewards earned, the total number of button presses, and the average rate of button pressing. Pearson's r ranged from 0.81 to 0.96 (P ≤ 0.002). There was a high test-retest reliability for the progressive ratio method for all self-administration measures (Figure 3). Correlation coefficients were also used to examine internal consistency among self-administration measures. Pearson's r ranged from 0.71 to 0.96 (p < 0.01). As expected, the total number of rewards was strongly correlated with peak BrAC, average BrAC, and total EtOH infused (data not shown).
As expected, there was substantial variability in self-administration behavior (Figure 8). By comparing session data with recent drinking history, we found that the number of drinking days during the past 90 days was closely associated with drinking behaviors in the lab (Figure 4). These associations include regular measures such as peak BrAC, average BrAC (not shown in the figure), and total EtOH. The system-specific measures such as average rate and false button presses fraction were also associated with recent drinking history measures. Pearson's r ranged from 0.257 to 0.314 (p ≤ 0.025).
To evaluate the relationship between alcohol-seeking behavior and subjective responses throughout the session, a median split (median = 5) was conducted on total rewards earned, yielding 2 groups labeled low responders and high responders. High responders had significantly higher drinking history measures of Total Drinks over the past 90 days and Number of Heavy Drinking Days over the past 90 days (Table 2). As expected, higher responders pressed a significantly greater number of times for infusions during the session than low responders and spent more time working for those rewards (all p's < 0.001). Subjective responses were analyzed by comparing group means at baseline during the PR priming phase as during the PR self-administration phase. Low responders reported more overall negative expectancies of alcohol (p = 0.023) at baseline, including expectations of cognitive and physical impairment (p = 0.022) (Figure 5).
During the priming phase, low and high responders were significantly different on both CEQ and DEQ measures (Figure 6). High responders would have been willing to pay more money for their next drink (p = 0.038). Low responders felt the alcohol more after priming (p = 0.001) and felt more intoxicated following priming (p < 0.001).
During the open bar PR phase, high and low responders were significantly different on DEQ measures of "liking" (p = 0.014) and "wanting" (p = 0.001) alcohol (Figure 7). High responders had a higher craving for alcohol, as seen in the AUQ total score (p = 0.003). They were also still willing to pay more for their next drink at the end of the open bar PR phase (p < 0.001).

Figure 1: Test session set-up of materials. Schematic of the set-up of IV pump, work button, laptop, and data entry screen from the software. Please click here to view a larger version of this figure.
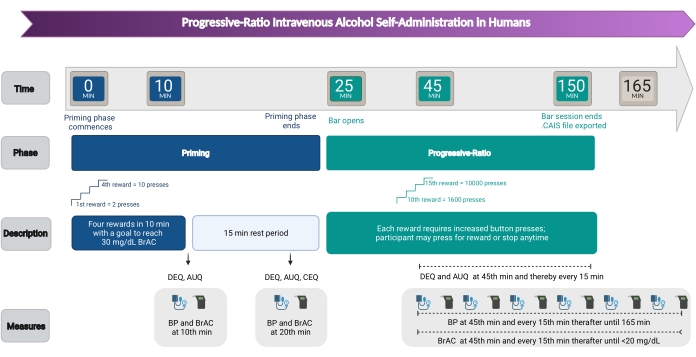
Figure 2: Timeline of events. Timeline of the priming session, ad-lib session, and measures collected. Please click here to view a larger version of this figure.
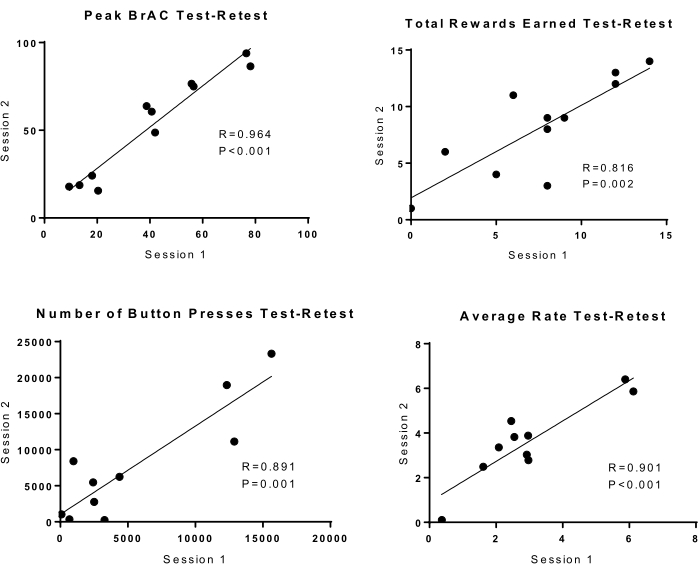
Figure 3: Test-retest reliability in n = 11 subjects undertaking 2 identical sessions. Session 1 is on the x-axis, and session 2 is on the y-axis. There were statistically significant correlations between session 1 and session 2 drinking measures for: peak BrAC, total rewards earned, the total number of button presses, and average rate of button pressing. Please click here to view a larger version of this figure.
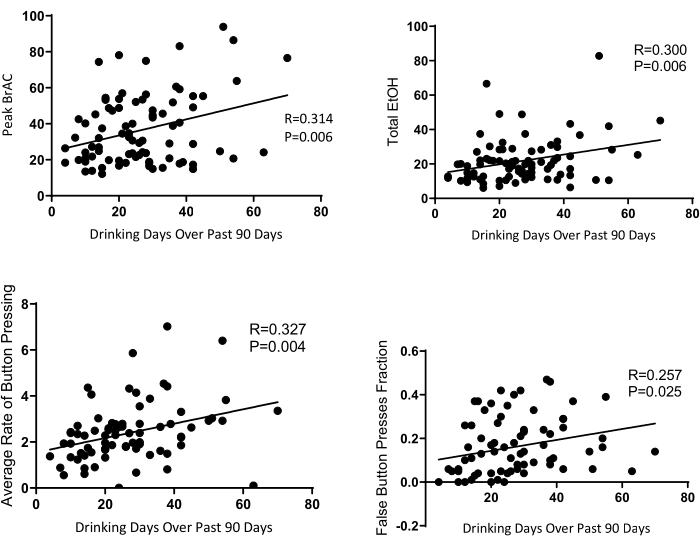
Figure 4: Recent drinking history and session measures. Graphical representation of the statistically significant relationship between past drinking history using the 90-day Timeline Followback (TLFB) and drinking measures during the self-administration session. Please click here to view a larger version of this figure.

Figure 5: Alcohol expectancies. Alcohol expectancies at baseline were significantly different between low versus high responders. Low responders expected more overall negative effects from alcohol at baseline and, specifically, greater cognitive and physical impairment as a result of alcohol. *p < 0.05 Please click here to view a larger version of this figure.
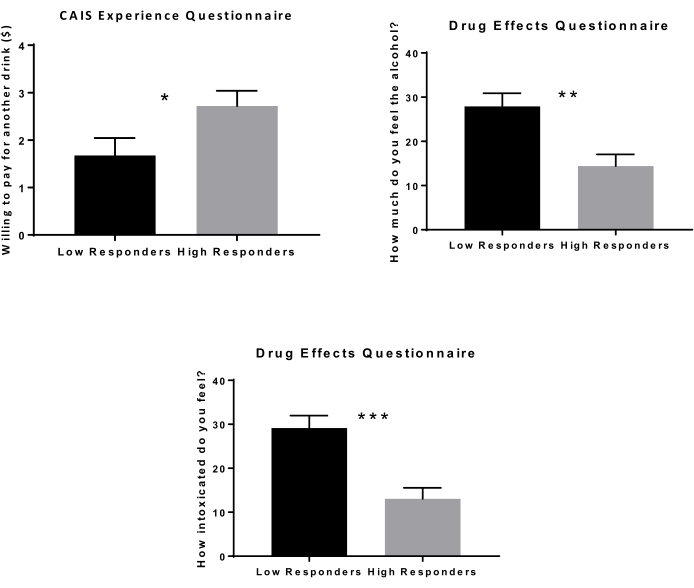
Figure 6: Subjective response following priming phase. Subjective response at the 20 min mark was significantly different between low versus high responders. High responders were willing to pay more for their next drink after priming, as indicated by the CEQ. Low responders felt the alcohol more directly after priming and felt more intoxicated, as indicated by the DEQ. *p < 0.05; **p < 0.01; ***p < 0.001 Please click here to view a larger version of this figure.
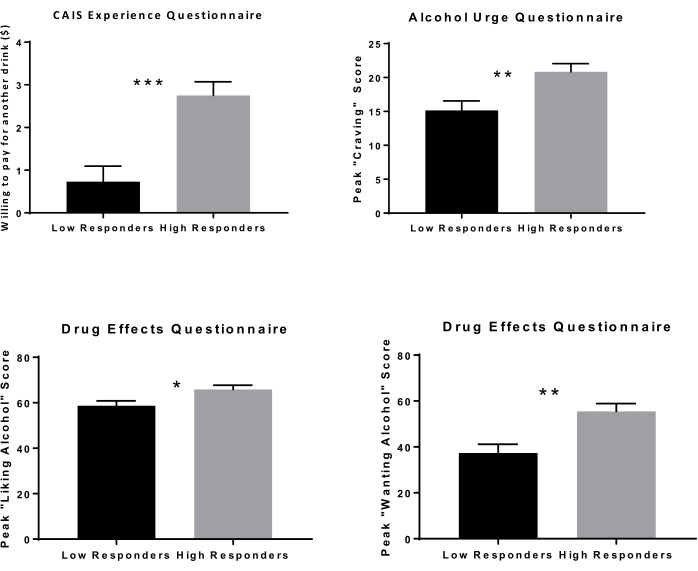
Figure 7: Subjective response during progressive-ratio open bar phase. Subjective response during the open bar phase was significantly different between low versus high responders. High responders reported higher peak scores for liking alcohol and wanting alcohol on the DEQ. They also reported higher peak craving or urge for alcohol on the AUQ. High responders were willing to pay more for their next drink at the end of the open-bar phase, as indicated by the CEQ. *p < 0.05; **p < 0.01; ***p < 0.001 Please click here to view a larger version of this figure.
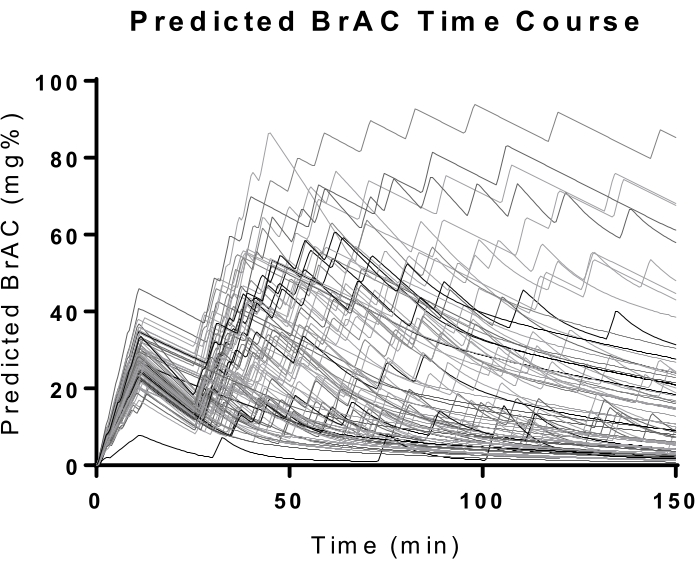
Figure 8: BrAC trajectories. The graphs document the predicted BrAC trajectories during the entire session (including the priming phase). At the 10 min mark, most participants achieved a 30 mg/dL BrAC, which was the desired BrAC for the priming phase. The variability in the self-administration phase reflects the sensitivity of the paradigm to differences across participants. Please click here to view a larger version of this figure.
| Females (N = 38) | Males (N = 46) | |
| Drinking History: | ||
| Total Drinks | 92.8 ± 120.7 | 93.9 ± 72.9 |
| Drinking Days | 25.1 ± 12.9 | 27.7 ± 14.3 |
| Drinks per Day | 3.3 ± 2.3 | 3.4 ± 1.6 |
| Heavy Drinking Days | 8.9 ± 11.5 | 6.4 ± 9.1 |
| Session Measures: | ||
| Peak BrAC | 34.6 ± 17.7 | 37.9 ± 21.0 |
| Average BrAC | 21.4 ± 15.6 | 23.3 ± 18.7 |
| Total Rewards Earned | 5.4 ± 3.3 | 5.5 ± 3.8 |
| Total EtOH consumed (grams) ** | 16.8 ± 7.6 | 25.6 ± 15.0 |
| Number of Button Presses | 2035.2 ± 2657.1 | 2940.7 ± 5179.5 |
| Number of False Button Presses | 445.7 ± 828.2 | 585.0 ± 1112.4 |
| Total Reward Time | 1146.9 ± 1277.3 | 1460.0 ± 1643.3 |
| Average Rate of Button Pressing | 1.9 ± 1.1 | 2.3 ± 1.6 |
| False Button Presses Fraction | 0.12 ± 0.12 | 0.16 ± 0.14 |
| False Button Presses Fraction | 0.12 ± 0.12 | 0.16 ± 0.14 |
Table 1: Sex differences in drinking measures. The first panel reports 90 Day Timeline Followback (TLFB) measures. Males and females were not significantly different (p > 0.05) on any drinking history measures, indicating that they drank similarly outside the lab. The second panel shows session consumption measures. Males and females were significantly different only on the total amount of ethanol consumed (**p = 0.005). This difference is commensurate with sex differences in total body water and likely reflects the difference in consumption needed to achieve comparable peak BrACs.
| Low Responders (N = 45) | High Responders (N = 39) | |
| Drinking History: | ||
| Total Drinks* | 73.5 ± 48.4 | 116.4 ± 129.4 |
| Drinking Days | 24.8 ± 13.6 | 28.7 ± 13.7 |
| Drinks per Day | 3.2 ± 1.6 | 3.7 ± 2.3 |
| Heavy Drinking Days* | 5.7 ± 7.4 | 9.6 ± 12.6 |
| Session Measures: | ||
| Peak BrAC** | 26.4 ± 12.4 | 47.9 ± 20.0 |
| Average BrAC** | 12.6 ± 9.5 | 33.8 ± 17.4 |
| Total Rewards Earned** | 2.5 ± 1.6 | 8.7 ± 1.9 |
| Total EtOH consumed (g) ** | 15.2 ± 6.6 | 29.1 ± 14.4 |
| Number of Button Presses** | 225.1 ± 242.1 | 5191.8 ± 5046.0 |
| Number of False Button Presses** | 37.9 ± 75.3 | 1080.5 ± 1240.9 |
| Total Reward Time (s)** | 386.4 ± 961.3 | 2393.7 ± 1246.9 |
| Average Rate of Button Pressing** | 1.7 ± 1.4 | 2.6 ± 1.4 |
| False Button Presses Fraction** | 0.09 ± 0.11 | 0.20 ± 0.13 |
Table 2: Low and high responder differences in drinking history measures. The table reports 90 Day Timeline Followback (TLFB) measures and intravenous self-administration measures (IV-ASA). Low Responders and High Responders were significantly different on Total Drinks and Number of Heavy Drinking Days (all p's < 0.05). These differences indicate that these participants have different drinking histories that were also reflected in their PR behavior in the laboratory. Low Responders had significantly lower IV-ASA measures than High Responders (all p's < 0.001).
| Construct | Mean ± S.D. (Percentage) | |
| Sex | Female | 38 (45.2%) |
| Male | 46 (54.8%) | |
| Race | White | 57 (67.9%) |
| African American/Black | 12 (14.3%) | |
| Asian | 9 (10.7%) | |
| Mixed Race | 5 (6.0%) | |
| Unknown | 1 (1.2%) | |
| Age | 24.8 ± 3.0 | |
| Years of Education | 15.9 ± 3.0 | |
| Household Income | Median | $30,000–$39,999 |
Table 3: Demographics of the analytical sample. This table gives a breakdown of the characteristics of our sample.
Discussion
This protocol provides evidence that a progressive-ratio intravenous alcohol self-administration procedure successfully measures motivation for alcohol consumption in humans. The methodology extends the original pre-clinical progressive-ratio model into humans37. Test-retest results indicate that this paradigm provides a reliable protocol to test motivation for seeking alcohol across repeated visits. This protocol is also sensitive to variability in alcohol consumption behavior during a session, measures that may have the potential to influence motivation for alcohol, such as alcohol expectancies, and to associate differences in recent drinking history and may reflect the within-session subjective responses to alcohol. Support for the effectiveness of this procedure has also been published elsewhere, showing greater subjective response in terms of desire for more alcohol27,28,29,38 and greater consumption of alcohol39.
Because intravenous administration of alcohol is coupled with individualized PBPK-based computations of the infusion rate, a significant improvement upon oral alcohol methods (which can have a 3-4-fold difference) is achieved19. CAIS significantly reduces these interindividual differences in the distribution and elimination of alcohol by bypassing gastrointestinal absorption. Using the afore-mentioned PBPK model-based algorithm20, the system then prescribes the incremental trajectory of BrAC, which can then be adjusted by the investigator for their specific protocol22,23,27.
This protocol provides a platform for alcohol consumption that is simple to modify to match the characteristics being studied in the participant group and can be adjusted to reflect the question of interest. For example, the inclusion of a priming phase was specific to this study; other options are to remove the priming phase or to provide a specific target level or exposure. Such modifications include adjustments to the reward properties, the work required to achieve a reward, the timing of alcohol delivery, the length of the study, safety cut-off, and the ability to include an alternative reward, commonly placebo (e.g., saline).
In experiments using ingestion of alcohol, attention to safety concerns limits the amount of alcohol available to the participant for delivery over the course of a study; the resulting peak BrAC is typically much lower than a participant would consume outside of the laboratory. Using intravenous infusion combined with individualized, real-time PBPK modeling of the future trajectory of BrAC, the system controls the exposure. A safety limit can be prescribed, and all participants have access to peak BrACs typical of binge drinking if they choose. Currently recommended safety limits are 120 mg/dL in moderate drinkers, 150 mg/dL in heavy drinkers, and 180 mg/dL in dependent drinkers. In the free access paradigm, some drinkers will still reach and maintain these limits. In the PR paradigm, the peak BrAC exposure can be limited by specifying the sequence of work set requirements, given the incremental reward exposure chosen. By using a progressive-ratio method, the outcome used to measure the desire for alcohol is the amount of work produced to receive an exposure to alcohol satisfying that desire. Additionally, the measure of false button presses may be a limitation. Other factors can influence the number of false button presses, such as fatigue, the type of button used (our button versus a click on a mouse), or alcohol intoxication. Variations of this approach as applied by Plawecki et al. have been used to overcome this limitation using a modified PR task called the Constant Attention Task (CAT)25,26.
The most important limitation is the lack of a naturalistic setting as this procedure is typically done in a hospital or laboratory setting and uses a method of alcohol administration outside of the participant's experience. More beneficially, by eliminating environmental cues for alcohol consumption, these constraints allow the experimenters the flexibility of introducing those elements back into the experiment. For example, the computer screen can be formatted to include a bar setting, the room where the experiment is conducted could be changed to appear more like a bar, olfactory cues of alcohol or visual cues of alcohol can be introduced as well.
The significance of this method is that it provides direct control of incremental BrAC exposure, yielding range and flexibility in terms of alcohol delivery that oral alcohol methods cannot provide. Importantly, this progressive-ratio intravenous alcohol self-administration paradigm translates work effort into exposures that are consistent within and across participants and produce easily measurable outcomes. The set-up file defining work sequences and incremental reward exposures is simple to modify and tailor for experiments. An alternative method for prescribing work that uses IV alcohol and progressive ratio includes an attention component25,26. This method requires the participant to work for the alcohol-based on performing a task that requires constant attention to perform successfully. This method adapts to compensate for both the effects of alcohol as well as fatigue.
One of the most important applications for this method is medications development in the laboratory setting. The application of this system to relevant clinical populations is a highly promising and important direction to determine the effectiveness of medications on motivation for alcohol rewards. Test-retest of this protocol supports the reliability of the measures, while progressive ratio eases the concern of heavier drinkers reaching the BrAC ceiling while maintaining a measure directly addressing motivation for seeking alcohol. Furthermore, the use of this protocol may provide a better opportunity to examine genetic and environmental determinants of alcohol seeking.
Disclosures
Investigators interested in adapting the software to their own research should contact the corresponding author and Dr. Martin Plawecki. CAIS is not a free software. The authors declare no competing financial interests.
Acknowledgements
This work was supported by the National Institute on Alcohol Abuse and Alcoholism Division of Clinical and Biological Research (Z1A AA 000466). The CAIS software was developed with support from Sean O'Connor, Martin Plawecki, James Hays, and Victor Vitvitskiy from the Indiana Alcohol Research Center (P60 AA 07611). Martin Plawecki is also supported by NIAAA R01 AA027236. CAIS-PR paradigms were developed with further support from Ulrich Zimmermann and Vijay Ramchandani. The authors thank Dr. Mary Lee, Dr. Nancy Diazgranados, Dr. David T. George, and Nurse Practitioner LaToya Sewell for medical support and the monitoring safety of the participants, as well as Dr. Reza Momenan for operational support. The authors also would like to thank the staff of the 5-SW day hospital and 1-HALC alcohol clinic at the NIH Clinical Center. The authors thank the research assistants for their operational support of the study, including Molly Zametkin, Jonathan Westman, Kristin Corey, Lauren Blau, and Courtney Vaughan. Finally, the authors are grateful and appreciative for the clinical oversight and guidance from the late Dr. Daniel Hommer.
Materials
| Name | Company | Catalog Number | Comments |
|---|---|---|---|
| Alcohol Infusate | AKORN Pharmaceuticals | https://www.akorn.com/ | 95% ethanol solution can be purchased and diluted to 6% V/V ethanol solution. Must contact company for a quote |
| Breath Alcohol Meter Draeger models 6820 or 5820 | Draeger Safety Diagnostics | https://www.draeger.com/en-us_us/Applications/Products/Breath-Alcohol-and-Drug-Testing/Alcohol-Screening-Devices/Alcotest-6820; https://www.draeger.com/en-us_us/Applications/Products/Breath-Alcohol-and-Drug-Testing/Alcohol-Screening-Devices/Draeger-Alcotest-5820 | To collect breathalyzer readings |
| Computer-assisted Alcohol Infusion System (CAIS) | Indiana University | To adapt CAIS for one's own research aims, contact the corresponding author Dr. Bethany Stangl and Dr. Martin Plawecki | |
| Digital Refractometer | Atago | PR-32α (atago-usa.com) | To test the alcohol concentration of the infusate |
| Griffin Powermate buttons | CDW Government Inc. | Item was discontinued 2018; currently working on a replacement | |
| iMed Gemini PC-2TX Infusion Pump | Soma Technology, Inc. or DiaMedical USA | http://www.somatechnology.com/ OR https://diamedicalusa.com/medical-equipment/on-site-repairs-preventive-maintenance/infusion-pump-repair-service/alaris-infusion-pumps/alaris-imed-gemini-pc-2tx-infusion-pump-2/ | Infusion pump. Must contact company for a quote as product is not shown on the website. |
| Laptop/Computer | CDW Government Inc. | https://www.cdwg.com/search/computers/laptops-2-in-1s/laptops/?w=CB2&filter=af_system_notebook _type_cb2_ss%3a(%22Notebook%22) | OS, Windows 7 or newer (with updates installed); Administrative privileges; MS Office (including Excel); At least 3 usb ports on PC, and a port multiplier depending on actual experiment. |
| Secure Dongle | SecuTech | https://esecutech.com/store/unikey/unikey-drive/unikey-drive-2gb | For CAIS software and data storage |
| StarTech.com 1 Port USB to RS232 DB9 Serial Adapter Cable - M/M | CDW Government Inc. | StarTech.com 1 Port USB to RS232 DB9 Serial Adapter Cable - M/M - ICUSB232V2 - - (cdwg.com) | To connect laptop to IV pump |
| StarTech.com 2 Port USB to RS-232 Serial DB9 Adapter Cable - Serial Adapter | CDW Government Inc. | StarTech.com 2 Port USB to RS-232 Serial DB9 Adapter Cable - Serial Adapter - ICUSB232C2 - - (cdwg.com) | To connect laptop to IV pump |
| StarTech.com DB9 to RJ45 Modular Adapter F F serial adaptor | CDW Government Inc. | https://www.cdwg.com/shop/products/StarTech.com-DB9-to-RJ45-Modular-Serial-Adapter-Black/386543.aspx?pfm=srh | To connect laptop to IV pump |
| StarTech.com DB9 to RJ45 Modular Adapter M F serial adaptor | CDW Government Inc. | https://www.cdwg.com/shop/products/StarTech.com-DB9-to-RJ45-Modular-Serial-Adapter-Black/386544.aspx?enkwrd=StarTech%20com%20DB9%20to%20RJ45%20Modular%20Adapter%20M%20F%20serial%20adapter&pfm=srh | To connect laptop to IV pump |
| USB extension cable 12' | CDW Government Inc. | https://www.cdwg.com/shop/products/StarTech.com-10ft-USB-2.0-Extension-Cable-A-to-A-Cable-Black/2274398.aspx?pfm=srh | To connect and extend the button in reach of the participant |
| VGA Cable 12' | BestBuy | https://www.bestbuy.com/site/insignia-12-vga-cable-black/5884115.p?skuId=5884115 | To connect monitor to laptop |
References
- Li, T. K., McBride, W. J. Pharmacogenetic models of alcoholism. Journal of Clinical Neuroscience. 3, 182-188 (1995).
- Li, T. K. Pharmacogenetics of responses to alcohol and genes that influence alcohol drinking. Journal of Studies on Alcohol and Drugs. 61, 5-12 (2000).
- Li, T. K., et al. Alcohol reinforcement and voluntary ethanol consumption. Alcoholism, Clinical and Experimental Research. 25 (5), Suppl ISBRA 117-126 (2001).
- O'Malley, S. S., Krishnan-Sarin, S., Farren, C., Sinha, R., Kreek, M. J. Naltrexone decreases craving and alcohol self-administration in alcohol-dependent subjects and activates the hypothalamo-pituitary-adrenocortical axis. Psychopharmacology (Berl). 160 (1), 19-29 (2002).
- Drobes, D. J., Anton, R. F., Thomas, S. E., Voronin, K. A clinical laboratory paradigm for evaluating medication effects on alcohol consumption: naltrexone and nalmefene. Neuropsychopharmacology. 28, 755-764 (2003).
- Anton, R. F., Drobes, D. J., Voronin, K., Durazo-Avizu, R., Moak, D. Naltrexone effects on alcohol consumption in a clinical laboratory paradigm: temporal effects of drinking. Psychopharmacology (Berl). 173 (1-2), 32-40 (2004).
- Sabino, V., et al. The sigma-receptor antagonist BD-1063 decreases ethanol intake and reinforcement in animal models of excessive drinking. Neuropsychopharmacology: Official Publication of the American College of Neuropsychopharmacology. 34 (6), 1482-1493 (2009).
- Sabino, V., Cottone, P., Zhao, Y., Steardo, L., Koob, G. F., Zorrilla, E. P. Selective reduction of alcohol drinking in Sardinian alcohol-preferring rats by a sigma-1 receptor antagonist. Psychopharmacology (Berl). 205 (2), 327-335 (2009).
- Vendruscolo, L. F., et al. Corticosteroid-dependent plasticity mediates compulsive alcohol drinking in rats. The Journal of neuroscience: the official journal of the Society for Neuroscience. 32 (22), 7563-7571 (2012).
- Greene, A. S., Grahame, N. J. Ethanol dinking in rodents: is free-choice drinking related to the reinforcing effects of ethanol. Alcohol. 42, 1-11 (2008).
- June, H. L., Gilpin, N. W. Operant self-administration models for testing the neuropharmacological basis of ethanol consumption in rats. Current Protocols in Neuroscience. , Supplement 51 1-26 (2010).
- Haney, M., Spealman, R. Controversies in translational research: drug self-administration. Psychopharmacology (Berl). 199 (3), 403-419 (2008).
- Walsh, S. L., Donny, E. C., Nuzzo, P. A., Umbricht, A., Bigelow, G. E. Cocaine abuse versus cocaine dependence: cocaine self-administration and pharmacodynamic response in the human laboratory. Drug and Alcohol Dependence. 106, 28-37 (2010).
- Setiawan, E., et al. The effect of naltrexone on alcohol's stimulant properties and self-administration behavior in social drinkers: influence of gender and genotype. Alcoholism, Clinical and Experimental Research. 35 (6), 1134-1141 (2011).
- Barrett, S. P., Pihl, R. O., Benkelfat, C., Brunelle, C., Young, S. N., Leyton, M. The role of dopamine in alcohol self-administration in humans: individual differences. European Neuropsychopharmacology: The Journal of the European College of Neuropsychopharmacology. 18 (6), 439-447 (2008).
- Barrett, S. P., Tichauer, M., Leyton, M., Pihl, R. O. Nicotine increases alcohol self-administration in non-dependent male smokers. Drug and Alcohol Dependence. 81, 197-204 (2006).
- de Wit, H., McCracken, S. G. Ethanol self-administration in males with and without an alcoholic first-degree relative. Alcoholism: Clinical and Experimental Research. 14, 63-70 (1990).
- Davidson, D., Palfai, T., Bird, C., Swift, R. Effects of naltrexone on alcohol self-administration in heavy drinkers. Alcoholism: Clinical and Experimental Research. 23, 195-203 (1999).
- Ramchandani, V. A., Plawecki, M., Li, T. K., O'Connor, S. Intravenous ethanol infusions can mimic the time course of breath alcohol concentrations following oral alcohol administration in healthy volunteers. Alcoholism: Clinical and Experimental Research. 33 (5), 938-944 (2009).
- Ramchandani, V. A., Bolane, J., Li, T. K., O'Connor, S. A physiologically-based pharmacokinetic (PBPK) model for alcohol facilitates rapid BrAC clamping. Alcoholism: Clinical and Experimental Research. 23, 617-623 (1999).
- O'Connor, S., Ramchandani, V. A., Li, T. K. PBPK modeling as a basis for achieving a steady BrAC of 60 +/- 5 mg/dL within ten minutes. Alcoholism: Clinical and Experimental Research. 24, 426-427 (2000).
- Zimmermann, U. S., O'Connor, S., Ramchandani, V. A. Modeling alcohol self-administration in the human laboratory. Current Topics in Behavioral Neurosciences. 13, 315-353 (2013).
- Zimmermann, U. S., Mick, I., Vitvitskiy, V., Plawecki, M. H., Mann, K. F., O'Connor, S. Development and pilot validation of computer-assisted self-infusion of ethanol (CASE): a new method to study alcohol self-administration in humans. Alcoholism, Clinical and Experimental Research. 32 (7), 1321-1328 (2008).
- Zimmermann, U. S., et al. Offspring of parents with an alcohol use disorder prefer higher levels of brain alcohol exposure in experiments involving computer-assisted self-infusion of ethanol (CASE). Psychopharmacology (Berl). 202 (4), 689-697 (2009).
- Plawecki, M. H., et al. Voluntary intravenous self-administration of alcohol detects an interaction between GABAergic manipulation and GABRG1 polymorphism genotype: a pilot study. Alcoholism, Clinical and Experimental Research. 37, Suppl 1 152-160 (2013).
- Plawecki, M. H., et al. Sex differences in motivation to self-administer alcohol after 2 weeks of abstinence in young-adult heavy drinkers. Alcoholism, Clinical and Experimental Research. 42 (10), 1897-1908 (2018).
- Cyders, M. A., et al. Translating pre-clinical models of alcohol seeking and consumption into the human laboratory using intravenous alcohol self-administration paradigms. Addiction Biology. 26 (6), 13016(2021).
- VanderVeen, J. D., et al. Negative urgency, mood induction, and alcohol seeking behaviors. Drug and Alcohol Dependence. 165, 151-158 (2016).
- Cyders, M. A., et al. Gender-specific effects of mood on alcohol-seeking behaviors: Preliminary findings using intravenous alcohol self-administration. Alcoholism, Clinical and Experimental Research. 40 (2), 393-400 (2016).
- O'Connor, S., Morzorati, S., Christian, J., Li, T. K. Clamping breath alcohol concentration reduces experimental variance: application to the study of acute tolerance to alcohol and alcohol elimination rate. Alcoholism, Clinical and Experimental Research. 22 (1), 202-210 (1998).
- Sobell, L. C., Sobell, M. B. Timeline follow-back: a technique for assessing self-reported alcohol consumption. Measuring Alcohol Consumption: Psychosocial and Biochemical Methods. , Humana Press. Totowa, NJ. 41-72 (1992).
- Babor, T. F., Kranzler, H. R., Lauerman, R. J. Early detection of harmful alcohol consumption: comparison of clinical, laboratory, and self-report screening procedures. Addictive Behaviors. 14 (2), 139-157 (1989).
- Sullivan, J. T., Sykora, K., Schneiderman, J., Naranjo, C. A., Sellers, E. M. Assessment of alcohol withdrawal: The revised clinical institute withdrawal assessment for alcohol scale (CIWA-Ar). British Journal of Addiction. 84, 1353-1357 (1989).
- Rohsenow, D. J. Drinking habits and expectancies about alcohol's effects for self versus others. Journal of Consulting and Clinical Psychology. 51 (5), 752-756 (1983).
- Bohn, M. J., Krahn, D. D., Staehler, B. A. Development and initial validation of a measure of drinking urges in abstinent alcoholics. Alcoholism, Clinical and Experimental Research. 19 (3), 600-606 (1995).
- Fischman, M. W., Foltin, R. W. Utility of subjective-effects measurements in assessing abuse liability of drugs in humans. British Journal of Addiction. 86 (12), 1563-1570 (1991).
- Richardson, N. R., Roberts, D. C. Progressive ratio schedules in drug self-administration studies in rats: a method to evaluate reinforcing efficacy. Journal of Neuroscience Methods. 66 (1), 1-11 (1996).
- Farokhnia, M., et al. Exogenous ghrelin administration increases alcohol self-administration and modulates brain functional activity in heavy-drinking alcohol-dependent individuals. Molecular Psychiatry. 23 (10), 2029-2038 (2018).
- Bujarski, S., Jentsch, J. D., Roche, D., Ramchandani, V. A., Miotto, K., Ray, L. A. Differences in the subjective and motivational properties of alcohol across alcohol use severity: application of a novel translational human laboratory paradigm. Neuropsychopharmacology: Official Publication of the American College of Neuropsychopharmacology. 43 (9), 1891-1899 (2018).
Reprints and Permissions
