We present a protocol for ex vivo cultivation of human ventricular myocardial tissue. It allows for detailed analysis of contraction force and kinetics, as well as the application of pre- and afterload to mimic the in vivo physiological environment more closely.
Method Article
Preparation of Human Myocardial Tissue for Long-Term Cultivation
In This Article
Summary
Abstract
Cardiomyocyte cultivation has seen a vast number of developments, ranging from two-dimensional (2D) cell cultivation to iPSC derived organoids. In 2019, an ex vivo way to cultivate myocardial slices obtained from human heart samples was demonstrated, while approaching in vivo condition of myocardial contraction. These samples originate mostly from heart transplantations or left-ventricular assist device placements. Using a vibratome and a specially developed cultivation system, 300 µm thick slices are placed between a fixed and a spring wire, allowing for stable and reproducible cultivation for several weeks. During cultivation, the slices are continuously stimulated according to individual settings. Contractions can be displayed and recorded in real-time, and pharmacological agents can be readily applied. User-defined stimulation protocols can be scheduled and performed to assess vital contraction parameters like post-pause-potentiation, stimulation threshold, force-frequency relation, and refractory period. Furthermore, the system enables a variable pre- and afterload setting for a more physiological cultivation.
Here, we present a step-by-step guide on how to generate a successful long-term cultivation of human left ventricular myocardial slices, using a commercial biomimetic cultivation solution.
Introduction
In the past decade, in vitro cultivation of myocardial cells has made great advances, ranging from 2D and three-dimensional (3D) techniques to the use of organoids and induced pluripotent stem cells differentiated into cardiac myocytes1,2,3. Ex vivo and primary cell cultivations have shown to be of great value, especially for genetic studies and drug development4,5,6. Using human tissues improves the translational value of the results. Long-term 3D cultivation of myocardial tissues with intact geometry, however, is not well-established. The intact geometry is a key feature to mimic in vivo conditions, as proper cardiac function, communication between different cells, as well as cell-matrix interactions are prerequisites. Myocardial tissue cultivation went through various phases of development. The success rate and stability of ex vivo myocardial tissue cultivation were initially quite low, but recent approaches have yielded promising results7,8,9,10,11.
Among those, Fischer et al. were the first to demonstrate that viability and contractile performance of human myocardial tissue can be maintained in ex vivo cell cultivation for many weeks7. Their technique was based on thin tissue slices cut from explanted human myocardium, which were mounted in newly developed cultivation chambers that provided defined biomechanical conditions and continuous electrical stimulation. This cultivation method closely resembles the in vivo function of myocardial tissue, and has been reproduced by several independent research groups2,12,13,14,15. Importantly, the chambers used by Fischer et al. also enabled continuous registration of developed forces for up to 4 months, and thus opened unprecedented opportunities for physiological and pharmacological research on intact human myocardium7.
Similar techniques were independently developed by other groups and applied to human, rat, porcine, and rabbit myocardium7,10,11. Pitoulis et al. subsequently developed a more physiological method, which reproduces the normal force-length relation during a contraction cycle, but is less suitable for high-throughput analysis16. As such, the general approach of biomimetic cultivation can be regarded as a further step into the reduction, refinement, and replacement (3R) of animal experiments.
However, exploitation of this potential requires standardized procedures, high content analyses, and a high throughput level. We present a technique that combines automated slicing of living human myocardium with in vitro maintenance in a biomimetic cultivation system that has become commercially available (see Table of Materials). With the proposed approach, the number of individual slices that can be generated from a single transmural myocardial specimen is only limited by the processing time. A specimen of sufficient size and quality (3 cm x 3 cm) often yields 20-40 tissue slices being conveniently cut with an automated vibratome. These slices can be placed in cultivation chambers belonging to the system. The chambers allow for electrical stimulation, the parameters of which can be modulated (i.e., pulse duration, polarity, rate, and current), as well as the adjustment of pre- and afterload, using spring wires inside the chambers. The contraction of each slice is registered from the movement of a small magnet attached to a spring wire and displayed as an interpretable graph. Data can be recorded at all times and analyzed using freely available software. Aside from the constant baseline pacing, scheduled protocols can be performed to functionally assess their refractory period, stimulation threshold, post-pause-potentiation, and force-frequency relation.
This long-term biomimetic cultivation of multiple myocardial slices from an individual heart paves the way for future ex vivo research in both human and animal tissue, and facilitates the screening for therapeutic and cardiotoxic drug effects in cardiovascular medicine. It has already been applied to various experimental approaches2,12,13,15. Here, we give a detailed step-by-step description of the preparation of human tissue and provide solutions for frequently encountered cultivation problems.
Protocol
Tissue collection for the experiments described here was approved by the Institutional Review Boards of the University of Munich and the Ruhr-University Bochum. Studies were conducted according to Declaration of Helsinki guidelines. Patients gave their written informed consent prior to tissue collection.
1. Tissue acquisition
- Obtain human tissue from patients undergoing heart transplantation or cardiac surgery.
- Before procuring the tissue, prepare 2 L of cardioplegic solution (further referred to as slicing buffer (Table 1)).
- After obtaining a 4 cm x 4 cm sized transmural left ventricular (LV) biopsy, place the tissue immediately (within 5 min after excision) in a closable plastic single-use sterile beaker containing approximately 70 mL of cold (4 °C) slicing buffer. Keep at 4 °C.
NOTE: The slicing buffer used in this protocol allows for cold storage (4 °C) of the tissue for up to 36 h. This permits cold transport of the tissue from clinics which are not close to the laboratory. However, transport times ≤ 24 h have proven to be optimal.
2. Preparing agarose and the vibratome
- Make sure sufficient cultivation chambers are prepared and sterilized (Figure 1A).
- Submerge the chambers and graphite electrodes in 1 L of a 10% isopropanol solution and agitate overnight. The following day, transfer the chambers to a 100% isopropanol solution for 3 min and autoclave the graphite electrodes at 120 °C for 10 min.
- Let the chambers and graphite electrodes air-dry under a laminar flow hood.
- Attach a circuit board to each of the chambers according to the available positions on the rocker. Place two graphite electrodes to the circuit board as per manufacturer's instructions.
- Place a 35 mm Petri dish lid on top of the chamber to prevent contamination.
- Set up the Myodish cultivation system (see Table of Materials) in an incubator at 37 °C and 5% CO2 by connecting the system to a computer (Figure 1B).
- Prepare the 4% low-melt agarose in slicing buffer (without glucose; Table 2). The agarose can be stored at 4 °C for 6 months.
- On the day of the experiment, melt a stock volume of agarose solution using a water bath set at 80 °C. Depending on the quantity, melting takes approximately 30 min.
- When the agarose is liquid, draw up 8 mL of liquid agarose into a 10 mL syringe, with an additional 2 mL of air. Close the syringe with a sterile cap and place it upside down in a 37 °C water bath for 20 min, to prevent the agarose from solidifying, and to equilibrate its temperature to prevent hyperthermia damage of the sample.
- If present, turn on water cooling device of the vibratome at least 30 min prior to tissue slicing to allow for sufficient cooling capacity. Set the temperature of the water circulation to 4 °C.
NOTE: The cutting tray and cooling plate used here both contained a built-in water circulation. This is highly recommended for cooling and to lower the contamination risks. It is however also possible to use ice as a cooling technique. Also, the water-cooling device does not need to be connected to the vibratome's cutting tray and/or cooling plate at this point in the protocol. - Clean the vibratome's slicing tray and sample plate by flushing all surfaces with 100% isopropanol for at least 3 min.
NOTE: Depending on the vibratome system used, the vibratome set-up might differ. Refer to the manual of the vibratome present in the laboratory for information about the set-up and blade calibration methods. - Fill the cutting tray up to 90%-95% with slicing buffer. In the currently used set-up, this corresponds to approximately 400 mL. Connect the tubing of the water-cooling device to the valves on the vibratome's cutting tray and cooling plate.
- Disinfect all tools needed for the preparation by submerging them in a 100% isopropanol solution for 5 s. Remove the tools from the isopropanol solution and air-dry under the laminar flow hood.
3. Trimming and embedding the samples
- Transfer the tissue sample to a 100 mm Petri dish filled with cold slicing buffer. Keep the dish on a cooling plate at 4 °C (connected to cooler or placed on ice).
- Remove endocardial trabeculae by holding the endocardium with tweezers and using scissors to cut away approximately 3 mm of endocardial tissue. In the same way, remove excessive adipose tissue underneath the epicardium if present.
- Fixate the cut tissue sample, endocardial side up, to a 2 cm x 2 cm rubber patch using four 0.9 mm x 70 mm 20 G needles that are fixed in a square position (0.9 cm x 0.9 cm; Figure 1C, D). Make sure that the diagonal edge of each needle tip is pointing inward. This enhances fixation and prevents damage to the myocardium.
CAUTION: The orientation of the above-mentioned square should be orthogonal to the expected predominant myofiber direction. - Cut away all the excess tissue outside of the four needle square using a scalpel. If the size of the original sample allows, use two myocardial tissues samples during this preparation from the same raw sample.
- Using tweezers, place the trimmed sample on a sterile piece of tissue to remove any excess slicing buffer left on the sample.To prevent drying out of the sample, do not keep the sample on the tissue for longer than 10 s.
- Place the sample(s) in a 35 mm Petri dish, such that the blade cuts perpendicular to the cardiomyocyte alignment and the epicardium is facing downwards. If the preparation includes two samples, make sure the samples are centered and do not touch each other.
- Take the agarose syringe from the water bath and submerge the sample(s) in agarose. (Figure 2A). Let the agarose solidify for 5 min on a cooling plate. The sample(s) must stay in contact with the Petri dish, which will ensure that the cutting plane will be parallel to the predominant myocardial fiber direction.
CAUTION: Do not fully empty the syringe, in order to prevent air bubbles. Pay attention to the amount of agarose that is left in the syringe during submerging of the samples. In the case of air bubbles in the dish with the samples, carefully pull air bubbles back into the syringe.
4. Placing the samples on cutting tray
- Remove the solidified agarose containing the sample(s) from the 35 mm Petri dish using a spatula or similar tool, by wedging it in-between the sample and the side of the Petri dish. Cut away some of the agarose using a scalpel while keeping the samples covered.
CAUTION: Do not remove too much of the agarose. There should be at least 5 mm of agarose left on the long and short sides in the X/Z plane.
NOTE: Steps 4.2-4.4 need to be performed in rapid succession (i.e., maximum of 5 s). Have all required tools within reach prior to starting. No repositioning of the sample is possible after placement. Try to limit the exposure of the glue to air and moisture. Contact with air or fluids will solidify the glue, making it unusable. - With a pipette, place and distribute 60 µL of glue in and around the center of the cutting platform.
- Place the epicardial side of the sample contained in agarose on top of the glued area using tweezers. Do not reposition. The endocardial side of the sample must be visible in the agarose. Let the glue solidify for 1 min. Gently press the agarose containing the sample from the top with a blunt tool (e.g., tweezers) while preventing cutting into or damaging the agarose.
- Place the sample platform in its designated position in the cutting tray of the vibratome, filled with slicing buffer.
5. Starting the vibratome
- Set vibration amplitude to 1 mm and the initial cutting speed to 0.07 mm/s. Set the thickness of the slice to 300 µm to cut slices.
- As long as the blade only cuts the agarose, increase the cutting speed to its maximum, which in this case is 1.50 mm/s. As soon as the vibratome starts cutting the tissue, decrease the speed to 0.07 mm/s immediately.
NOTE: If the tissue is not sliced smoothly, for example if there are large fibrotic areas in the sample, it may help to increase the cutting amplitude up to 1.5 mm and to reduce the cutting speed to 0.04 mm/s.
6. Medium and incubator preparation during slicing procedure
- Fill each cultivation chamber with 2.4 mL of complete cultivation medium (Table 3).
- Place the cultivation chambers filled with medium on the cultivation system in the incubator set at 37 °C, 5% CO2, 21% O2, and a humidity of 80%. Equilibrate the medium for at least 20 min.
- Connect the cultivation system with a computer and start the corresponding software program.
- Set the rocker speed to 60 rpm and preset the stimulation parameters (stimulation pulses and frequency). For human cardiac slices, set the standard stimulation to biphasic impulses with 50 mA current, each consisting of 3 ms positive current, a 1 ms pause and a 3 ms pulse of inverted current, at a pacing rate of 30 beats per min (BPM).
NOTE: In well preserved tissues, the typical stimulation threshold is around 15 mA. To ensure reliable stimulation and to account for any possible increase of the stimulation threshold, it is recommended to set current to a value that exceeds the stimulation threshold by two- to three-fold. - Check the electrode indicators of the software to verify that the electrodes of the cultivation chambers are working correctly.
NOTE: Action is needed whenever the channel indicator in the cultivation software turns red. In this case, the bipolar pulse charges are not balanced.
7. Preparing the slices
NOTE: Initial subendocardial slices are commonly not suitable for tissue cultivation and need to be discarded because of uneven morphology. After the first five to 10 slices, slice texture and morphology improve. The ideal slice is at least 1 cm x 1 cm, has no or only limited fibrotic patches, is not fragmented, and has homogeneous fiber alignment (Figure 2B, D). Interstitial fibrosis, located between the myocyte fibers, is often present in failing human myocardium. Surprisingly, this is not a negative predictor of cultivation success.
- Pour an adequate amount of cold slicing buffer in a 5 cm Petri dish lid to ensure slices will not dry out. Place the slices in the Petri dish lid containing the cold slicing buffer.
- Separate the agarose from the tissue by using tweezers. Prevent touching the tissue. Handle the tissue carefully as any damage to the tissue will reduce the success rate of the cultivation.
- Determine the direction of the myocardial fibers by close inspection against a light source. This is of importance when attaching the plastic triangles to the tissue in step 7.6.
NOTE: Steps 7.4 and 7.5 need to be performed in quick succession, within 5 s. - Attach two plastic triangles to a sample using glue in order to anchor the tissue inside the cultivation chambers.
- Place 1 µL of glue on a sterile Petri dish lid. Use a hooked tweezer to pick up one of the autoclaved plastic triangles. Quickly dip the front edge of the triangle into the glue and paste the triangle onto the sample, perpendicular to the cardiomyocyte alignment. Repeat for the other triangle.
- Trim off tissue exceeding the triangle width with a scalpel (Figure 2C). Place the slice with the two mounted triangles back into the cutting tray's slicing buffer.
NOTE: Repeat steps 7.2 to 7.5 until enough slices are prepared to fill the cultivation chambers. We recommend preparing a few additional slices to allow for the replacement of slices with poor contraction.
8. Mounting the slices
NOTE: The afterload is determined by the stiffness of the spring wire in the cultivation chambers. Three different types are available, based on the thickness of the spring wire.
- Take a medium-filled cultivation chamber from the incubator. Select one of the prepared slices and insert it into the chamber by connecting one triangle to each pin.
- Adjust the distance between the mounting pins according to the sample size. Make sure the sample is submerged in medium. Place the chamber back into its designated socket of the cultivation system in the incubator.
CAUTION: Do not overstretch the tissue and do not over-bend the spring wire! - Set the preload tension after placement of the dish onto the rocker.
- Decrease the preload by turning the adjusting screw counterclockwise. Do this until the baseline of the corresponding graph on the computer screen does not change anymore.
- Carefully increase the preload (i.e., increase the tension) by turning the adjusting screw clockwise. For the chambers with the highest stiffness, continue until the corresponding baseline in the graph has increased by 1000-1200 units, which corresponds to 1 mN of preload.
NOTE: The exact adjustment will depend on the individual spring constant of a cultivation chamber, which can be determined by calibration prior to an experiment according to the manufacturer's instructions. The recording software permits consideration of the individual chamber calibration so that forces will uniformly be displayed in µN. It is recommended to apply electrical stimulation from the start of the cultivation. As such, it is well possible that the slice starts contracting during the preload adjustment. In this case, focus on the diastolic baseline to assess the preload.
9. Changing the medium
- Prepare cultivation medium according to the recipe in Table 3. Shortly before use of the medium, add 50 µL of β-mercaptoethanol (50 mM) to a 50 mL tube. Store at 4 °C.
- Once every 2 days, partly exchange the cultivation medium. Refresh the medium every 2 days, if long term cultivation of the myocardial slices is desired.
- Pre-warm the fresh medium in a water bath or hot-air incubator at 37 °C for 30-45 min. Remove a cultivation chamber from the incubator and place it under a laminar flow hood.
CAUTION: It is essential to keep the chamber, as well as the medium, warm at 37 °C (> 35 °C) to prevent hyper contractures due to low temperature. Less distinct damage may be present as an increase of diastolic tension within a few hours after medium exchange. This may seem to recover, but repeated stress might result in accumulating deterioration. - Remove medium from the cultivation chamber, leaving approximately 0.8 mL in the chamber. Add 1.6 mL of fresh medium to the same chamber. The total volume of medium should be around 2.4 mL per chamber.
- Place the cover of the chamber back and place the cultivation chamber back into its respective position.
Results
The contraction of the myocardial slices was displayed on the computer screen after insertion of the cultivation chamber into its corresponding connector (Figure 3). Contraction of the human myocardial slices started immediately upon stimulation. The slices hypercontracted for 5-10 min. This was visible as an increase of diastolic forces, caused by a tonic contracture of damaged tissue fractions. This process was reverted to varying degrees within 1-1.5 h. After stabilizing, human LV tissue slices showed twitch forces varying between 1 mN and 3 mN upon stimulation. Systole is shown as a strong increase in contraction force, followed by diastole with an equally steep decrease of the contraction force.
Contraction of the myocardial slices was recorded by the cultivation software and saved in a designated file. Each of the generated raw data files were converted to a readable Axon binary file format (.abf) for easy analysis and quantification of the data. For the initial analysis, the .abf file was opened in an appropriate program. Approximately 5 min of contraction data was selected to establish the average contraction amplitude during this period. This was done for multiple time points in the recorded data file. Plotting these contraction values over time yielded a useful graph to compare contraction development in a control and experimental setting. To gain a more advanced insight into the performance of the generated slices, stimulation protocols were run. During these protocols, which take approximately 45 min, the stimulation parameters were altered to assess parameters of contraction coupling.
The current stimulation protocol consisted of four distinct sections: post-pause-potentiation, stimulation threshold, force-frequency relation, and refractory period (Figure 4, Table 4). During the post-pause-potentiation, stimulation is resumed after a brief halt of either 3, 12, 50, or 120 s. To determine the stimulation threshold, the stimulation current is increased in steps of 3 mA every 10 s, starting at 8 mA and increasing to 90 mA. With this test, the minimal stimulation current can be determined for each slice. This does not alter the general stimulation settings outside of the stimulation protocol. The force-frequency relation is assessed by a stepwise increase of the stimulation frequency (20, 30, 45, 60, 80, 100, 120, 150, 180, 210, and 240 BPM), while the respective duration of each step is shortened in parallel. Except for the first two frequency settings, this regimen yields between 20-40 contractions during each step. The refractory period of each slice is assessed by sending a premature stimulus (S2) after a normal stimulus (S1; 30 BPM). The S1-S2 interval is shortened every 10 s.
To demonstrate the potential of the presented cultivation system as a tool for testing pharmacological interventions, ex vivo human LV tissue slices were prepared from the same patient and subjected to pharmacological agents that influence the intracellular calcium ion (Ca2+) levels (n = 1) after 2 weeks of cultivation. The L-type Ca2+-channel antagonist nifedipine inhibits Ca2+ influx into the myocardial cells and therefore lowers the intracellular availability of Ca2+ and reduces the contractility17. Because of its vasodilator action, nifedipine is used as an anti-hypertensive drug. To demonstrate pharmacological differences of Ca2+-channel antagonists, calciseptine was investigated for comparison. Calciseptine is also an L-type Ca2+-channel antagonist, extracted from the Dendroaspis p. polylepis venom18. Therefore, it shares the negative inotropic action of nifedipine. However, calciseptine has different binding characteristics and is more potent compared to nifedipine19. In order to study the positive and negative modulations of Ca2+ availability, we also tested the calcium channel agonist Bay-K8644 (1,4-Dihydro-2,6-dimethyl-5-nitro-4-(2-[trifluoromethyl]phenyl)pyridine-3-carboxylic acid methyl ester)20.
Three slices were treated with nifedipine (125 nM), calciseptine (70.8 nM), and Bay-K8644 (417 nM) respectively, while the fourth slice received no drug (control). The contraction forces under general stimulation parameters (50 mA current, biphasic pulses 3 ms duration, 1 ms interval, and 30 BPM pacing rate) were compared before and after treatment. Furthermore, before the treatment, a stimulation protocol was run to assess the baseline values for post-pause-potentiation, stimulation threshold, force-frequency relation, and refractory period. After 30 min of treatment, a second stimulation protocol was run. To eliminate inter-individual differences, contraction amplitude of each slice was normalized to its baseline level before treatment. The baseline (i.e., 100%) was determined by analyzing the last five contraction cycles before the start of the pre-treatment stimulation protocol.
When analyzing the contraction of the slices at general stimulation, it was observed that the contraction force of the slices treated with Ca2+ antagonists (nifedipine and calciseptine) decreased within 10 min post-treatment (Figure 5) and the effect was present up to 20 min post-treatment. In contrast, the voltage gated Ca2+ channel agonist Bay-K8644 increased the contraction force of the treated slice. The control slice did not show a noteworthy change. The contraction data generated during the stimulation protocols were analyzed in a similar way. Here, the data generated by the stimulation protocol performed before the treatment (pre-treatment) was compared to the post-treatment data of the same stimulation protocol.
As discussed before, the stimulation protocol started with the assessment of the post-pause-potentiation. During the pause, additional Ca2+ is taken up by the sarcoplasmic reticulum (SR), which is released upon first stimulation after the pause. Hence, post-pause-potentiation reflects intracellular Ca2+ release from the SR. As such, this parameter can be used to assess the relative contribution of Ca2+ released from the SR by the ryanodine receptor. To assess the potentiation of the slices after a stimulation pause, the strength of the first contraction after the pause was divided by the average contraction before the respective pause. The control slice did not show any noteworthy change (Figure 6A). It was observed that the inhibition of the L-type Ca2+ channels led to potentiation of the first contraction after a pause of at least 50 s (Figure 6B,D), reflecting a higher relative contribution of intracellular Ca2+ release to total contractility. The opposite effect was seen in the slice treated with Bay-K8644, which stimulates the entry of extracellular Ca2+ via the L-type Ca2+ channels (Figure 6C).
The force-frequency relation was assessed by successively increasing the pacing rate up to 180 BPM. For better visualization, the contraction force at different stimulation frequencies was normalized to the baseline contraction at 30 BPM within the same protocol (=100%). Data analysis showed that the treatment with calciseptine did not change the ability of the slice to follow the stimuli upon increase of the stimulation frequency when comparing the pre- and post-treatment data (Figure 7B). No change was observed in the control slice (Figure 7A). Contrary to calciseptine, nifedipine prevented an increase of contractility at higher pacing rates and reduced the maximum capture rate to 80 BPM (Figure 7D). The slice treated with the Ca2+ channel agonist Bay-K8644 showed an increased contraction force at very low stimulation frequencies (Figure 7C). However, at frequencies higher than 50 BPM, the contraction force appeared to be lower than during the pre-treatment condition. The stimulation threshold and the refractory period were also determined pre- and post-treatment. However, no differences were observed, and the data are therefore not shown.
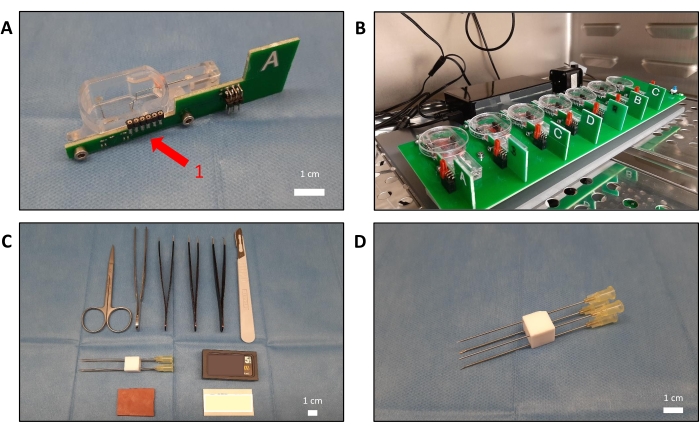
Figure 1: Overview of the required materials and the cultivation system. (A) An empty cultivation chamber connected to a green circuit board. The circuit board (1) measures the contraction with a sensor and transmits the data to the controller. (B) Eight filled chambers placed on the rocking main plate. Petri dish lids (35 mm) are used to cover the chambers. (C) The (surgical) tools needed to trim the transmural myocardial sample. Depicted are various tweezers, the blades needed for the vibratome, and a rubber patch to aid in trimming. (D) Four 0.9 mm x 70 mm 20 G needles that are fixed in a square position (0.9 cm x 0.9 cm) by a solid block of plastic. Using this construct prevents damage and movement of the sample when trimming and yields a tissue block with the required dimensions. Please click here to view a larger version of this figure.
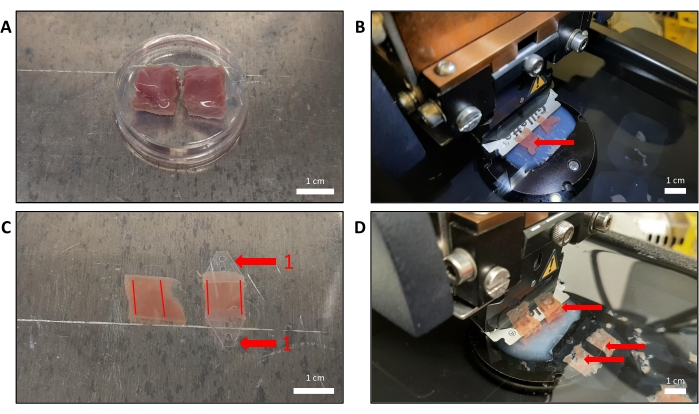
Figure 2: Processing of two LV samples. (A) Two myocardial tissue blocks (approximately 1 cm x 1 cm x 1 cm) embedded in solidified low-melt agarose in a 35 mm Petri dish. For demonstration purposes, porcine LV tissue was used. (B) The agarose block with the embedded samples was removed from the Petri dish, trimmed, and glued onto the cutting platform of the vibratome. Here, porcine LV tissue was used for demonstration purposes. Notice the uniform tissue color and the absence of white fibrotic tissue, indicated by the red arrow. (C) After slicing, the agarose is carefully removed, and plastic triangles (1) are connected perpendicular to the direction of the myocardial fibers. The red lines indicate the direction of the myocardial fibers. (D) Human LV tissue was prepared, which showed white fibrotic tissue within the slices. This does not necessarily lower the success rate of cultivation; however it is recommended to use slices that do not display fibrosis. Please click here to view a larger version of this figure.
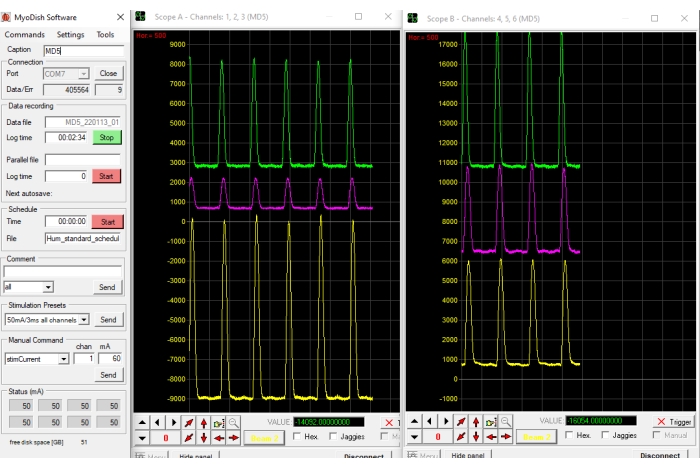
Figure 3: The cultivation software. Depending on the number of channels used (maximum of eight), the contraction registration will be visualized in up to three designated windows (two visible in the figure). Each cultivation chamber is displayed as one contraction graph. In the settings window, stimulation parameters can be altered and tailored to the desired experimental situation. This window also allows to start or stop the stimulation protocol/schedule that is selected. Please click here to view a larger version of this figure.
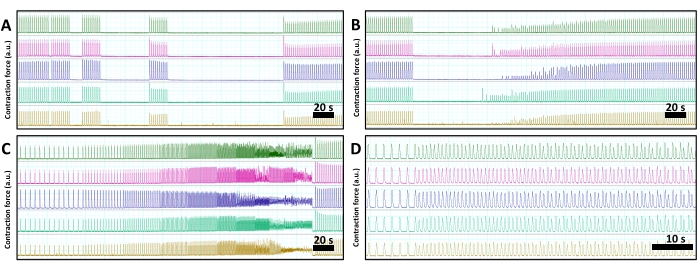
Figure 4: Read-out of the contraction of five myocardial slices during a typical stimulation protocol. In all panels, each individual slice is shown in the same color. (A) Post-pause-potentiation assesses the first contraction after a brief stimulation pause of 3, 12, 50, and 120 seconds respectively. (B) Determination of the stimulation threshold by increasing the stimulation current in steps of 3 mA every 10 s from 8 mA to 80 mA. (C) The force-frequency relation of each slice is assessed by stepwise increases of the stimulation frequency from 12 BPM to 240 BPM. The duration of stimulation periods becomes shorter at higher frequencies to keep the number of beats constant at each frequency. (D) To assess the refractory period, the slices are exposed to premature stimulations (S2) at decreasing intervals to the preceding stimulus (S1). Please click here to view a larger version of this figure.
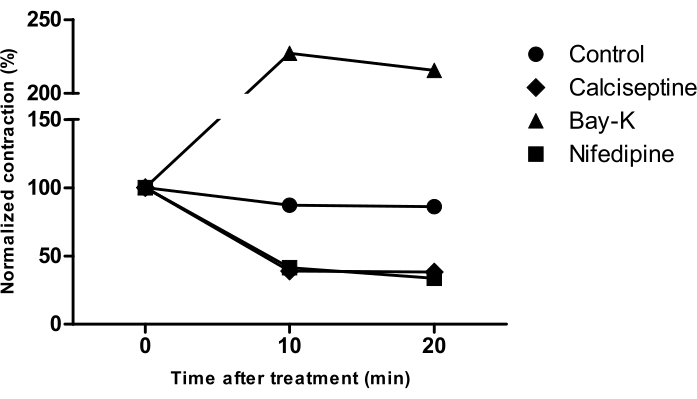
Figure 5: Analysis of contraction force before and after treatment with L-type Ca2+ channel affecting agents. All data (n = 1) were normalized to the baseline contractility (mean of five separate beats before treatment (0)). L-type Ca2+ channel antagonists nifedipine (125 nM), calciseptine (70.8 nM), and L-type Ca2+ channel agonist Bay-K8644 (417 nM) were added to contracting human LV myocardial slices. The control slice received no treatment. Please click here to view a larger version of this figure.
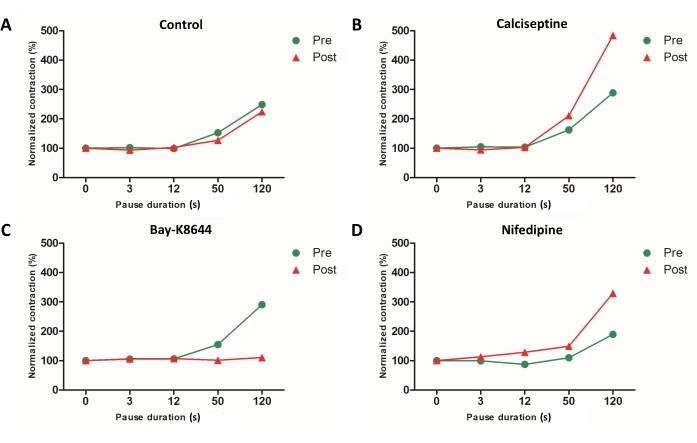
Figure 6: Post-pause-potentiation of the treated and control slices. Differences in post-pause-potentiation were observed (baseline vs post-treatment; n = 1). Here, the amplitude of the first contraction after a pause was normalized to the average contraction amplitude before the respective pause. Baseline was set as 100% and resembles the average contraction strength of the last five cycles before the first pause commences. The Y-axis displays the normalized first contraction after a pause of various durations. The X-axis shows the baseline and pause lengths. (A) Control slice without treatment. (B) Calciseptine treatment. (C) Bay-K8644 treatment. (D) Nifedipine treatment. Please click here to view a larger version of this figure.
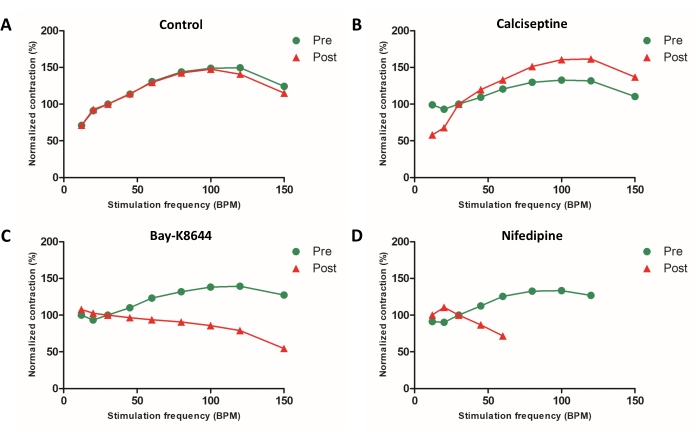
Figure 7: Analysis of the force frequency relation. Contraction data (n = 1) was normalized to the contraction force at 30 BPM within the respective protocol (= 100%). (A) The control slice was not treated with any substance; however, all other aspects of the cultivation were the same as those of the treated slices. (B) Calciseptine treatment of one LV myocardial slice. (C) Bay-K8644 treatment. (D) Nifedipine treatment. Data about the contraction force of this slice during stimulation frequencies above 80 BPM were omitted, as the contraction was not following the stimulation frequency. Please click here to view a larger version of this figure.
Table 1: Composition of the slicing buffer used for transport and during the slicing procedure. For the preparation of agarose, glucose is omitted. Please click here to download this Table.
Table 2: Composition of the 4% agarose gel. This glucose-free low-melt agarose gel is used for embedding of the tissue samples. Please click here to download this Table.
Table 3: Preparation of the medium for cultivation. Please click here to download this Table.
Table 4: Details of the stimulation protocol. The stimulation protocol consists of four parts, which all can be altered to suit the needs of the project. Please click here to download this Table.
Discussion
In the past, cardiovascular research has made great advances in the cultivation of cardiomyocytes. However, the 3D cultivation of cardiomyocytes with intact geometry is not yet well-established. Compared to previous protocols applied for ex vivo cultivation of myocardial tissue, the protocol that we described here resembles the in vivo environment of the tissue more closely. Moreover, the application of pre- and afterload allows for a more biomimetic environment. We are able to fully analyze and understand the continuous recording of the contraction data and contraction parameters of the tissue.
The number of ex vivo cardiovascular tissue cultivation techniques using similar set-ups are limited11,21,22. A similar technique for myocardial slice cultivation that has been published uses a 6-well plate for the cultivation of myocardial slices10. However, an important limitation of this particular set-up is that the slices are not exposed to pre- and afterload, nor is it able to yield a detailed view of the contraction over time without the need for handling the tissue. The method we described here reduces the risk of tissue damage or infection. Furthermore, it gives a comprehensive view of the possible changes in contractile force whenever a substance of interest is added to the cultivation. In addition to the analysis of the normal contraction force of each slice, the current set up allows to regularly run pre-defined protocols. This allows the data collection of different relevant parameters of the cultivated tissue.
Critical steps within the protocol
Tissue damage must be avoided, and this can already occur during the explant surgery. If the tissue is not immediately transferred to the cold storage solution after excision, this may result in damaged tissue samples. The described protocol contains several steps that are critical to obtain reliable and reproducible results. The agarose tissue embedding compound must be prepared using the slicing buffer without glucose, to prevent possible caramelization of the glucose during the melting process before the start of the protocol. It is important to avoid damage due to hyperthermia caused by using agarose directly from the 80 °C water bath, instead of incubating the agarose in a syringe at 37 °C. Temperature should be 4 °C during storage and cutting to reduce metabolism and minimize ischemia. Also, tissue should be handled with care, by grabbing the agarose rather than the tissue itself, when moving it between the cutting tray and Petri dish to attach the plastic triangles. It is of utmost importance that these triangles are attached in the proper direction with respect to the direction of the myocardial fibers. Misalignment of the triangles will result in tissue damage.
In general, the stimulation threshold of newly cut slices is between 10-20 mA, and the current should be carefully increased. Overstimulation of the tissue by a current that is too high can lead to irreversible sample damage as well. Once stimulation has started, tissue agitation by rocking the cultivation chambers is necessary, and should never be halted for longer than 5 min to ensure adequate availability of oxygen and nutrients to the tissue.
Troubleshooting and modifications
Hyper contracture
Hyper contracture of the myocardial tissue sample is one of the main exclusion criteria for the discussed protocol. This can occur before and after the preparation of the myocardial slices. In cases where, before the preparation, the tissue felt stiff upon palpation, hypercontraction was observed in at least 70% of the preparations. Hyper contracture of the tissue sample may also occur upon insertion on the rocker, which likely depends on the quality of the tissue or the disease state of the patient. Hyper contracture can be seen as an increase of diastolic tone during the stimulation of the tissue, corresponding to the tonic shortening of damaged cardiomyocytes in cardiac ischemia. Hyper contracture during stimulation can be progressive, whereby the contraction exceeds the detection limit of 12 mN. However, the hyper contracture may also reverse spontaneously within 30-60 min, suggesting that the tissue can recover. To improve the recovery of the tissue, the preload settings should be readjusted (i.e., repeat step 8.3) after 1 h of incubation, as well as on days 2, 4, and 6 after preparation. Hyper contracture may be present both with and without the stimulated contraction of the samples. Yet, if no contraction is observed within 1 h, the sample should not be used. In this case, the tissue has hypercontracted to a degree from which it cannot recover or has been damaged otherwise. In general, the cultivation of human myocardial slices according to the presented protocol, has shown to have a success rate of 90%.
Expected contraction force changes
Depending on a multitude of factors (e.g., patient, preparation, tissue damage), it is possible that myoslices that showed acceptable contraction initially, will undergo a progressive decline in contractile amplitudes during the first 24 h. In fact, this behavior can even be considered normal for slices obtained from human end-stage failing hearts. Readjusting the preload of the slices each day for the following 3 days has been found to alleviate this problem and improve the contraction. After 24 to 48 h, however, the contractility should start to increase again. Note that the contraction will not return to its initially observed level within the first days of cultivation.
Shortly after medium exchange, when the samples are returned to the incubator, the contraction typically shows markedly increased amplitudes. Opening and closing of the incubator contributes to this increase, as it causes the CO2 level to drop. This increases the pH inside the bicarbonate-buffered cultivation medium, which causes a positive inotropic response of the slices. Following the medium exchange, the contractile force of the slices often decreases for several hours until it reaches or surpasses its initial value. To prevent stimulation protocols being affected by medium exchange, stimulation protocols should not be executed until at least 1 h after medium exchange.
Limitations of the method
An advantage of the present technique as compared to earlier cultivation methods for human myocardial tissue, is the possibility to apply (and modulate) pre- and afterload to the contracting tissue. However, it is difficult to quantify the applied load in terms of wall tension, although this load could be estimated from the spring constant and the slice dimensions. It is assumed that there is a positive relation between the viability of myocardial tissue and the contraction amplitude of tissue sample. Yet there currently is no method that allows viability testing of each individual slice before mounting it to the chambers. A colorimetric MTT staining can be performed on cut slices that are not used for cultivation, to determine the viability of the myocardial cells. In cells that are viable, NADPH will reduce the yellow MTT salt in purple formazan crystals. Another limitation is that currently, the nutrients in the cultivation medium are limited to basic ingredients. Hence, nutrients and circulating factors are different from the in vivo environment from which the tissue was obtained. However, medium can be supplemented or modified as needed.
Potential applications of the method
There are several potential applications of the method both in terms of cardiotoxicity and drug testing, as well as in understanding the pathophysiology of heart disease. First, the system used in the discussed protocol can be used for drug and cardiotoxicity screenings. With the help of the programmable stimulation protocols, physiological changes can be analyzed in response to drug administration. In regard to the interpretation of refractory period, it needs to be considered that this is a functional parameter, which does not strictly reflect the effect of drugs on action potential duration. Second, the cultivation chambers can be utilized for various co-cultivation experiments of myocardium in combination with immune cells. By using this co-cultivation, the direct effects of immune cell secreted factors on the myocardial contraction can be assessed. Finally, non-transplant cardiomyopathy samples can also be cultivated, although these non-transplant tissue samples are generally smaller and therefore more difficult to process. Nevertheless, this may open up possibilities for the identification of novel therapeutic targets and the development of targeted medications. It is also conceivable to use the technique for patient specific tissue characterization, bringing us one step closer to personalized medicine. Furthermore, the presented method can be used for non-human myocardial tissue, examples of which are pig and rabbit. It has to be considered, that the high physiological heart rate of small mammals (mouse/rat) cannot be obtained, because the subsequent higher O2 requirement cannot be satisfied under the conditions of myocardial cultivation using the discussed set up. Thereby, a near-physiological environment is hard to mimic in these cases.
Disclosures
JH, PS, DM, and KL have nothing to disclose. AD and TS are shareholders of InVitroSys GmbH, which provides the Myodish cultivation system.
Acknowledgements
Research was funded by DZHK grants 81Z0600207 (JH, PS, and DM) and 81X2600253 (AD and TS).
The authors would like to thank Claudia Fahney, Mei-Ping Wu, and Matthias Semisch for their support in preparing the set-ups, as well as for the regular maintenance of the tissue cultivation.
Materials
| Name | Company | Catalog Number | Comments |
|---|---|---|---|
| Chemicals | |||
| Agarose Low melting point | Roth | 6351.2 | |
| Bay-K8644 | Cayman Chemical | 19988 | |
| BDM (2,3-Butanedione monoxime) | Sigma | B0753-1kg | |
| CaCl2*H2O | Merck | 2382.1 | |
| Calciseptine | Alomone Labs | SPC-500 | |
| Glucose*H2O | AppliChem | A3730.0500 | |
| H2O | BBraun | 3703452 | |
| HEPES | AppliChem | A1069.0500 | |
| Histoacryl | BBraun | 1050052 | |
| Isopropanol 100% | SAV LP GmbH | UN1219 | |
| ITS-X-supplement | Gibco | 5150056 | |
| KCl | Merck | 1.04933.0500 | |
| Medium 199 | Gibco | 31150-022 | |
| MgCl2*6H2O | AppliChem | A1036.0500 | |
| NaCl | Sigma | S5886-1KG | |
| NaH2PO4*H2O | Merck | 1.06346.0500 | |
| Nifedipine | Sigma | N7634-1G | |
| Penicillin / streptomycin x100 | Sigma | P0781-100ML | |
| β-Mercaptoethanol | AppliChem | A1108.0100 | |
| Laboratory equipment | |||
| Flow cabinet | Thermo Scientific | KS15 | |
| Frigomix waterpump and cooling + BBraun Thermomix BM | BBraun | In-house made combination of cooling and heating solution. | |
| Incubator | Binder | CB240 | |
| MyoDish culture system | InVitroSys GmbH | MyoDish 1 | Myodish cultute system |
| Vibratome | Leica | VT1200s | |
| Water bath 37 degrees | Haake | SWB25 | |
| Water bath 80 degrees | Daglef Patz KG | 7070 | |
| Materials | |||
| 100 mL plastic single-use beaker | Sarstedt | 75.562.105 | |
| Filtration unit, Steritop Quick Release | Millipore | S2GPT05RE | |
| Needles 0.9 x 70 mm 20G | BBraun | 4665791 | |
| Plastic triangles | In-house made | ||
| Razor Derby premium | Derby Tokai | B072HJCFK6 | |
| Razor Gillette Silver Blue | Gillette | 7393560010170 | |
| Scalpel disposable | Feather | 02.001.30.020 | |
| Syringe 10 mL Luer tip BD Discardit | BBraun | 309110 | |
| Tissue Culture Dish 10 cm | Falcon | 353003 | |
| Tissue Culture Dish 3.5 cm | Falcon | 353001 | |
| Tubes 50 mL | Falcon | 352070 |
References
- George, S. A., Brennan, J. A., Efimov, I. R. Preclinical cardiac electrophysiology assessment by dual voltage and calcium optical mapping of human organotypic cardiac slices. Journal of Visualized Expereiments: JoVE. (160), e60781(2020).
- Lu, K., et al. Progressive stretch enhances growth and maturation of 3D stem-cell-derived myocardium. Theranostics. 11 (13), 6138-6153 (2021).
- Pontes Soares, C., et al. 2D and 3D-organized cardiac cells shows differences in cellular morphology, adhesion junctions, presence of myofibrils and protein expression. PloS one. 7 (5), 38147(2012).
- Klumm, M. J., et al. Long-term cultivation of human atrial myocardium. Frontiers in Physiology. 13, 839139(2022).
- Krane, M., et al. Sequential defects in cardiac lineage commitment and maturation cause hypoplastic left heart syndrome. Circulation. 144 (17), 1409-1428 (2021).
- Miller, J. M., et al. Heart slice culture system reliably demonstrates clinical drug-related cardiotoxicity. Toxicology and Applied Pharmacology. , 406(2020).
- Fischer, C., et al. Long-term functional and structural preservation of precision-cut human myocardium under continuous electromechanical stimulation in vitro. Nature Communications. 10 (1), 1-12 (2019).
- Kang, C., et al. Human organotypic cultured cardiac slices: new platform for high throughput preclinical human trials. Scientific Reports. 6 (1), 1-13 (2016).
- Ou, Q., et al. Slicing and culturing pig hearts under physiological conditions. Journal of Visualized Experiments: JoVE. (157), e60913(2020).
- Ou, Q., et al. Physiological biomimetic culture system for pig and human heart slices. Circulation research. 125 (6), 628-642 (2019).
- Watson, S. A., et al. Biomimetic electromechanical stimulation to maintain adult myocardial slices in vitro. Nature Communications. 10 (1), 1-15 (2019).
- Abu-Khousa, M., et al. The degree of t-system remodeling predicts negative force-frequency relationship and prolonged relaxation time in failing human myocardium. Frontiers in Physiology. 11, 182(2020).
- Bojkova, D., et al. SARS-CoV-2 infects and induces cytotoxic effects in human cardiomyocytes. Cardiovascular Research. 116 (14), 2207-2215 (2020).
- Esfandyari, D. A. -O., et al. MicroRNA-365 regulates human cardiac action potential duration. Nature Communications. 13 (1), 1-15 (2022).
- Moretti, A., et al. Somatic gene editing ameliorates skeletal and cardiac muscle failure in pig and human models of Duchenne muscular dystrophy. Nature Medicine. 26 (2), 207-214 (2020).
- Pitoulis, F. G., et al. Remodelling of adult cardiac tissue subjected to physiological and pathological mechanical load in vitro. Cardiovascular Research. 118 (3), 814-827 (2021).
- Curtis, T. M., Scholfield, C. N. Nifedipine blocks Ca2+ store refilling through a pathway not involving L-type Ca2+ channels in rabbit arteriolar smooth muscle. The Journal of Physiology. 532 (3), 609-623 (2001).
- de Weille, J. R., Schweitz, H., Maes, P., Tartar, A., Lazdunski, M. Calciseptine, a peptide isolated from black mamba venom, is a specific blocker of the L-type calcium channel. Proceedings of the National Academy of Sciences. 88 (6), 2437-2440 (1991).
- Schleifer, K. J. Comparative molecular modelling study of the calcium channel blockers nifedipine and black mamba toxin FS2. Journal of Computer-Aided Molecular Design. 11 (5), 491-501 (1997).
- Thomas, G., Chung, M., Cohen, C. J. A dihydropyridine (Bay-K8644) that enhances calcium currents in guinea pig and calf myocardial cells. A new type of positive inotropic agent. Circulation Research. 56 (1), 87-96 (1985).
- Pitoulis, F. G., Watson, S. A., Perbellini, F., Terracciano, C. M. Myocardial slices come to age: an intermediate complexity in vitro cardiac model for translational research. Cardiovascular Research. 116 (7), 1275-1287 (2020).
- Watson, S. A., et al. Preparation of viable adult ventricular myocardial slices from large and small mammals. Nature Protocols. 12 (12), 2623-2639 (2017).
Reprints and Permissions
