This protocol outlines the generation of human immune system (HIS) mice for immuno-oncology studies. Instructions and considerations in the use of this model for testing human immunotherapeutics on human tumors implanted in this model are presented with an emphasis on characterizing the response of the human immune system to the tumor.
A subscription to JoVE is required to view this content. Sign in or start your free trial.
Method Article
Testing Cancer Immunotherapeutics in a Humanized Mouse Model Bearing Human Tumors
* These authors contributed equally
In This Article
Erratum Notice
Important: There has been an erratum issued for this article. View Erratum Notice
Summary
Abstract
Reversing the immunosuppressive nature of the tumor microenvironment is critical for the successful treatment of cancers with immunotherapy drugs. Murine cancer models are extremely limited in their diversity and suffer from poor translation to the clinic. To serve as a more physiological preclinical model for immunotherapy studies, this protocol has been developed to evaluate the treatment of human tumors in a mouse reconstituted with a human immune system. This unique protocol demonstrates the development of human immune system (HIS, "humanized") mice, followed by implantation of a human tumor, either a cell-line derived xenograft (CDX) or a patient derived xenograft (PDX). HIS mice are generated by injecting CD34+ human hematopoietic stem cells isolated from umbilical cord blood into neonatal BRGS (BALB/c Rag2-/- IL2RγC-/- NODSIRPα) highly immunodeficient mice that are also capable of accepting a xenogeneic tumor. The importance of the kinetics and characteristics of the human immune system development and tumor implantation is emphasized. Finally, an in-depth evaluation of the tumor microenvironment using flow cytometry is described. In numerous studies using this protocol, it was found that the tumor microenvironment of individual tumors is recapitulated in HIS-PDX mice; "hot" tumors exhibit large immune infiltration while "cold" tumors do not. This model serves as a testing ground for combination immunotherapies for a wide range of human tumors and represents an important tool in the quest for personalized medicine.
Introduction
Mouse cancer models are important for establishing basic mechanisms of tumor growth and immune escape. However, cancer treatment studies in mouse models have yielded finite translation to the clinic due to limited syngeneic models and species-specific differences1,2. The emergence of immune therapies as a dominant approach to control tumors has reiterated the need for an in vivo model with a functional human immune system. Advancements in human immune system mice (HIS mice) over the past decade have made it possible to study immuno-oncology in vivo in a wide variety of cancer types and immunotherapeutic agents3,4,5,6. Human tumor models, including cell-line derived and patient-derived xenografts (CDX and PDX, respectively), grow well in HIS mice and in most cases are nearly identical to their growth in the immunodeficient host lacking human hematopoietic engraftment7,8. Based on this key finding, researchers have been using the HIS mouse model to study human immunotherapies, including combination therapies designed to alter the tumor microenvironment (TME) to decrease immunosuppression and thus enhance immune-directed tumor killing. These preclinical models help address the issues of heterogeneity of human cancers, and can also predict treatment success as well as monitor immune related drug toxicities9,10.
The production of a mouse model with a human immune system through the introduction of human hematopoietic stem cells requires a recipient immunodeficient mouse that will not reject the xenograft. Current HIS mouse models are derived from immunodeficient mouse strains that were reported over 30 years ago. The first immunodeficient mouse strain described was SCID mice that lacked T and B cells11, followed by a hybrid NOD-SCID with an SIRPα polymorphism responsible for mouse macrophage tolerance to human cells, due to increased binding for the NOD SIRPα allele to the human CD47 molecule12,13. In the early 2000s, the deletion of the common gamma chain of the IL-2 receptor (IL-2Rγc) on both BALB/c and NOD immunodeficient strains was a game changer for enhanced human engraftment, due to genetic deletions forbidding host NK cell development14,15,16,17. Alternative models, such as BRG and NRG mice, achieve T and B cell deficiency through deletion of the Rag1 or Rag2 gene, required for T and B cell receptor gene rearrangements and thus the maturation and survival of lymphocytes18,19. The BRGS (BALB/c -Rag2nullIl2RγCnullSirpαNOD) mouse used herein combines the IL-2Rγ chain deficiency and the NOD SIRPα allele on the Rag2-/- background, resulting in a highly immunodeficient mouse without T, B, or NK cells, yet with sufficient vigor and health to allow for long term engraftment of more than 30 weeks13.
HIS mice can be generated in multiple ways, with human PBMC injection being the most direct method15,18,20. However, these mice have a pronounced expansion of activated human T cells that results in graft versus host disease (GVHD) by 12 weeks of age, preventing long-term studies. Alternatively, human hematopoietic stem cells from umbilical cord blood (CB), bone marrow, and fetal liver can also be used for engraftment and production of the human immune system de novo. In this system, the hematopoietic stem cells produce a multi-lineage human immune system with the generation of T, B, and innate immune cells that are importantly tolerant of the mouse host, compared to the PBMC mice that develop mostly T cells. Therefore, GVHD is absent or greatly delayed, and studies can be extended to mice up to 10 months of age. CB provides an easy, accessible, and noninvasive source of CD34+ human hematopoietic stem cells that facilitates the engraftment of multiple HIS mice with genetically identical immune systems17,18,20,21. Over the past few years, HIS mouse models have been used extensively to study immunotherapy and the TME3,4,5,6. Despite the development of human derived immune systems in these mice, human xenograft tumors grow at similar rates compared to the control immunodeficient mice and allow for the complex interplay between the cancer cells and immune cells, which is important for maintaining the microenvironment of the engrafted PDX3,7,8. This protocol has been used to perform over 50 studies testing treatments in HIS-BRGS mice with PDXs and CDXs. An important conclusion is that human tumors in the HIS mice maintain their unique TME as defined by molecular evaluation of the tumor relative to the initial patient sample and immune infiltrate characteristics3,22,23. Our group focuses on in-depth evaluation of the HIS in both immune organs and the tumor using multi-parameter flow cytometry. Herein, we describe a protocol for the humanization of BRGS mice, evaluation of chimerism, implantation of human tumors, tumor growth measurements, cancer treatment administration, and analysis of the HIS cells by flow cytometry.
Access restricted. Please log in or start a trial to view this content.
Protocol
All animal work was performed under animal protocols approved by the University of Colorado Denver Institutional Animal Care and Use Committee (IACUC Protocols #00593 and #00021). All animal work was performed in accordance with the Office of Laboratory Animal Resources (OLAR), an accredited facility by the American Association for Laboratory Animal Care, at the University of Colorado Denver Anschutz Medical Campus. All human cord blood samples were obtained as donations from de-identified donors and are thus not subject to approval by the human research ethics committee.
NOTE: Compositions of all media and solutions mentioned in the protocol are included in Supplemental File 1. Figure 1 illustrates the overall protocol for generation and analysis of immune responses to tumors in HIS-BRGS mice.
1. Generation of HIS mice
- Mouse husbandry of BALB/c -Rag2null Il2RγCnull SirpαNOD (BRGS) mice
NOTE: This strain is extremely immunodeficient, with no T, B, or NK cells. Therefore, rigorous measures must be used to prevent opportunistic infections. Maintain the colony on a diet containing trimethoprim and sulfadiazine on an alternating 2 week schedule with a normal diet. Maintain in the highest level of precaution housing room possible (e.g., a barrier shower-in facility with limited access).- Maintain colonies of BALB/c -Rag2null Il2RγCnull SirpαNOD (BRGS) and BALB/c Rag2null Il2RγCnull SirpaBalb/c (BRG) homozygous mice as breeders.
- Breed BRGSN/N×BRGB/Bto generate BRGSB/N pups, to be used as recipients of human stem cells. In this colony, BRGSB/N are healthier than BRGSN/N, and engraft at equivalent levels (more than BRG).
- CD34+ human stem cell isolation from umbilical CB
NOTE: No antibiotics are used for this procedure. Therefore, good sterile technique is imperative.- Place a 50 mL conical tube rack, as well as 3x 15 mL and ~10x 50 mL conical tubes in a sterilized biosafety cabinet (BSC). Spray a blood collection bag with 70% ethanol and let it dry in the BSC.
- Calculate the number of 50 mL conical tubes required for CB density gradient isolation = CB volume/15, rounded up and to an even tube number. Calculate blood volume per tube = CB volume/number of tubes. Pour blood carefully from the CB bag into each conical tube; this is a maximum of 15 mL per tube. Use an automatic pipettor and a 25 mL serological pipette to mix the blood 1:1 with sterile PBS by pipetting up and down.
- Use an automatic pipettor on low speed and a 10 mL serological pipette to slowly underlay the blood with room temperature (RT) 1.077 g/mL density gradient solution (see Table of Materials) without disturbing the interface. Keep the pipette tip from touching the tube bottom. Repeat for all tubes. Then centrifuge for 30 min at 850 x g, with no braking, at RT to ensure maintenance of the density gradient.
- Visualize the cellular buffy coat on top of the 1.077 g/mL density gradient as a cloudy white layer. Remove and discard the plasma layer down to about 10 mL above the buffy coat using a 25 mL serological pipette and an automatic pipettor.
- Collect the buffy coat with a sterile transfer or serological pipette. Use the pipette like a spatula to scrape the cells off the side of the conical tube while releasing the bulb (or pipetting slowly) to draw the cells up. Combine the buffy coats from two 50 mL conical tubes into one new 50 mL conical tube.
- Wash the cells by pouring 45 mL of sterile HBSS containing 2% FBS into each conical tube. Centrifuge for 11 min at 360 x g at RT.
- Aspirate the wash media down to the pellet in all tubes. Use a 10 mL serological pipette and an automatic pipettor to resuspend the first pellet in 10 mL of HBSS containing 2% FBS. Resuspend each pellet in the same 10 mL of HBSS, and rinse each tube with an additional 10 mL of HBSS to collect all the cells into a single tube.
- Pour 45 mL of sterile HBSS containing 2% FBS in the conical tube. Centrifuge for 10 min at 360 x g, at 4 °C.
- Aspirate the wash buffer down to the cell pellet and resuspend the pellet in 20 mL of magnetic cell separator buffer (see Table of Materials). Remove a small aliquot to count the cells with a hemacytometer at a 1:20 dilution in methylene blue. Add the number of blue and white cells. Centrifuge at 360 x g, for 10 min at 4 °C.
NOTE: This protocol uses magnetic bead technology (see Table of Materials). The protocol can be modified for use with any cell-separation technology, with sufficient purity and yield of the CD34+ stem cells. - Aspirate the supernatant and resuspend the CD34+ cell pellet isolated from cord blood in 300 µL of magnetic cell separator buffer per 1 x 10⁸ cells. Add 100 µL of FcR blocking reagent first, and then 100 µL of CD34+ magnetic beads per 1 x 10⁸ cells. Incubate at 4 °C for 30 min (no ice).
- Add 5 mL of magnetic cell separator buffer per 1 x 10⁸ cells and spin at 360 x g for 10 min at 4 °C. Repeat the wash step and resuspend the pellet in 500 µL of magnetic cell separator buffer per 1 x 10⁸ cells in a 15 mL conical tube labeled "unfractionated".
- Label two more 15 mL conical tubes "CD34-" and "CD34+". Place the three 15 mL conical tubes (unfractionated, CD34-, and CD34+) to slots A1, B1, and C1, respectively, on a cooling rack (see Table of Materials). Separate the cells using the two-column positive selection program on an automatic magnetic cell separator (see Table of Materials) in a BSC, according to the manufacturer's instrument instructions.
- Expanding and freezing CD34+ human stem cells
- Aliquot 10 µL of the recovered CD34+ cell suspension (2 mL) on a hemocytometer slide and count the cells under 10x magnification. Calculate the total number of CD34+ cells by multiplying the cell count by 2 x 10⁴. Divide the total CD34+ cell number by 250,000 to calculate the number of vials to freeze (50,000 cells per mouse pup prior to in vitro expansion).
- Prepare CB medium Iscove's 10% FCS (plus 1 mL extrafor filtering loss), supplemented with 40 ng/mL stem cell factor, 20 ng/mL Flt3L, and 10 ng/mL IL-6, and pass through a 0.22 µm filter. Resuspend the CD34+ cells at 100,000 per mL of CB medium, and incubate at 37 °C. On day 3, add an equivalent volume of CB medium without cytokines to the flask containing the cells and the CB medium with cytokines.
NOTE: Addition of these cytokines to the CB medium promotes survival and expansion of the CD34+ cells while preventing differentiation. - Harvest the expanded CD34+ cells on day 5. Pipette the cell suspension up and down and collect in a 50 mL conical tube. Add enough CB medium to cover the bottom of the flask. Using a cell scraper, scrape the entire bottom of the flask. Collect all the media into the same 50 mL tube, and centrifuge at 360 x g for 11 min.
- Resuspend the cells in 2 mL of CB medium. Save the final drop from the pipette into a 96-well plate for counting. Dilute the cells 1:1 in trypan blue and add 10 µL to the hemacytometer, then count and average cells from four quadrants. Calculate the total number of CD34+ cells by multiplying the cell count by 4 x 10⁴, and record the viability.
- Make n+1 mL of freezing medium, where n is the number of freezing vials calculated in step 1.3.1. Prepare freezing medium by adding 10% (v/v) DMSO to FBS and keep on ice. Label the cryovials with CB#, CD34+ d5, and date.
- Spin down the CD34+ cells at 360 x g for 10 min at 4 °C. Aspirate the medium down to the pellet and resuspend the cell pellet in freezing medium. Aliquot 1 mL of cell suspension to each vial and divide any remainder evenly between the vials. Add the vials to an isopropanol cell freezer chilled to 4 °C, place at -80 °C, and transfer to liquid nitrogen to store for >90 days.
- Irradiation of mouse pups
- Collect the BRGSB/N pups, 1-3 days after birth, into an autoclaved plastic box with padding. Add a small amount of bedding with the pups. Label the box with the cage number and the number of pups.
- Set up the irradiator (see Table of Materials) for a dose of 300 rad. Set the box of pups into the irradiator and expose them to 300 rad. Take the pups back to their cage, place them in a pile, and cover with bedding.
- Pup injections and CD34+ cell preparation
- Begin CD34+ cell preparation ~3 h post irradiation. Warm 10 mL of CB media in a 50 mL conical tube. Perform all steps in a sterile BSC.
- Retrieve one vial of in vitro expanded and frozen CD34+ cells for every four to six pups to inject. Rapidly thaw at 55 °C, until just a small amount of ice is visible, and add the cells to the warmed CB medium (the vial should still be cool to the touch.) Use 1 mL of medium to rinse each vial and spin the cells at 360 x g for 12 min at 4 °C.
NOTE: Rapid thawing at 55 °C was found to yield better cell viability (90%-95%) than thawing at 37 °C. - Aspirate the medium carefully. Resuspend the (small) pellet in 2 mL of CB media, gently mix, and add ~30 µL of the cell suspension to a single well in a counting plate. Dilute 1:1 in trypan blue, then add 10 µL to a hemocytometer and count and average the cells from four quadrants.
- Calculate the total number of CD34+ cells by multiplying the cell count by 4 x 10⁴ and then record the viability. Spin at 360 x g for 12 min at 4 °C.
- Aspirate the medium carefully and resuspend the cell pellet in 100 µL of sterile PBS per n+1 pups to inject, resulting in 250,000-450,000 CD34+ cells per mouse. Place the conical tube on ice in a transport container and travel to the vivarium for pup injection.
- Bring a heat lamp, diapers, 1 mL syringe, 18 G needle, 30 G needle, and the CD34+ cell preparation in sterile containers to the vivarium BSC. Place a sterile diaper ~2 ft underneath the heat lamp. Retrieve the cage with the litter to be injected and place in the BSC.
- Assemble the syringe with an 18 G beveled needle. Matching the angle of the conical tube with the bevel of the needle, gently mix and draw up the cell suspension. Place the pups on the diaper to warm (watch for overheating). Remove air from the syringe and replace the 18 G needle with the 30 G needle, and then carefully push the syringe until the cell suspension is just at the needle tip.
NOTE: Alternatively, an insulin syringe can be used. - Take one pup at a time to the edge of the diaper away from the heat lamp. Immobilize the pup on its side under the thumb and forefinger, allowing for a clear view of the face. Notice the vein across the cheek under where the ear will be. Insert the needle shallowly into the vein (IV) nearest to the eye, and slowly inject 50 µL of cells.
- Check if a bubble is forming from a subcutaneous injection. If so, insert the needle deeper and proceed to inject cells. A small drop of blood/hematoma will be visible when successful.
NOTE: Refer to the procedure by Gombash Lampe et al.24 regarding pup injection. - With the pup still immobilized, perform an intrahepatic injection (IH) with another 50 µL of cells (100 µL total per pup of IV+IH). The liver can be visualized as a dark spot between the white milk band and the thoracic cage. Place the injected pup on a diaper further away from the un-injected pups and heat.
NOTE: IV injection results in better long-term chimerism than IH injection alone25, but IV injections are not always successful. Therefore, splitting the injection between IV and IH ensures engraftment into a larger percentage of mice. - Repeat both facial-vein and IH injections for all pups. Clean off any blood, return pups to the nest in their cage, and cover with bedding.
2. Testing human chimerism in blood
- Test chimerism in the blood of HIS mice at both 10 and 14 weeks of age. Collect 50 µL of blood via the retro-orbital vein or using an alternative IACUC-approved method.
- For retro-orbital bleeds, anesthetize mice with an isoflurane vaporizer set to 5 for 1-2 min and then turn the vaporizer setting down to 4. Turn down the vaporizer as needed to allow mice to stay sufficiently oxygenated while under anesthesia. Do not keep the mice under isoflurane for more than 5 min.
- Place the nose of the anesthetized mouse into the isoflurane vaporizer nose cone attachment and place a drop of the analgesic (0.5% proparacaine HCl ophthalmic solution USP) on the eye.
- After 1 min, remove the proparacaine using a sterile gauze, proptose the eye, and insert a 75 mm heparinized hematocrit tube retro-orbitally to collect 50 µL of blood. Eject the blood into a 1.5 mL microfuge tube containing 50 µL of heparin and gently mix.
- Pinch the eye closed with sterile gauze to stop the bleeding and apply a drop of proparacaine. Remove the mouse from isoflurane and recover in a clean cage.
- PBMC isolation from mouse blood
- Mix the blood/heparin by gently pipetting up and down and slowly overlay on top of 500 µL of 1.077 g/mL density gradient, being careful not to disturb the interface. Centrifuge the tubes at 1,220 x g for 20 min at RT with no brakes.
- Visualize the cellular buffy coat as a cloudy layer on top of the 1.077 g/mL density gradient, below the plasma. Remove as many of the cells as possible from the buffy coat with a 200 µL pipette and add to new 1.5 mL tubes containing 750 µL of harvest medium. Centrifuge at 360 x g for 11 min at RT.
- Aspirate the medium down to 50 µL and resuspend the pellet in 750 µL of harvest medium. Centrifuge at 360 x g for 10 min at 4 °C, and aspirate down again to 50 µL. The cells are ready to be resuspended in the surface stain.
- Surface staining and flow cytometric analysis
- Fill out the staining panel worksheet (Table 1; "spectral flow bleed panel" worksheet) with mouse numbers and prepare the antibody staining cocktail by adding all fluorescent antibodies to the staining buffer (Supplemental File 1). Make a plate layout to add the samples to a 96-well U-bottom plate. Mark the bottoms of wells using a permanent marker. Titrate antibodies using a standard procedure prior to staining to determine the appropriate concentration26.
- Add 62 µL of the surface stain cocktail to each well of the 96-well U-bottom plate. Resuspend the cells in the 50 µL remaining in the tube and add each sample to its corresponding well. Include a well for a positive staining control (human PBMCs + mouse splenocytes, 1 x 10⁶ cells each) to stain alongside the samples. Mix by pipetting and incubate the mixture for 15 min at 4 °C.
- Centrifuge at 680 x g for 3 min at 4 °C. Flick out the plate into the sink to remove the supernatant, and wash the cells by resuspending in 150 µL of staining buffer by gently pipetting ~10x. Spin and resuspend each well in 150 µL of staining buffer.
- Acquire the data for 100 µL of each sample on a flow cytometer (see Table of Materials) and export the .fcs files. Import the .fcs files to the flow data editing software (see Table of Materials). Apply a polygon gate to an FSC-A x SSC-A plot surrounding the cells, excluding any debris. Select the cells within the gate (see Table 1; "spectral flow bleed gating" worksheet).
- Change the axes to (FSC-A x FSC-H) and gate the cells contained on the linear diagonal excluding the doublets that protrude from the line. Select these cells and change the axes to (hCD45 x mCD45).
- Apply a polygon gate to the hCD45+ population and apply the name "human". Apply a polygon gate to the mCD45+ population and apply the name "mouse". Create a count statistic for both the human and mouse populations.
- Select the human population and change the axes to (CD19 x CD3). Apply a polygon gate to the CD19+ cells and name it "B cells". Apply a polygon gate to the CD3+ population and name it "T cells". Apply a polygon gate to the double negative population and name it "NonTB".
- Select the T cell population and change the axes to (CD8 x CD4). Apply a polygon gate to the CD4 and CD8 positive populations and name them "CD4+" and "CD8+", respectively.
- Select the NonTB population and change the axes to (CD56 x myeloid). Apply a polygon gate to the total CD56 positive population including the double positive events and name it "NK cells". Apply a polygon gate to the CD56 negative and myeloid positive population and name it "myeloid".
- Create a table for the percentage and count statistics of all populations and export to a spreadsheet software (see Table of Materials). Calculate %hCD45 chimerism = %hCD45/(%hCD45 + mCD45).
- Exclude HIS mice that are <20% hCD45+ (of mCD45 + hCD45) for further experiments.
NOTE: In this study, PBMCs were prepared using a 1.077 g/mL density gradient separation for a cleaner RBC depletion. This procedure excluded human and mouse granulocytes from the PBMC layer. Alternatively, RBC lysis can be used.
3. Injection of tumors into mice
- Prior to tumor injection, confirm T cell numbers from the 14 week bleed data. Tumors are injected to be ready for harvest between 20-26 weeks if the T cells are >20%, and between 24-28 weeks if the T cells are <20% of the total immune cell population. This injection timing ensures that the mice are 20-28 weeks of age and have sufficient numbers of T cells at the end of the study.
- Injection of cell-line derived xenografts (CDX)
NOTE: The procedure is described using MDA-MB-231 breast adenocarcinoma cells (see Table of Materials) as an example.- Thaw an aliquot of frozen cells, wash 1x by resuspending in 10 mL of DMEM supplemented with 10% FBS, 1% PenStrep, and 1% nonessential amino acids, and centrifuge at 360 x g for 10 min at 4 °C. Aspirate the medium and resuspend in 10 mL of DMEM supplemented with 10% FBS, 1% PenStrep, and 1% nonessential amino acids in a T25 flask and incubate at 37 °C with 5% CO2.
NOTE: The cell lines are authenticated by PCR to ensure correct cell type. Cell supernatants are tested for mycoplasma via a biochemical assay before injection. - Passage and expand the cells during exponential growth phase at about 80% confluency.
- Aspirate the medium, rinse the cells with 5-10 mL of sterile PBS (pH 7.2), and incubate with 1 mL of 0.25% trypsin-EDTA for 1-5 min until the cells detach from the flask.
- Add 5 mL of the same DMEM and mix by pipetting up and down. Passage the entire 6 mL of cell suspension into a new tissue culture treated T75 flask (1:3 dilution) and add an additional 10 mL of DMEM.
- Passage the cells every 2-3 days at 80% confluency at 1:3 dilutional plating in DMEM to expand the cells.
- Harvest the cells with 0.25% trypsin-EDTA during the exponential growth phase within six passages and wash with PBS. Mix PBS and basement membrane extract (see Table of Materials) in a 1:1 ratio and add to the cells at a final concentration of 5 x 10⁷ cells/mL.
- Anesthetize the mice with isoflurane as described in step 2.1.1. Subcutaneously inject 100 µL (5 x 10⁶ cells) of tumor cell suspension into each flank using a 23 G needle.
- Thaw an aliquot of frozen cells, wash 1x by resuspending in 10 mL of DMEM supplemented with 10% FBS, 1% PenStrep, and 1% nonessential amino acids, and centrifuge at 360 x g for 10 min at 4 °C. Aspirate the medium and resuspend in 10 mL of DMEM supplemented with 10% FBS, 1% PenStrep, and 1% nonessential amino acids in a T25 flask and incubate at 37 °C with 5% CO2.
- Perform injection of patient-derived xenografts (PDX) using trocars. The injection procedure and other development and maintenance instructions for the PDX model are available in literature27.
4. Tumor growth measurement
- Check tumor progress once a week after implantation by feeling along the flank for tumor growth. Once the tumors are palpable, anesthetize the mice with isoflurane (as described in step 2.1.1) and shave on each flank with an electric trimmer, taking care around the tumor to prevent ulcerations as the tumor grows.
NOTE: Mice can be shaved before tumor injection to prevent injuries to the skin around the tumors; however, the rate of hair regrowth could obstruct tumor measurements. - Measure the length and width of the tumors twice per week using calipers and record the measurements in mm. Report tumor measurements as tumor volume (mm3) using the formula
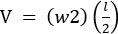 . Take care not to allow the tumor burden to exceed 2,000 mm3 per single tumor or a combined volume of 3,000 mm3.
NOTE: Guidelines for the use of mice in cancer research vary by location. Please refer to Animal Care and Use policies at the researcher's institution.
5. Drug treatments
- Allocate the HIS mice into equivalent treatment groups based on hCD45 chimerism, hCD3 chimerism, and hCD8 chimerism. Once the tumors reach 100 mm3 on average, begin drug treatments.
NOTE: The number of mice per group is based on number of HIS mice generated from the CB. A minimum of four mice per group is recommended. Non-bipartite multigroup matching (e.g., in R-vivo Manila software) is useful for this grouping28. - Drug route and frequency
- Inject anti-PD-1 inhibitors (nivolumab, pembrolizumab) intraperitonially (i.p.) at 30 mg/kg 1x per week or 20 mg/kg 2x per week for single treatments, or 10-15 mg/kg 2x per week for combination treatments.
- Dose the combination therapies, such as targeted therapies, chemotherapies, and irradiation, in accordance with the experimental design. Targeted therapies and chemotherapies can be given through oral gavage, i.p. injection, or food.
NOTE: Doses can be varied and optimized according to published data and the tumor model. Dose studies are often tested in immunodeficient recipients prior to HIS mouse studies.
- Monitor the mice at least 3x per week for health changes such as weight loss, loose feces, hunched posture, reduced mobility, and fur loss. Some symptoms could be signs of drug toxicities or GVHD, and drug dosing may need reduced or stopped. Euthanize mice as needed according to Animal Care and Use policies.
6. Harvesting of mouse tissues and tumors at the end of the study
- Euthanize the mice singly according to institutional and veterinary guidelines using compressed CO2 gas with a flow rate of 2.75 L/min. Monitor the mice held in CO2 for 1 min past death and then perform cervical dislocation as a secondary form of euthanasia.
- Blood collection
- Collect blood via intracardiac puncture. Hold the mouse in an upright position and insert a 1 mL syringe with a 25 G needle directly into the heart from a line just left of the midline and below the ribs. Collect the blood into a syringe ideally through one long draw and transfer into a labeled 1.5 mL tube.
NOTE: Additional needle insertions can be performed to collect additional blood from the corners of the lung cavity with care. - Leave the blood at 4 °C for 1 h, then centrifuge the blood in a microcentrifuge for 6 min at 7,800 x g. Collect the clear liquid (sera) above the blood interface into a second clean and labeled 1.5 mL tube. Store the serum at -20 °C for downstream analysis, such as human and mouse inflammatory cytokine or immunoglobulin titers.
- Collect blood via intracardiac puncture. Hold the mouse in an upright position and insert a 1 mL syringe with a 25 G needle directly into the heart from a line just left of the midline and below the ribs. Collect the blood into a syringe ideally through one long draw and transfer into a labeled 1.5 mL tube.
- Tissue dissection
- After the injection and growth of tumor cells in the mice and the administering of drug treatments, harvest the tissues. Place the mice on a foam dissection board, with pins to hold them in place, and the arms and legs extended at 45° angles. Make an incision up the middle of the torso, starting near the pelvis and extending to the chin, trying to avoid cutting the peritoneum (although this is not essential). Pull the skin to the edge and hold in place with pins.
- Extract the lymph nodes (LNs) using fine forceps in the following order: inguinal, axillary, cervical, mesenteric, hiatal.
NOTE: In HIS mice, the LNs are often very small, resembling anlage, or "inflamed" with a distinct appearance unlike that from a wild-type mouse. Therefore, tissue resembling LNs is taken from each site. The peripheral LNs often appear as fluid-filled "balls", while the mesenteric LNs are more dense. The mesenteric LNs are the most obvious and consistent and are observed as one or two distinct denser nodes, as opposed to a string. - Place the LNs on one side of frosted glass slides in 8 mL of harvest medium in a Petri dish. Holding the slides at perpendicular angles with the frosted edges inward, gently press the tissues until the cellular contents are released.
- Rinse the slides several times by pulling them apart and together to release the maximal amount of cells. Collect the cells with a 5 in glass pipette and filter them through a 9 in cotton-plugged pipette into a labeled 15 mL conical tube.
- Extract the spleen from the upper left side of the abdomen using either two pairs of forceps or forceps and scissors. Note the size of the spleen as an estimate of the volume of resuspension media. Collect and filter the spleen by mechanical digestion using frosted glass slides, as with the LNs.
NOTE: Any technique for the preparation of tissues for single cell suspensions can be used. - Perform counting and resuspension of the cells from tissue samples as described below.
- Centrifuge the lymph cells at 360 x g for 10 min at 4 °C. Aspirate the liquid and resuspend the cell pellet in 1 mL of harvest medium with DNase.
- Remove erythrocytes from the spleen cells by incubating with 3 mL of ACK lysis buffer at RT for 3 min, followed by the addition of 10 mL of harvest medium/DNase. Centrifuge the spleen cells again, aspirate the supernatant, and resuspend the cells in 1-10 mL of harvest media/DNase, based on the spleen size (e.g., 1 mL for very small spleens and up to 10 mL for the largest spleens).
- Add a 10 µL aliquot of cell suspension to 90 µL of media and count on a hemocytometer. Centrifuge the LNs and spleen cells, aspirate the supernatants, and resuspend the cells in harvest medium at a concentration of 1 x 10⁸ cells/mL, or a minimum of 80 µL.
- Extract the tumors.
- Remove the tumor from the open flank by holding the tumor with forceps while slowly snipping at the tumor margins with dissection scissors.
- Once the tumor is removed, weigh it and remove 1/4 for RNA and immunohistochemistry (IHC) processing. Divide the 1/4 tumor in half; place one half (1/8 of the whole tumor) in a cryovial, flash freeze in liquid N2, and store at -80 °C for downstream genomic studies.
- Place the other 1/8 of the tumor in a labeled specimen tube containing 10% formalin. The next day, rinse and resuspend the tissue in 70% ethanol until future use. Place the remaining 3/4 of the tumor into a 6 cm dish and mince into ~1 mm pieces using a scalpel blade.
- Transport the tumor pieces into a dissociation tube (see Table of Materials), rinse the dish with 5 mL of incomplete tumor infiltrating leukocyte (TIL) medium, and add to the dissociation tube.
NOTE: For tumors weighing >0.4 g, rinse the dish with 10 mL of TIL incomplete media and add to dissociation tube. - Add collagenase preparation (see Table of Materials) at a final concentration of 50 mg/mL to the tissue in the dissociation tube. Dissociate the tissue using mechanical dissociation at 37 °C for 30 min to 1 h, depending on the firmness of the tumor.
- After dissociation, pass the suspension over a 100 µm filter into a 50 mL conical tube and rinse the filter with 10 mL of TIL complete media. The serum in this media will stop the collagenase reaction and protect the cells from further degradation.
- Centrifuge the single cell suspension at 360 x g for 10 min at 4 °C. Resuspend the pellet in just enough harvest medium with DNase so that the cell suspension can easily pass through a P1000 pipette tip and record the volume for downstream analysis.
NOTE: A smaller volume increases the collection of tumor immune cells but is more susceptible to flow cytometer clogs.
7. Cell staining and flow cytometric analyses
- Stain preparation and cell plating
- Prepare staining cocktails: On the day of harvest, add the number of samples to the staining worksheet (Table 2; "Conventional Flow A panel", "Spectral Flow B panel", and "Conventional Flow C panel" worksheets) for all stains and print. Prepare surface stain cocktails for stains A and B in staining buffer (SB) by adding each antibody individually with a new tip, marking off each reagent on the go, and store at 4 °C until needed. Prepare the appropriate viability dyes in azide-free PBS and store at 4 °C until needed (warm to RT before use). Prepare surface stain C cocktail on day 2 in SB along with intracellular stains B and C in their respective permeabilization buffers.
- Create a plate layout for all samples in the staining worksheet and aliquot 100 µL of azide-free PBS to the wells. Include unstained controls for each tissue and stain (for spectral cytometry).
- Add the cells to 96-well plates containing 50 µL of PBS. For stain A, resuspend each tissue group in the appropriate volume, as noted on the staining worksheet, and store at 4 °C until acquisition on flow cytometer on same day. For stains B and C, add 25 µL of lymph and 60 µL of non-lymph tissue cell suspensions to the wells with PBS.
- Perform in vitro stimulation of cytokines for detection by intracellular staining using stain C.
- Centrifuge the stain C 96-well plate from step 7.1.3 at 680 x g for 3 min at 4 °C. Add 200 µL of TIL complete media (RPMI 1640, 10 mM HEPES [pH 7], 10% FBS) to each well. Store the plate with the cell suspension at 4 °C overnight.
- Early the following morning, dilute the cell stimulation cocktail (see Table of Materials) 1:500 in complete TIL media. Centrifuge the plate containing the cell suspension at 680 x g to pellet the cells and flick to remove the media. Resuspend the cells in 200 µL of the prepared cell stimulation cocktail and incubate at 37 °C for 1 h.
- Add 25 µL of protein transport inhibitor solution containing monensin at a 1:1,000 dilution in complete TIL media, mix the cells, and incubate at 37 °C for an additional 4 h to allow intracellular accumulation of cytokines.
- Perform cell staining.
- For stains A and B (Day 1), and for stain C (Day 2), centrifuge at 680 x g for 3 min at 4 °C. Flick the plates and add the appropriate viability dyes to the wells. Mix well by gently pipetting up and down with a multichannel pipette and incubate for 15 min at RT.
- Centrifuge the plates (as in step 7.1.5.1), then add appropriate surface stains to the plates and mix gently by pipetting with a multi-channel pipette. Incubate for 15 min at 4 °C and centrifuge again. Flick the plates, wash the cells by gently pipetting up and down with 150 µL of SB, and centrifuge.
- Flick the plates, repeat the wash by gently pipetting up and down with 150 µL of SB, and centrifuge at 680 x g for 3 min at 4 °C. For stain A, resuspend each tissue group in the appropriate volume, as noted on the staining worksheet, and store at 4 °C. For stain B, fix with FoxP3 transcription factor kit fixative (see Table of Materials) for 30 min at RT. For stain C, fix in 1% (v/v) paraformaldehyde in SB for 30 min at RT.
- Centrifuge the fixed plates at 480 x g for 3 min at 4 °C. Wash 1x in SB. For Stain B, the cells can be left overnight.
- Permeabilize the cells: resuspend the wells in 150 µL of FoxP3 transcription factor kit permeabilization buffer for stain B and in 0.5% (w/v) saponin in SB for Stain C. Incubate for 15 min at RT. Centrifuge the fixed plates at 480 x g for 3 min at 4 °C.
- Flick the plates and add the respective intracellular staining cocktails for stain B and stain C. Incubate for 30 min at RT.
- Centrifuge the fixed plates at 480 x g for 3 min at 4 °C and flick the plates. Wash the cells with 150 µL of the corresponding permeabilization buffers (stain B, FoxP3 transcription factor kit permeabilization buffer; stain C, saponin).
- Flick the plates and wash by pipetting up and down in 150 µL of SB. Centrifuge at 480 x g for 3 min at 4 °C. Flick the plates and resuspend the cells in SB by tissue group in the appropriate volumes noted on the staining worksheet.
NOTE: The samples are now ready for acquisition by spectral flow cytometry. - Set up the flow cytometer (see Table of Materials) with appropriate single stained controls for each stain and unstained samples for each tissue group to account for differences in autofluorescence during unmixing. Acquire the appropriate volumes per tissue group as defined in the staining worksheet (Table 2) and export the .fcs files.
- Flow cytometry data analysis
- Using the flow cytometry analysis software (see Table of Materials), create a new workspace. Create new groups for each organ (LN, spleen, and TIL). Import the .fcs files for each organ into the group.
- Create a bivariate dot plot, set the axes to (FSC-A x SSC-A), and apply a polygon gate to cellular events, avoiding events on the edges (all cells gate). Select the cellular events, change the axes to (FSC-A x FSC-H), and apply a polygon gate to the events on the linear diagonal, excluding events that deviate from the diagonal to generate the "singlets" gate. Select the "singlets" gate and change the axes to (hCD45 x mCD45). Apply polygon gates to the hCD45 and mCD45 positive events, and name them "human" and "mouse", respectively.
- Select the human population and change the Y-axis to Live/Dead Aqua. Apply a polygon gate to the Live/Dead negative, hCD45 positive population and name it "live human". Select the mouse population and change the X-axis to Live/Dead Aqua. Apply a polygon gate to the Live/Dead negative, mCD45 positive population and name it "live mouse".
- In a similar fashion, select the parent gate and the X- and Y-axes as outlined in the "Conventional Flow A Gating", "Spectral Flow B Gating", and "Conventional Flow C Gating" worksheets (Table 2) to isolate the indicated populations (e.g., human B cells, activated T cells).
NOTE: Representative gating for each stain (Bleed, A, B, C) is included in Supplemental File 2. - Create count and frequency export tables in the flow cytometry analysis software for all populations and export to a spreadsheet software. The parent population for frequencies is indicated in Table 2.
- Use the data to generate graphs based on experimental treatment groups.
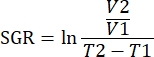
NOTE: The data can also be analyzed using R packages in the analysis software. A single .fcs file from all samples to be analyzed can be created using the concatenate feature. This data can be dimensionally reduced with the T-SNE algorithm while adding keyword parameters for tissue type and treatment group. The FlowSOM algorithm can then be used to cluster populations and the ClusterExplorer tool can be used to identify the populations. Novel cell populations can be identified in this manner, compared visually, and quantified between treatment groups or within various tissues. - Correlate immune parameters for tumors within the same treatment group, with the growth for that tumor to define immunotypes that correlate with tumor growth inhibition. Quantify tumor growth by the specific growth rate (SGR) for that tumor, a measurement that takes into account the difference in tumor volumes over a specified time. This measurement normalizes tumors harvested on different days due to mouse health and treatment start dates.
Access restricted. Please log in or start a trial to view this content.
Results
Following the flank tumor protocol and experimental timeline (Figure 1), the tumor growth and immune response to a targeted tyrosine kinase inhibitor (TKI) therapy and nivolumab combination treatment was studied in two distinct human colorectal cancer (CRC) PDXs. The TKI drugs have been studied in immunodeficient hosts to evaluate tumor growth only29. This model enabled the study of changes in the immune response of the TKI alone, and more importantly, in combination ...
Access restricted. Please log in or start a trial to view this content.
Discussion
Over the past 6 years, using our expertise in both immunology and humanized mice, our research team has developed a much needed preclinical model to test immunotherapies on a variety of human tumors3,7,30,31. This protocol emphasizes the consideration of the variability of the model, with special attention to the immunotherapy-centric human T cell populations. In this protocol, the generation o...
Access restricted. Please log in or start a trial to view this content.
Acknowledgements
We would like to thank both the Animal Research Facility (OLAR) for their care of our mice, and the Flow Cytometry Shared Resource supported by the Cancer Center Support Grant (P30CA046934) at our institute for their immense help in all our work. We also acknowledge both Gail Eckhardt and Anna Capasso for our inaugural collaborations studying immunotherapies to human PDXs in our HIS-BRGS model. This study was supported in part by the National Institutes of Health P30CA06934 Cancer Center Support Grant with use of the PHISM (Pre-clinical Human Immune System Mouse Models) Shared Resource, RRID: SCR_021990 and Flow Cytometry Shared Resource, RRID: SCR_022035. This research was supported in part by the NIAID of the National Institutes of Health under Contract Number 75N93020C00058.
Access restricted. Please log in or start a trial to view this content.
Materials
| Name | Company | Catalog Number | Comments |
|---|---|---|---|
| 1 mL syringe w/needles | McKesson | 1031815 | |
| 15 mL tubes | Grenier Bio-One | 188271 | |
| 2-mercaptoethanol | Sigma | M6250 | |
| 50 mL tubes | Grenier Bio-One | 227261 | |
| AutoMACS Pro Separator | Miltenyi | 130-092-545 | |
| BD Golgi Stop Protein Transport Inhibitor with monensin | BD Bioscience | BDB563792 | |
| BSA | Fisher Scientific | BP1600100 | |
| Cell Stim Cocktail | Life Technologies | 509305 | |
| Chill 15 Rack | Miltenyi | 130-092-952 | |
| Cotton-plugged glass pipettes | Fisher Scientific | 13-678-8B | |
| Cultrex Basement membrane extract | R&D Systems | 363200502 | |
| Cytek Aurora | Cytek | ||
| DNase | Sigma | 9003-98-9 | |
| eBioscience FoxP3/Transcription Factor Staining Buffer Set | Invitrogen | 00-5523-00 | |
| Embryonic Stemcell FCS | Gibco | 10439001 | |
| Eppendorf Tubes; 1.5 mL volume | Grenier Bio-One | 616201 | |
| Excel | Microsoft | ||
| FBS | Benchmark | 100-106 500mL | |
| Ficoll Hypaque | GE Healthcare | 45001752 | |
| FlowJo Software | BD Biosciences | ||
| Forceps - fine | Roboz Surgical | RS5045 | |
| Forceps normal | Dumont | RS4919 | |
| Formaldehyde | Fisher | F75P1GAL | |
| Frosted Glass Slides | Corning | 1255310 | |
| Gentlemacs C-Tubes | Miltenyi | 130-096-334 | |
| GentleMACS Dissociator | Miltenyi | 130-093-235 | |
| glass pipettes | DWK Life Sciences | 63A53 | |
| Glutamax | Gibco | 11140050 | |
| HBSS w/ Ca & Mg | Sigma | 55037C | |
| HEPES | Corning | MT25060CI | |
| IgG standard | Sigma | I2511 | |
| IgM standard | Sigma | 401108 | |
| IMDM | Gibco | 12440053 | |
| Liberase DL | Roche | 5466202001 | |
| LIVE/DEAD Fixable Blue | Thermo | L23105 | |
| MDA-MB-231 | ATCC | HTB-26 | |
| MEM | Gibco | 1140050 | |
| mouse anti-human IgG-AP | Southern Biotech | JDC-10 | |
| mouse anti-human IgG-unabeled | Southern Biotech | H2 | |
| mouse anti-human IgM-AP | Southern Biotech | UHB | |
| mouse anti-human IgM-unlabeled | Southern Biotech | SA-DA4 | |
| MultiRad 350 | Precision X-Ray | ||
| PBS | Corning | 45000-446 | |
| Pen Strep | Gibco | 15140122 | |
| Petri Dishes | Fisher Scientific | FB0875713A | |
| p-nitrophenyl substrate | Thermo | 34045 | |
| PRISM | Graphpad | ||
| Rec Hu FLT3L | R&D systems | 308-FK-005/CF | |
| Rec Hu IL6 | R&D systems | 206-IL-010/CF | |
| Rec Hu SCF | R&D systems | 255SC010 | |
| RPMI 1640 | Corning | 45000-39 | |
| Saponin | Sigma | 8047-15-2 | |
| Scissors | McKesson | 862945 | |
| Serological pipettes 25 mL | Fisher Scientific | 1367811 | |
| Sterile filter | Nalgene | 567-0020 | |
| Sterile molecular water | Sigma | 7732-18-5 | |
| Yeti Cell Analyzer | Bio-Rad | 12004279 | |
| Zombie Green | biolegend | 423112 |
References
- Chulpanova, D. S., Kitaeva, K. V., Rutland, C. S., Rizvanov, A. A., Solovyeva, V. V. Mouse tumor models for advanced cancer immunotherapy. International Journal of Molecular Sciences. 21 (11), 4118(2020).
- Olson, B., Li, Y., Lin, Y., Liu, E. T., Patnaik, A. Mouse models for cancer immunotherapy research. Cancer Discovery. 8 (11), 1358-1365 (2018).
- Marin-Jimenez, J. A., et al. Testing cancer immunotherapy in a human immune system mouse model: correlating treatment responses to human chimerism, therapeutic variables and immune cell phenotypes. Frontiers in Immunology. 12, 607282(2021).
- Yin, L., Wang, X. J., Chen, D. X., Liu, X. N., Wang, X. J. Humanized mouse model: a review on preclinical applications for cancer immunotherapy. American Journal of Cancer Research. 10 (12), 4568-4584 (2020).
- Cogels, M. M., et al. Humanized mice as a valuable pre-clinical model for cancer immunotherapy research. Frontiers in Oncology. 11, 784947(2021).
- Jin, K. T., et al. Development of humanized mouse with patient-derived xenografts for cancer immunotherapy studies: A comprehensive review. Cancer Science. 112 (7), 2592-2606 (2021).
- Capasso, A., et al. Characterization of immune responses to anti-PD-1 mono and combination immunotherapy in hematopoietic humanized mice implanted with tumor xenografts. Journal for Immunotherapy of Cancer. 7 (1), 37(2019).
- Wang, M., et al. Humanized mice in studying efficacy and mechanisms of PD-1-targeted cancer immunotherapy. The FASEB Journal. 32 (3), 1537-1549 (2018).
- Yong, K. S. M., et al. Humanized mouse as a tool to predict immunotoxicity of human biologics. Frontiers in Immunology. 11, 553362(2020).
- Shen, H. W., Jiang, X. L., Gonzalez, F. J., Yu, A. M. Humanized transgenic mouse models for drug metabolism and pharmacokinetic research. Current Drug Metabolism. 12 (10), 997-1006 (2011).
- Bosma, G. C., Custer, R. P., Bosma, M. J. A severe combined immunodeficiency mutation in the mouse. Nature. 301 (5900), 527-530 (1983).
- Shultz, L. D., et al. Multiple defects in innate and adaptive immunologic function in NOD/LtSz-scid mice. The Journal of Immunology. 154 (1), 180-191 (1995).
- Legrand, N., et al. Functional CD47/signal regulatory protein alpha (SIRP(alpha)) interaction is required for optimal human T- and natural killer- (NK) cell homeostasis in vivo. Proceedings of the National Academy of Sciences. 108 (32), 13224-13229 (2011).
- Ishikawa, F., et al. Development of functional human blood and immune systems in NOD/SCID/IL2 receptor {gamma} chain(null) mice. Blood. 106 (5), 1565-1573 (2005).
- Ito, M., et al. NOD/SCID/gamma(c)(null) mouse: an excellent recipient mouse model for engraftment of human cells. Blood. 100 (9), 3175-3182 (2002).
- Shultz, L. D., et al. Human lymphoid and myeloid cell development in NOD/LtSz-scid IL2R gamma null mice engrafted with mobilized human hemopoietic stem cells. The Journal of Immunology. 174 (10), 6477-6489 (2005).
- Traggiai, E., et al. Development of a human adaptive immune system in cord blood cell-transplanted mice. Science. 304 (5667), 104-107 (2004).
- Theocharides, A. P., Rongvaux, A., Fritsch, K., Flavell, R. A., Manz, M. G. Humanized hemato-lymphoid system mice. Haematologica. 101 (1), 5-19 (2016).
- Goldman, J. P., et al. Enhanced human cell engraftment in mice deficient in RAG2 and the common cytokine receptor gamma chain. British Journal of Haematology. 103 (2), 335-342 (1998).
- Stripecke, R., et al. Innovations, challenges, and minimal information for standardization of humanized mice. EMBO Molecular Medicine. 12 (7), (2020).
- Allen, T. M., et al. Humanized immune system mouse models: progress, challenges and opportunities. Nature Immunology. 20 (7), 770-774 (2019).
- Gammelgaard, O. L., Terp, M. G., Preiss, B., Ditzel, H. J. Human cancer evolution in the context of a human immune system in mice. Molecular Oncology. 12 (10), 1797-1810 (2018).
- Rios-Doria, J., Stevens, C., Maddage, C., Lasky, K., Koblish, H. K. Characterization of human cancer xenografts in humanized mice. Journal for Immunotherapy of Cancer. 8 (1), 000416(2020).
- Gombash Lampe, S. E., Kaspar, B. K., Foust, K. D. Intravenous injections in neonatal mice. Journal of Visualized Experiments. (93), e52037(2014).
- Lang, J., Weiss, N., Freed, B. M., Torres, R. M., Pelanda, R. Generation of hematopoietic humanized mice in the newborn BALB/c-Rag2null Il2rγnull mouse model: a multivariable optimization approach. Clinical Immunology. 140 (1), 102-116 (2011).
- Laskowski, T. J., Hazen, A. L., Collazo, R. S., Haviland, D. Rigor and reproducibility of cytometry practices for immuno-oncology: a multifaceted challenge. Cytometry Part A. 97 (2), 116-125 (2020).
- Bagby, S., et al. Development and maintenance of a preclinical patient derived tumor xenograft model for the investigation of novel anti-cancer therapies. Journal of Visualized Experiments. (115), e54393(2016).
- Laajala, T. D., et al. Optimized design and analysis of preclinical intervention studies in vivo. Scientific Reports. 6, 30723(2016).
- Na, Y. S., et al. Establishment of patient-derived xenografts from patients with gastrointestinal stromal tumors: analysis of clinicopathological characteristics related to engraftment success. Scientific Reports. 10 (1), 7996(2020).
- Tentler, J. J., et al. RX-5902, a novel beta-catenin modulator, potentiates the efficacy of immune checkpoint inhibitors in preclinical models of triple-negative breast cancer. BMC Cancer. 20 (1), 1063(2020).
- Lang, J., et al. Development of an adrenocortical cancer humanized mouse model to characterize anti-PD1 effects on tumor microenvironment. The Journal of Clinical Endocrinology & Metabolism. 105 (1), 26-42 (2020).
- Lang, J., et al. Studies of lymphocyte reconstitution in a humanized mouse model reveal a requirement of T cells for human B cell maturation. The Journal of Immunology. 190 (5), 2090-2101 (2013).
- Katano, I., et al. NOD-Rag2null IL-2Rγnull mice: an alternative to NOG mice for generation of humanized mice. Experimental Animalas. 63 (3), 321-330 (2014).
- Brehm, M. A., et al. Parameters for establishing humanized mouse models to study human immunity: analysis of human hematopoietic stem cell engraftment in three immunodeficient strains of mice bearing the IL2rγ(null) mutation. Clinical Immunology. 135 (1), 84-98 (2010).
- Hasgur, S., Aryee, K. E., Shultz, L. D., Greiner, D. L., Brehm, M. A. Generation of immunodeficient mice bearing human immune systems by the engraftment of hematopoietic stem cells. Methods in Molecular Biology. 1438, 67-78 (2016).
- Andre, M. C., et al. Long-term human CD34+ stem cell-engrafted nonobese diabetic/SCID/IL-2Rγnull mice show impaired CD8+ T cell maintenance and a functional arrest of immature NK cells. The Journal of Immunology. 185 (5), 2710-2720 (2010).
- Wunderlich, M., et al. Improved multilineage human hematopoietic reconstitution and function in NSGS mice. PLoS One. 13 (12), 0209034(2018).
- Lee, J., Brehm, M. A., Greiner, D., Shultz, L. D., Kornfeld, H. Engrafted human cells generate adaptive immune responses to Mycobacterium bovis BCG infection in humanized mice. BMC Immunology. 14, 53(2013).
- Masse-Ranson, G., et al. Accelerated thymopoiesis and improved T-cell responses in HLA-A2/-DR2 transgenic BRGS-based human immune system mice. European Journal of Immunology. 49 (6), 954-965 (2019).
- Oswald, E., et al. Immune cell infiltration pattern in non-small cell lung cancer PDX models is a model immanent feature and correlates with a distinct molecular and phenotypic make-up. Journal for Immunotherapy of Cancer. 10 (4), 004412(2022).
Access restricted. Please log in or start a trial to view this content.
Reprints and Permissions
Erratum
Formal Correction: Erratum: Testing Cancer Immunotherapeutics in a Humanized Mouse Model Bearing Human Tumors
Posted by JoVE Editors on 5/25/2023. Citeable Link.
An erratum was issued for: Testing Cancer Immunotherapeutics in a Humanized Mouse Model Bearing Human Tumors. The Authors section was updated from:
Jordi M. Lanis1
Matthew S. Lewis1
Hannah Strassburger1
Stacey M. Bagby2
Adrian T. A. Dominguez2
Juan A. Marín-Jiménez3
Roberta Pelanda1
Todd M. Pitts2
Julie Lang1
1Department of Immunology and Microbiology, School of Medicine, University of Colorado Denver Anschutz Medical Campus
2Division of Oncology, School of Medicine, University of Colorado Denver Anschutz Medical Campus
3Department of Medical Oncology, Catalan Institute of Oncology (ICO-L’Hospitalet)
to:
Jordi M. Lanis1
Matthew S. Lewis1
Hannah Strassburger1
Kristina Larsen1
Stacey M. Bagby2
Adrian T. A. Dominguez2
Juan A. Marín-Jiménez3
Roberta Pelanda1
Todd M. Pitts2
Julie Lang1
1Department of Immunology and Microbiology, School of Medicine, University of Colorado Denver Anschutz Medical Campus
2Division of Oncology, School of Medicine, University of Colorado Denver Anschutz Medical Campus
3Department of Medical Oncology, Catalan Institute of Oncology (ICO-L’Hospitalet)
