We describe here a platform that allows comet assay detection of DNA damage with unprecedented throughput. The device patterns mammalian cells into a microarray and enables parallel processing of 96 samples. The approach facilitates analysis of base level DNA damage, exposure-induced DNA damage and DNA repair kinetics.
Method Article
CometChip: A High-throughput 96-Well Platform for Measuring DNA Damage in Microarrayed Human Cells
* These authors contributed equally
In This Article
Summary
Abstract
DNA damaging agents can promote aging, disease and cancer and they are ubiquitous in the environment and produced within human cells as normal cellular metabolites. Ironically, at high doses DNA damaging agents are also used to treat cancer. The ability to quantify DNA damage responses is thus critical in the public health, pharmaceutical and clinical domains. Here, we describe a novel platform that exploits microfabrication techniques to pattern cells in a fixed microarray. The ‘CometChip’ is based upon the well-established single cell gel electrophoresis assay (a.k.a. the comet assay), which estimates the level of DNA damage by evaluating the extent of DNA migration through a matrix in an electrical field. The type of damage measured by this assay includes abasic sites, crosslinks, and strand breaks. Instead of being randomly dispersed in agarose in the traditional assay, cells are captured into an agarose microwell array by gravity. The platform also expands from the size of a standard microscope slide to a 96-well format, enabling parallel processing. Here we describe the protocols of using the chip to evaluate DNA damage caused by known genotoxic agents and the cellular repair response followed after exposure. Through the integration of biological and engineering principles, this method potentiates robust and sensitive measurements of DNA damage in human cells and provides the necessary throughput for genotoxicity testing, drug development, epidemiological studies and clinical assays.
Introduction
The single cell gel electrophoresis (SCGE) assay (a.k.a. the comet assay) is a widely used technique for the quantification of a broad spectrum of DNA lesions, including base lesions, abasic sites, single strand breaks, double strand breaks, crosslinks and alkali sensitive sites. The underlying principle of the assay is that damaged DNA migrates more readily than undamaged DNA due to fragmentation and loss of superhelical structure. The extent of migration is proportional to the amount of DNA damage, and can be visualized using fluorescence microscopy. Image-capture and intensity profile analysis of individual comet-shaped DNA then deliver parameter measurements such as tail length, tail moment, and % DNA in tail to reveal the level of DNA damage within a cell1-4.
Currently there are two commonly used versions of the comet assay: a) alkaline comet assay and b) neutral comet assay. The alkaline comet assay is the most widely used version, which uses a high pH buffer to unwind DNA before electrophoresis and thus detects all types of strand breaks and alkali-sensitive sites. The neutral comet assay, on the other hand, is less practiced because it uses a neutral buffer to maintain the double helices and detect only double strand breaks2,5. For chemical and physical agents that induce DSBs, SSBs are created in concert, and are formed at much higher levels (e.g., γIR-induced SSBs are an order of magnitude more common than DSBs). For most DNA damaging exposures, DSBs are much less frequent than other classes of DNA damage, and are hence harder to detect. We have demonstrated in previous publications the detection window of both versions.6,7
Although the comet assay has been routinely used for basic research on DNA damage and repair and genotoxicity testing1,2,8-15, the assay has been reported having poor reproducibility due to sample-to-sample, person-to-person and lab-to-lab variability. Additionally, the assay is low throughput, in part because image acquisition and data analysis are laborious. Together, these limitations contribute to its relatively low acceptance in large-scale studies. Through integration of engineering technologies and principles, the CometChip brings a solution to the problems of throughput and inconsistencies that are associated with the traditional comet assay6,7. Briefly, to create the chip, a mold is microfabricated using photolithography to create microposts with diameters as small as that of a single cell. The mold is then used to stamp on molten agarose, resulting in an array of microwells after the gel solidifies. Chips are being developed to provide researchers with variable-sized wells to compatible with different cell types. To load the chip, cells in media are allowed to settle into the wells by gravity; excess cells are washed away. Trapped cells are then encapsulated using a thin layer of low melting point agarose, and a bottomless 96 well plate is then clamped to the gel surface to create 96 macrowells, each with hundreds of microwells on its bottom surface.
This protocol describes the general procedures for experiments with this chip, which include gel preparation, cell loading, dosing and repair, cell lysis, electrophoresis, and fluorescent imaging. We demonstrate two examples of dose response experiments with lymphoblast cells exposed known DNA damaging agents, using alkaline and neutral versions of the assay respectively. Two repair experiments are also shown to describe how repair response post-exposure can be evaluated using the system.
Protocol
1. Preparation of Chip
- Remove chip gel from package and place into a one-well rectangular plate, gel film side down.
- Wash gel in 25 ml 1x PBS for 15 min, repeat two times.
- Set gel on glass plate and label orientation of gel accordingly.
- Gently press an inverted bottomless 96-well plate onto the gel; make sure that all wells of the bottomless well plate are within the area of the gel.
- Use 1.5’’ binder clips on each side of the plate to secure clamping with the glass.
- Aspirate off excess PBS buffer in each well.
2. Loading Cells
- Prepare cell suspensions:
- For suspension cell lines, dilute cell suspension in media to obtain a final concentration of 105–106 cells/ml.
- For adherent cell lines, follow normal detaching/trypsinization protocols and dilute detached cells in media to a final concentration of 105–106 cells/ml. If cells aggregate, pass cell suspension in a cell filter to obtain a single cell suspension.
- Add 100 μl of cell suspension to each well of the 96-well plate.
- Cover plate with the gel film to prevent evaporation of media.
- Allow cells to load for at least 30 min in 37 °C incubator.
- Remove chip from incubator and aspirate media from each well.
- Remove binder clips and bottomless 96-well plate; hold the chip with the glass plate at an angle and gently rinse with 1x PBS to remove excess cells on agarose.
- Check cell loading using a bright field microscope with a 4X objective lens. If insufficient loading is observed, repeat from step 2.1.
- Place loaded chip on an even surface (lab bench). Overlay chip with 1% low melting point (LMP) agarose that is pre-warmed at 37 °C. Use approximately 2–3 ml of LMP agarose is needed for each chip.
- Allow overlay to solidify first at RT for 3 min and then move to 4 °C refrigerator for 5 min for complete gelation.
3. Dosing and Repair
NOTE: To study baseline DNA damage level, skip to Step 4.
- Carefully align the wells of the chip (created from previous clamping) with the wells of a new bottomless 96-well plate. Re-press the bottomless 96-well plate on top and secure clamping with binder clips.
- Add 100 μl of chemical of desired dose to each well of the 96-well plate; perform dosing/treatment on ice or in 4 °C refrigerator for desired amount of time.
- After dosing, aspirate chemicals from each well and rinse away residual chemical using 1x PBS. If direct damage is studied here, proceed to Step 4.
- To study repair kinetics, allow cells in the chip to repair in media at 37 °C. Lyse (proceed to Step 4) at specific time points.
NOTE: Repair can be performed on-chip with a bottomless 96-well plate attached, or the chip can be cut into separate pieces after removal of the bottomless 96-well plate.
4. Lysis
- To perform alkaline comet assay:
- Make working alkaline lysis buffer by adding 1% Triton X-100 to alkaline lysis stock solution (2.5 M NaCl, 100 mM Na2EDTA, 10 mM Tris, pH 10). Prepare approximately 25 ml of working lysis buffer for each chip.
- Pre-chill working alkaline lysis buffer at 4 °C.
- Submerge chip in cool working alkaline lysis buffer and allow lysis to perform O/N in 4 °C refrigerator.
- To perform neutral comet assay:
- Make working neutral lysis buffer by adding 1% Triton X-100 and 10% DMSO to neutral lysis stock solution (2.5 M NaCl, 100 mM Na2EDTA, 10 mM Tris, 1% N-Lauroylsarcosine, pH 9.5). Prepare approximately 25 ml working lysis buffer for each chip.
- Pre-warm working neutral lysis buffer at 43 °C.
- Submerge chip in warm working neutral lysis buffer and allow lysis to perform O/N in 43 °C incubator.
5. Electrophoresis
- To perform alkaline comet assay:
- Remove lysis buffer and quickly rinse chip with 1x PBS.
- Secure chip in an electrophoresis chamber with gel film side facing down using double-sided tape.
- Bring the chamber to a 4 °C cold room.
- Fill the chamber with cold alkaline electrophoresis buffer (0.3 M NaOH, 1 mM Na2EDTA) to a level that just covers the gel.
- Allow for alkaline unwinding for 40 min.
- Run electrophoresis at 1 V/cm and 300 mA for 30 min in the cold room. Adjust the volume of electrophoresis buffer in the chamber to achieve desired running current.
- To perform neutral comet assay:
- Remove lysis buffer and rinse chip with neutral electrophoresis buffer (2 mM Na2EDTA, 90 mM Tris, 90 mM boric acid, pH 8.5) for 2 x 15 min at 4 °C.
- Secure chip in an electrophoresis chamber with gel film side facing down using double-sided tape.
- Bring the chamber to a 4 °C cold room.
- Fill the chamber with cold neutral electrophoresis buffer (2 mM Na2EDTA, 90 mM Tris, 90 mM boric acid, pH 8.5) to a level that just covers the gel.
- Allow the gel to sit in cold room for 60 min.
- Run electrophoresis at 0.6 V/cm and 6 mA for 60 min in the cold room. Adjust the volume of electrophoresis buffer in the chamber to achieve desired running current.
6. Fluorescent Imaging
- Remove chip from electrophoresis chamber from cold room.
- Neutralize the gels in neutralization buffer (0.4 M Tris, pH 7.5) for 2 x 15 min in 4 °C refrigerator.
- Stain the chip with fluorescent DNA stain of choice (i.e., SYBR Gold, Ethidium Bromide) under factory recommended procedures. Image using fluorescent microscopy.
7. Data Analysis
Analyze comet Images by standard comet assay software such as Komet 5.5.
Results
In this first example, we describe the approach for quantifying initial levels of DNA damage in human lymphoblastoid cells after exposure to oxidative damage using H2O2. In order to assess H2O2-induced base lesions and single strand breaks, alkaline comet conditions are used. After loading is complete and cells have been encapsulated with the agarose overlay, a bottomless 96-well plate is pressed onto the surface to create 96-compartments on the chip. Each of the 96-wells can be dosed with a different type or concentration of chemicals. Here four different doses of H2O2 were used and 1x PBS was used as the negative control. Representative images of arrayed comets are shown in Figure 1A, where non-treated (top), 50 μM (middle) and 100 μM (bottom) H2O2-exposed samples demonstrated different levels of comet tails. Analysis of comet images can be performed using commercially available software, which generally quantifies damage levels based on the total fluorescence intensity and migration distance of each comet tail. Measurements are commonly performed on 50 to 100 comets per condition and the median value (either % tail DNA or tail length) is calculated. Figure 1B illustrates the percentage tail DNA response curve analyzed from the TK6 lymphoblastoid cell comets exposed to four different concentrations of H2O2. The consistency among independent experiments demonstrates the efficacy of this approach in assessing DNA damage response from various levels of chemical treatments in cells.
To learn about variation among samples (e.g., among macrowells) and among repeats of the same experiment, inter-sample and inter-experimental variability was plotted in Figure 2A and 2B respectively. Within each experiment, each well of the 96-well chip is equivalent to a different sample and hence the well-to-well variation reveals the inter-sample variation of the device. Here, TK6 cells loaded in 12 wells of the 96-well chip were treated with the same dose of H2O2 and immediately lysed after treatment. All other experimental steps were performed in parallel and the medians of at least 50 comets from each macrowell were plotted in Figure 2A. The average of the medians is 77.53% DNA in tail, with standard deviation is 3.99%. From these data, we compute that the coefficient of variation among samples is 5.2%, which is several fold lower than the traditional assay, demonstrating the improved robustness of this assay6,16. To learn about the reproducibility of the assay, we exposed TK6 cells in a chip with 75 μM H2O2 and analyze the immediate level of DNA damage. This experiment was repeated six times and data of each experiment was plotted in Figure 2B. Under identical experimental conditions, we obtained results ranging from 41.76% to 57.87%, shown as grey bars in the figure. The average of six repeats is 49.57%, with standard error of the mean of only 2.04%. The low variation among repeats implies that the comet assay performed on this novel device is highly reproducible.
To evaluate repair kinetics, cells are allowed to repair their DNA in fresh media after treatment. Lysing macrowells at various time points reveals the change in DNA damage over time. An example is shown in Figure 3. In this experiment, TK6 cells were first encapsulated in the chip, treated with 50 μM H2O2, and allowed to repair up to 60 min post-exposure. Cells were lysed at 0, 20, 45 and 60 min respectively. Representative comet images at different time points are shown in Figure 3A, and the change in DNA damage levels over time is plotted in Figure 3B. This data revealed that nearly all of the damage is repaired within 45 min post H2O2 treatment. Many variables can affect the rate of repair, including the type of cell line and chemical agent used. Hence researchers can make alterations to the protocol (i.e., extending repair time) to accommodate additional needs in their investigations. Here we provide another example of repair experiment using this chip, wherein TK6 cells are challenged with a different genotoxic agent N-Methyl-N’-Nitro-N-Nitrosoguanidine (MNNG) is an alkylating agent known to induce base lesions including 7-methylguanine and 3-methyladenine. These lesions are converted to abasic sites either by spontaneous depurination or by enzymatic removal by DNA glycosylases. The resulting abasic site can be cleaved under alkaline conditions and thus detected on the chip. Initial exposure causes a significant increase in damage, evident from the long tails, and over time these tails are reduced as the cells restore intact DNA during repair. Although alkylation and oxidative damage are both primarily repaired by the base excision repair pathway, the amount of lesions generated and the proteins involved in repair vary. These variations can lead to different rates of conversion to abasic sites, as well as different rates of repair of the resulting abasic sites. In Figure 4, repair kinetics of TK6 cells exposed to 0.1, 1, and 3 µg/ml of MNNG are shown. In this experiment, we extended the experiment time to 2 hr post-exposure because MNNG-induced damage appears to persist longer and is cleared at a slower rate compared to H2O2-induced damage.
Analysis of DSBs using neutral conditions is very similar to the protocol for the analysis of single-strand lesions using the alkaline conditions. To show initial damage levels, TK6 cells were exposed to variable levels of gIR, and the resulting cells were lysed and electrophoresed at a neutral pH (Figure 5A). It is noteworthy that the morphology of the comet tails is different from the alkaline assay conditions. To achieve observable fragmented DNA using this assay, the IR dose used is significantly higher (0-100 Gy) than the dose required to see damage using the alkaline conditions. In addition, we found that the tail length is the most sensitive parameter in reflecting the extent of DNA damage when using the neutral comet assay7. The analyzed dose response curve is illustrated in Figure 5B. Repair of DNA double strand breaks in cells can also be assessed, and has been shown by Weingeist et. al.7. Taken together, the neutral CometChip offers a valuable tool for high throughput analysis of DNA DSBs.

Figure 1. H2O2 dose response of TK6 cells using alkaline comet assay. (A) Arrayed microwell comets from untreated TK6 lymphoblasts (top) and TK6 cells exposed to 50 μM (middle) and 100 μM (bottom) H2O2 for 20 min at 4 °C. Scale bar is 100 μm. (B) H2O2 dose response of TK6 cells exposed to various level of H2O2. Each data point is the average of three independent experiments, where the median percentage tail DNA of at least 50 individual comets was obtained in each experiment. Error bars represent the standard error of the mean from three independent experiments. Please click here to view a larger version of this figure.
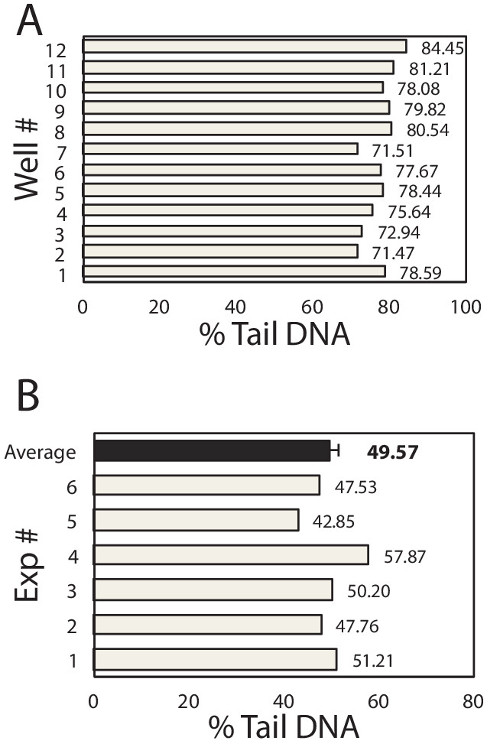
Figure 2. Inter-Sample and Inter-Experimental Variability. (A) Sample-to-Sample variation. TK6 human lymphoblast cells were loaded into 12 wells of the 96-well chip. Each well was exposed to 100 μl of 50 μM H2O2 for 20 min at 4 °C. Cell were immediately lysed and assayed for % Tail DNA. Data of each well is shown here. Each box represents the median at least 50 individual comets from each well. The mean of 12 wells is 77.53%, standard deviation is 3.99%, and the coefficient of variation is computed to be 5.2%. (B) Experiment-to-Experiment variation. TK6 human lymphoblast cells were loaded into the 96-well chip, exposed to 100 μl of 75 μM H2O2 for 20 min at 4 °C. Cell were immediately lysed and assayed for % Tail DNA. The same experiment was repeated 6 times and data of each repeat is shown as a grey bar. Each box represents the median % tail DNA of at least 100 individual comets from each repeat. The average of 6 repeats is 49.57%, shown as the back bar here. The standard deviation of 6 repeats is 4.99%, and the standard error of the mean is computed to be 2.04%, represented as the error bar in the figure.

Figure 3. Repair of H2O2-induced damage in TK6 lymphoblasts. (A) Schematic of repair study with representative comets. TK6 cells are treated with damaging agents and allowed to repair in media at 37 °C before lysis. (B) Repair kinetics of TK6 cells after treatment with 50 μM H2O2 for 20 min at 4 °C. Each data point is the average of three independent experiments, where the median percentage tail DNA of at least 50 individual comets was obtained in each experiment. Error bars represent the standard error of the mean from repeating experiments. Please click here to view a larger version of this figure.
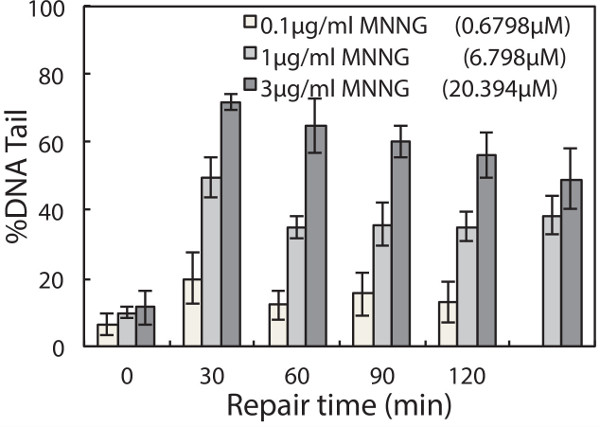
Figure 4. Repair of MNNG-induced damage in TK6 lymphoblasts. TK6 cells are treated with 0.1, 1, and 3 µg/ml MNNG for 30 min at 4 °C and allowed to repair in media at 37 °C up to 120 min post exposure. The median percentage tail DNA of at least 50 individual comets was obtained for each of three independent experiments. Error bars represent the standard error of the mean from three independent experiments.
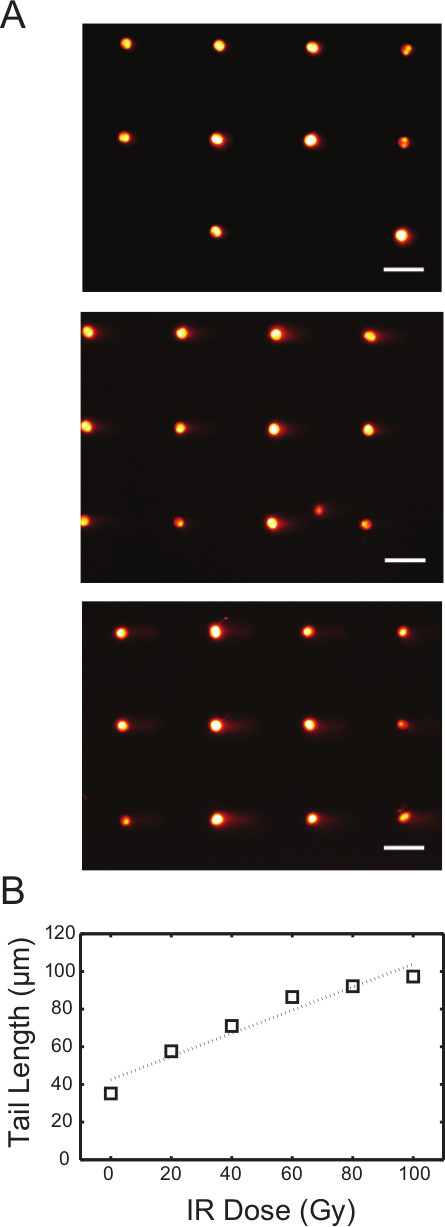
Figure 5. IR dose response of TK6 cells using neutral comet assay. (A) Arrayed microwell comets from untreated TK6 lymphoblasts (top) and TK6 cells exposed to 40 Gy (middle) and 80 Gy (bottom) gamma irradiation. Scale bar is 100 μm. (B) IR dose response of TK6 cells exposed to various level of gamma irradiation. Each data point represents the median tail length (μm) of at least 300 comets pooled from six macrowells on the chip. Please click here to view a larger version of this figure.
Discussion
Ubiquitous genotoxins in the environment and also within human cells exert inevitable stress and damage to cellular DNA. In fact, it has been estimated that there are 1,000s of DNA lesions present in human cells at steady state18. Understanding damage susceptibility and repair kinetics in humans not only brings insight to basic research, but also benefits drug development. Ironically, despite the ability of DNA damage to promote cancer, DNA damaging agents are used at very high levels to treat cancer, making knowledge about DNA damage and repair relevant to personalized medicine. The CometChip is a novel research device that utilizes microfabrication practices to revolutionize a long-existed DNA damage assay. Building on the same principles of the traditional comet assay, the chip provides significantly higher throughput and better reproducibility. We describe here methods for using this chip. To clarify its utility and robustness, we show results from several experiments where the chip has been used to assess damage induced by several different DNA damaging agents, and where it has been used to evaluate DNA repair. Together, results presented here provide helpful information for using the chip and demonstrate its broad applicability to research on DNA damage and repair.
One of the most important steps in this protocol is to accomplish effective cell loading. Many cell lines have been tested on this system, including both suspension and adherent cells. Loading efficiency depends on many variables such as cell type, cell size, loading concentration and time. Suspension cell lines such as lymphoblastoid cells are the easiest to work with. Concentration of the cell suspension can vary from 104 to 106 cells per 96-well and loading usually completes in 15–30 min. Higher cell density facilitates loading and shortens the amount of time required for cells to settle into the microwells.
Loading parameters for adherent cells can differ from suspension cells. Cell lines such as Chinese Hamster Ovarian (CHO) cells, were found to have similar loading efficiency as suspension cells (following trypsinization) and thus use similar loading conditions. Other cell types, such as tumor cells that easily form cell aggregates in suspension, require additional handling. Passing cell suspensions through a single cell filter and adding trypsin to the suspension media can suppress the formation of cell clusters during loading. Finally, in terms of loading time, the time required for capturing adherent cell lines in microwells can vary from 20 min to 1 hr. As a result, it is recommended that users perform pilot experiments to determine optimal loading conditions before proceeding to further investigations. Loading efficacy can be visualized under a bright field microscope or more accurately revealed by staining the encapsulated cells with DAPI or other DNA stains prior to evaluation under the fluorescent microscope.
One major advantage of this method and chip is versatility. First, researchers are not restricted to a specific working cell concentration because excess cells are washed away, and the microarray ensures uniform comet-density. Second, the microwells can be made with variable sizes to accommodate cell types of different sizes. Under circumstances that multiple cells are captured in a single microwell, multi-cell comets are self-calibrated and yield consistent results compared to single cell comets6,7. Another benefit of patterning cells in a microarray is that all comets are then at the same focal plane with fixed positions, reducing noise due to unfocused comets and facilitating automated imaging and analysis. The significant improvements in throughput and sensitivity provided by the CometChip enable the application of the assay for large-scaled studies. Taken together, the chip provides a valuable tool for DNA damage assessment for researchers, toxicologists, clinicians and epidemiologists.
While the comet assay is known for its excellent sensitivity in detecting a broad range of DNA damage, this assay also suffers from low specificity. Using this protocol greatly improves the reproducibility and throughput of the assay, but does not demonstrate advancement in specificity. Nonetheless, multiplexing the assay with other methodologies has been reported to be effective in achieving higher specificity. One example is the inclusion of purified lesion-specific enzymes. These enzymes can convert otherwise undetectable base lesions into detectable strand breaks and abasic sites1,19-21. A widely used example is the repair endonuclease formamidopyrimidine-DNA glycosylase (Fpg), which reveals oxidative DNA modifications19,22. Because the enzyme digestion step is applied after cell lysis, the system can be treated the same way as a traditional agarose slide without alterations to the protocol. Although the detailed protocol is not described here, this approach has been adapted by many traditional comet assay users in the past and the protocols can be readily found. In a previous publication, we used this method to identify fluorescent light-induced damage 22 .
The major advantage of this method is the throughput it provides, which opens doors to studies that were previously virtually impossible. The ability to process 96 samples on the same platform not only reduces labor and time, but also reduces experimental noises and greatly enhances reproducibility. Inter sample variation is significantly lower than the traditional slide-to-slide variation, which can be 2 fold higher than the variation observed with this chip6,7. Reduced noise also leads to improved sensitivity, enabling detection of more subtle differences among samples. Because the device employs a standard 96-well format, it is compatible with general research equipment and HTS technologies. Consider a study that requires evaluation of 100 samples, assuming that an average researcher can process ~30 glass slides over the course of several days. Given that each sample needs to be performed in triplicate, it would take approximately one month to complete such a study, which would also inevitably suffer from sample to sample variation. In contrast, processing 100 conditions, each in triplicate, with this chip requires only a few plates and can be performed in three days. This major improvement in throughput opens the door to studies that were previously unattainable.
The protocol presented here describes both the basic procedures for performing the standard comet assay and the modified steps required to use the CometChip platform. With the ability to measure both inherent DNA damage levels and the subsequent repair response, the assay is highly relevant to a variety of biological and clinical applications. Information on the impact of specific chemical exposures on the genome facilitates disease prevention and treatment. Furthermore, there is also significant interest in determining variations in DNA damage sensitivity and repair capacity among individuals23,24. This technique provides the throughput required for such large-scale studies. Knowledge about inter-individual variations is critical for identifying susceptible people and for designing individualized therapies or preventions strategies. Taken together, the technology presented here provides a high throughput, objective and quantitative DNA damage analysis platform that has the potential to become a standard methodology in near future.
Disclosures
The CometChip has been licensed to Trevigen, Inc. based upon a patent submission that includes Wood, Weingeist, Bhatia and Engelward.
Acknowledgements
This work was primarily support by 5-UO1-ES016045 with partial support from 1-R21-ES019498 and R44-ES021116. DMW was supported by the NIEHS Training Grant in Environmental Toxicology T32-ES007020. Equipment was provided by the Center for Environmental Health Sciences P30-ES002109.
Materials
| Name | Company | Catalog Number | Comments |
|---|---|---|---|
| UltraPure LMP Agarose (low melting point) | Invitrogen | 16520 | Multiple suppliers |
| Dulbecco's phosphate buffered saline (PBS) 1x | Gibco by life technologies | 14190 | Multiple suppliers |
| Crystalline NaCl | Macron Chemicals | 7581-06 | Multiple suppliers |
| Crystalline Na2EDTA | Macron Chemicals | 4931-04 | Multiple suppliers, Irritant |
| Crystalline Tris (base) | Sigma-Aldrich | T1503 | Multiple suppliers, Irritant |
| Crystalline Tris (acid) | J.T.Baker | 4106 | Multiple suppliers |
| Crystalline N-lauroylsarcosine | Sigma-Aldrich | L9150 | Multiple suppliers, Highly toxic by inhalation, Irritant |
| Triton X-100 | Sigma-Aldrich | X100 | Multiple suppliers, Harmful by ingestion., Irritant |
| Dimethyl sulfoxide (DMSO) | Sigma-Aldrich | D4540 | Multiple suppliers, Combustible Liquid, Target Organ Effect |
| Crystalline NaOH | Macron Chemicals | 7708-06 | Multiple suppliers, Corrosive |
| Hydrochloric acid | VWR | BDH3871 | Multiple suppliers, Corrosive |
| Crystalline boric acid | Sigma-Aldrich | B6768 | Multiple suppliers, Target Organ Effect, Teratogen, Reproductive hazard |
| CometChip | Trevigen | Under development for distribution, contact Trevigen directly to obtain materials necessary | |
| 1-well dish | Thomas Scientific | 73521-420 | |
| Bottomless 96-well plate | VWR | 655000-06 | |
| 1.5' binder clips | Staples | Multiple suppliers | |
| Glass plate | Tag Hardware | Customized to size of 96-well plate | |
| Owl Horizontal Electrophoresis System | VWR | 27372-131 | Multiple suppliers |
| PowerPac Basic Power Supply | Bio-Rad | 164-5050 | Multiple suppliers |
References
- Collins, A. R. The Comet Assay for DNA Damage and Repair Principles, Applications, and Limitations. Molecular biotechnology. 26 (3), (2004).
- Olive, P. L., Banáth, J. P. The comet assay a method to measure DNA damage in individual cells. Nature. 1 (1), 23-29 (2006).
- Ostling, O., Johanson, K. J. Microelectrophoretic study of radiation induced DNA damages in individual mammalian cells. Biochemical and biophysical research communications. 123 (1), 291-298 (1984).
- Singh, N. P., McCoy, M. T., Tice, R. R., Schneider, E. L. A simple technique for quantitation of low levels of DNA damage in individual cells. Experimental cell research. 175 (1), 184-191 (1988).
- Collins, A. R. The comet assay for DNA damage and repair: principles, applications, and limitations. Molecular biotechnology. 26 (3), 249-261 (2004).
- Wood, D. K., Weingeist, D. M., Bhatia, S. N., Engelward, B. P. Single cell trapping and DNA damage analysis using microwell arrays. Proceedings of the National Academy of Sciences of the United States of America. 107 (22), 10008-10013 (2010).
- Weingeist, D. M., et al. Single-cell microarray enables high-throughput evaluation of DNA double-strand breaks and DNA repair inhibitors. Cell cycle. 12 (6), 907-915 (2013).
- Brendler-Schwaab, S., Hartmann, A., Pfuhler, S., Speit, G. The in vivo comet assay: use and status in genotoxicity testing. Mutagenesis. 20 (4), 245-254 (2005).
- Witte, I., Plappert, U., de Wall, H., Hartmann, A. Genetic toxicity assessment: employing the best science for human safety evaluation part III: the comet assay as an alternative to in vitro clastogenicity tests for early drug candidate selection. Toxicological sciences : an official journal of the Society of Toxicology. 97 (1), 21-26 (2007).
- Valverde, M., Rojas, E. Environmental and occupational biomonitoring using the Comet assay. Mutation research. 681 (1), 93-109 (2009).
- Møller, P. Genotoxicity of environmental agents assessed by the alkaline comet assay. Basic & clinical pharmacology & toxicology. 96, Suppl 1.. 1-42 (2005).
- Dusinska, M., Collins, A. R. The comet assay in human biomonitoring: gene-environment interactions. Mutagenesis. 23 (3), 191-205 (2008).
- Dhawan, A., Bajpayee, M., Parmar, D. Comet assay: a reliable tool for the assessment of DNA damage in different models. Cell biology and toxicology. 25 (1), 5-32 (2009).
- McKenna, D. J., McKeown, S. R., McKelvey-Martin, V. J. Potential use of the comet assay in the clinical management of cancer. Mutagenesis. 23 (3), 183-190 (2008).
- Cadet, J., Douki, T., Ravanat, J. -L. Oxidatively generated damage to the guanine moiety of DNA: mechanistic aspects and formation in cells. Accounts of chemical research. 41 (8), 1075-1083 (2008).
- Forchhammer, L., et al. Variation in the measurement of DNA damage by comet assay measured by the ECVAG† inter-laboratory validation trial. Mutagenesis. 25 (2), 113-123 (2010).
- Olive, P. L., Wlodek, D., Banáth, J. P. DNA double-strand breaks measured in individual cells subjected to gel electrophoresis. Cancer research. 51 (17), 4671-4676 (1991).
- Frelon, S., Douki, T., Ravanat, J. L., Pouget, J. P., Tornabene, C., Cadet, J. High-performance liquid chromatography--tandem mass spectrometry measurement of radiation-induced base damage to isolated and cellular DNA. Chemical research in toxicology. 13 (10), 1002-1010 (2000).
- Georgakilas, A. G., Holt, S. M., Hair, J. M., Loftin, C. W. Measurement of oxidatively-induced clustered DNA lesions using a novel adaptation of single cell gel electrophoresis (comet assay). Current protocols in cell biology. , Suppl Chapter 6, Unit 6.11.. (2010).
- Fortini, P., Raspaglio, G., Falchi, M., Dogliotti, E. Analysis of DNA alkylation damage and repair in mammalian cells by the comet assay. Mutagenesis. 11 (2), 169-175 (1996).
- Collins, A. R., Dusinská, M., Horská, A. Detection of alkylation damage in human lymphocyte DNA with the comet assay. Acta biochimica Polonica. 48 (3), 611-614 (2001).
- Ge, J., et al. Standard fluorescent imaging of live cells is highly genotoxic. Cytometry Part A : the journal of the International Society for Analytical Cytology. 83 (6), 552-560 (2013).
- Trzeciak, A. R., Barnes, J., Evans, M. K. A modified alkaline comet assay for measuring DNA repair capacity in human populations. Radiation research. 169 (1), 110-121 (2008).
- Marcon, F., Andreoli, C., Rossi, S., Verdina, A., Galati, R., Crebelli, R. Assessment of individual sensitivity to ionizing radiation and DNA repair efficiency in a healthy population. Mutation research. 541 (1-2), 1-8 (2003).
Reprints and Permissions
