Precise measurement of neurological and neuropsychological impairment and disability in multiple sclerosis is challenging. We report methodologic details on a new test, the Multiple Sclerosis Performance Test (MSPT). This new approach to the objective of quantification of MS related disability provides a computer-based platform for precise, valid measurement of MS severity.
Method Article
The Multiple Sclerosis Performance Test (MSPT): An iPad-Based Disability Assessment Tool
In This Article
Summary
Abstract
Precise measurement of neurological and neuropsychological impairment and disability in multiple sclerosis is challenging. We report a new test, the Multiple Sclerosis Performance Test (MSPT), which represents a new approach to quantifying MS related disability. The MSPT takes advantage of advances in computer technology, information technology, biomechanics, and clinical measurement science. The resulting MSPT represents a computer-based platform for precise, valid measurement of MS severity. Based on, but extending the Multiple Sclerosis Functional Composite (MSFC), the MSPT provides precise, quantitative data on walking speed, balance, manual dexterity, visual function, and cognitive processing speed. The MSPT was tested by 51 MS patients and 49 healthy controls (HC). MSPT scores were highly reproducible, correlated strongly with technician-administered test scores, discriminated MS from HC and severe from mild MS, and correlated with patient reported outcomes. Measures of reliability, sensitivity, and clinical meaning for MSPT scores were favorable compared with technician-based testing. The MSPT is a potentially transformative approach for collecting MS disability outcome data for patient care and research. Because the testing is computer-based, test performance can be analyzed in traditional or novel ways and data can be directly entered into research or clinical databases. The MSPT could be widely disseminated to clinicians in practice settings who are not connected to clinical trial performance sites or who are practicing in rural settings, drastically improving access to clinical trials for clinicians and patients. The MSPT could be adapted to out of clinic settings, like the patient’s home, thereby providing more meaningful real world data. The MSPT represents a new paradigm for neuroperformance testing. This method could have the same transformative effect on clinical care and research in MS as standardized computer-adapted testing has had in the education field, with clear potential to accelerate progress in clinical care and research.
Introduction
Multiple sclerosis (MS) is an inflammatory disease of the central nervous system (CNS) affecting young adults, particularly women. Foci of inflammation occur unpredictably and intermittently in optic nerves, brain, and spinal cord. Episodic symptoms, termed relapses, characterize the early relapsing remitting stage of MS (RRMS). During the RRMS disease stage, irreversible CNS tissue injury accumulates, manifest as progressive brain atrophy and neurological disability. Brain atrophy in MS begins early in the disease and proceeds 2-8x faster than age and gender matched healthy controls1. Presumably because of brain reserve, and other compensatory mechanisms, clinically-significant neurological disability is generally delayed for years, typically for 10-20 years after symptom onset. During more advanced stages of MS, termed secondary progressive MS (SPMS), relapses occur less frequently or disappear entirely, but gradually worsening neurological disability ensues, and patients experience some combination of difficulty with walking, arm function, vision, or cognition.
Quantifying MS clinical disease activity and progression is challenging for a variety of reasons. First, clinical manifestations vary widely in different MS patients. Second, disease activity varies significantly over time in individual MS patients. Third, MS manifestations vary in early compared with late disease stages. Lastly, neurological and neuropsychological impairment and disability are inherently difficult to quantify. This topic has been reviewed periodically over the past 20 years2-4. One standard measure used in patient care and research is the number or frequency of relapses. The relapse rate has been used as the primary outcome measure for the vast majority of clinical trials for RRMS. Reduction in relapse rate has supported approval of 10 disease-modifying drugs across 6 drug classes. The number of relapses only weakly correlates with later clinically-significant disability, however, and it has proven difficult to accurately quantify relapse severity or recovery from relapse. The standard clinical disability scale – Kurtzke’s Expanded Disability Status Scale (EDSS)5– is a 20 point ordinal scale ranging from 0 (normal neurological exam) to 10 (dead from MS). From 0–4.0, EDSS is determined by the combination of scores on 7 functional systems. From 4.0–6.0 EDSS is determined by the ability to walk a distance. EDSS 6.0 is the need for unilateral walking assistance. EDSS 6.5 is the need for bilateral walking assistance. Nonambulatory patients are scored EDSS ≥7.0, with higher number reflecting increasing difficulty with mobility and ability to perform self-care. The EDSS has achieved world-wide acceptance by regulatory agencies as an acceptable disability measure for MS clinical trials, based partly on its long-standing use in the MS field, and familiarity to neurologists, but there are a number of limitations2,6. EDSS has been criticized as being non-linear, imprecise at the lower end of the scale, insensitive at the middle and upper ends, and too heavily dependent on ambulation.
Based on perceived shortcomings of the EDSS, an alternative approach to quantifying disability in MS patients was recommended in 1997 by a Task Force of the National Multiple Sclerosis Society (NMSS)7,8. This Task Force recommended a 3 part composite scale, the Multiple Sclerosis Functional Composite (MSFC), for MS clinical trials. As initially recommended, the MSFC consisted of a timed measure of walking (the 25 ft timed walk [WST]), a timed measure of arm function (the 9 hole peg test [9HPT]), and a measure of information processing speed (the 3 sec version of the Paced Auditory Serial Addition Test – PASAT-39,10). Each measure was normalized to a reference population to create a component z-score, and the individual z-scores were averaged to create a composite score representing the severity of the individual patient relative to the reference population. The MSFC has not been accepted by regulatory agencies as a primary disability outcome measure, in part because the clinical meaning of a z-score or z-score change has not been clear. Also, the MSFC has been criticized because it lacks a visual function measure and because the PASAT is poorly accepted by patients. In response to these perceived shortcomings, an expert group11, convened by the National MS Society, recommended two modifications to the MSFC: 1) inclusion of the Sloan Low Contrast Letter Acuity test12 and 2) replacement of the PASAT-3 with the oral version of the Symbol Digit Modalities Test (SDMT)13,14. This expert group also recommended that the revised MSFC become the primary disability outcome measure to replace the EDSS in future MS clinical trials11. An effort is currently underway to achieve regulatory agency acceptance of a new disability outcome measure, based on quantitative measures of neuroperformance15.
It is clear that new methods are needed to improve outcomes assessment in the MS field. This paper describes development of a novel clinical disability outcome assessment tool, the Multiple Sclerosis Performance Test (MSPT), which builds on the MSFC approach, but which also merges advances in computer and information technology, biomechanics, human performance testing, and distance health. The MSPT application uses the iPad as a data collection platform to assess balance, walking speed, manual dexterity, visual function, and cognition. The MSPT can be performed in a clinical setting, or by the MS patient themself in a home setting. Data can be transmitted from a distance and entered directly into a clinical or research database, potentially obviating the need for a clinic visit. This advantage is particularly important for individuals with disabling neurological conditions such as MS. Finally, because the MSPT is computer based, various analyses are feasible, unlike technician administered performance testing. This paper describes the design and initial application of the MSPT.
Protocol
Development of the MSPT and initial application was approved by the Cleveland Clinic Institutional Review Board. MS patients and HCs signed approved Informed Consent Documents prior to testing MSPT.
1. General Aspects of Method Development
The tablet used for this protocol is the Apple iPad, a powerful computing device with high quality inertial sensors embedded within the device. These various sensors packaged in a compact, affordable device provide an ideal platform for multi-sensor test administration.
- For measuring rotation rates, utilize an embedded 3-axis gyrometer with a range of ±250 degrees per sec at a resolution of 8.75 millidegrees per sec at a maximum sampling rate of 100 Hz. Use a 3-axis linear accelerometer with a range of ±2.0 g at a resolution of 0.9-1.1 mg at a sampling rate of 100 Hz to capture linear acceleration.
- Ensure the device also has a high-resolution capacitive multi-point touch screen in which X and Y position data are sampled at 60 Hz while recognizing up to 11 separate contact points simultaneously.
- Write the MSPT app in Objective-C, a general purpose high level object-oriented programming language that is used in Apple's Mac OS X and iOS operating systems.
- NOTE: Using this approach to software development allows an advantageous use of future advances in hardware while keeping collected data consistent. The program has been previously written and validated by a team of engineers through Xcode, an Objective-C compiler.
2. Design and Testing of the Multiple Sclerosis Performance Test (MSPT)
Prepare the MSPT on the iPad to include five performance modules as follows: 1) Walking Speed, designed to simulate the WST; 2) Balance Test; 3) Manual Dexterity Test (MDT) for upper extremity function, designed to simulate the 9HPT; 4) Processing Speed Test (PST), designed to simulate the SDMT; and 5) Low contrast letter acuity test (LCLA), designed to simulate standard Sloan LCLA charts12 (Table 1).
- Walking Speed Test (WST)
- This test is based on the WST, which is part of the traditional MSFC.
- Place the tablet on the subject’s lower back at sacral level (Figure 1).
- Recommend that the subject use any usual assistive device (e.g., cane, walker, brace) for walking. Ask the subject to ensure the tablet volume is turned up for this test and the tablet is facing outwards on the belt and positioned on their back.
- Have the patient stand just behind the start line. Instruct the patient that they should begin walking when the technician hits the start button and issues the command to start.
- Press the start button and observe the patient as they walk the 25 ft to the finish line as quickly and safely as possible. Ensure that the patient does not slow down until after passing the finish line. When they pass the finish line, hit the tablet stop button.
- Sample and collect data from the tablet to quantify the time required to complete the WST.
- Balance Test
This test is designed to provide objective clinical data regarding the integration of sensory information in maintaining postural stability.- Affix the tablet to the subject’s lower back at approximately sacral level (Figure 1).
- Ask the subject to ensure the volume is turned up for these tests. Inform them that the test consists of two 30 sec trials.
- For the first trial, have the subject stand with their hands positioned on their hips, keep both feet together and balance. Instruct the subject that if they move out of the stance, regain balance, and get back into testing position as quickly as possible.
- Observe the subject as they balance for 30 sec and record any of the following errors: Hands off hips; opening at eyes; step or stumble; lifting toe or heel off ground; staying out of position for more than 5 sec; bending at the waist.
- For the second trial, repeat steps 2.2.2.1 and 2.2.2.2 and have the subject keep their eyes closed.
- Use the data obtained to quantify movement of the subject’s center of gravity throughout the two trials as a measure of postural stability. Utilize a MATLAB script to determine center of gravity movement through computer analysis of the inertial data.
Traditionally, an error counting system is employed to assess balance performance, but this measure is dependent on evaluator judgment, and is plagued by inter- and intra-rater reliability issues.
- Manual Dexterity Test (Figure 2)
The MDT is designed to quantify manual dexterity during the performance of an upper extremity task by simulating the 9HPT. The module has two variations in terms of initial peg position. In the first variation, called the “dish” version, the 9 pegs originate in a shallow dish with the same dimensions as the standard 9HPT apparatus. The pegs are inserted into the 9 holes, then returned to the dish exactly as with the 9HPT. The alternative test, called the row version, starts with the pegs inserted in a home row located 7.1 cm from the middle of the center insertion holes. Pegs are removed from the row, inserted into the holes, then moved to the dish to complete the test.- MDT Dish test.
- Place the pegs in the starting dish.
- Instruct the patient to perform the peg task as quickly as possible. Inform them that if a peg falls onto the table they retrieve it and continue with the task but if a peg falls on the floor, they should keep working on the task and the technician will retrieve it.
- Have the participant picks up the pegs one at a time, using only one hand, and put them into the holes in any order until the holes are filled. Note: the non-dominant hand can be used to steady the peg board.
- Then, without pausing, have the participant remove the pegs one at a time, return them to the container, and touch the tablet screen upon task completion.
- Observe the participant repeat this task two times with each hand, starting with the dominant hand.
- MDT Row test.
- Place the pegs in the starting home row positions, 7.1 cm from the middle of the center insertion holes.
- Perform this test by following steps 2.3.1.2 to 2.3.1.5.
- Use the capacitive touch screen of the tablet to determine the exact time of insertion and removal of each pin. Determine the total time to complete one cycle of insertion and removal of all 9 pegs for each version of the test.
- MDT Dish test.
- The Low Contrast Letter Acuity Test (LCLAT)
The LCLAT is based on standard Sloan LCLA charts12. For the iPad version (Figure 3), contrast levels of 10% and 5% are shown, in addition to the 2.5% and 1.25% gradient levels used for traditional technician-administered testing.- Have the participant sit. Hold or mount the tablet 5 ft away from them at eye level. Dim the lights or re-position the patient to minimize any glare.
- For each trial, ask the participant to identify five letters displayed in a row on the screen. Observe as the participant attempts to identify the letters in order from left to right. Score the trial based on the number of letters correctly identified out of the five presented. Continue trials with smaller letters and determine the smallest letter size identifiable by the participant.
- Determine the number of letters correct at each contrast gradient level using the MSPT app, and compare with the performance on the Standard Sloan LCLA charts.
- The Processing Speed Test (PST) (Figure 4)
The PST is similar to the SDMT, which has been recommended as a replacement for the PASAT in the MSFC. The SDMT is a reliable and valid tool for assessing information processing speed14.- Prepare and test the patient as follows (using directions provided through the tablet):
- Show the patient a sample testing screen containing a symbol key (two lines of boxes at the top of the screen) and the test portion of the screen (two lines of boxes in the middle of the screen.
- Explain that, in the key, boxes in the top row contain symbols and boxes in the lower row contain corresponding numbers. Explain that in the test, the upper boxes display symbols, the lower boxes are empty and the task is to input the numbers corresponding to the symbols
- Observe the patient practicing the test. Initiate the practice round by pressing the “begin practice” button. Observe the patient select the appropriate numbers by lightly touching the keyboard at the bottom of the screen with only the index or pointing finger of their dominant hand.
- Inform the patient that, in the test, when they complete a row, a new row of symbols will appear. Instruct the patient to continue selecting numbers until told to stop and to move on from incorrect answers which cannot be changed. Ask the patient to complete the test as quickly and accurately as possible.
- Begin the test by pressing the “begin test” button. Observe the patient perform the test for 2 min. Determine the number of correct responses.
- Prepare and test the patient as follows (using directions provided through the tablet):
3. Validation
- Conduct a prospectively defined validation study to assess performance characteristics of the MSPT compared with traditional technician-based testing. Use this data to determine test-retest reliability, relationship to EDSS, disease stage, disease duration, patient-reported outcomes, and relationship to technician-administered neurological and neuropsychological testing.
The study presented here was conducted at a single site - The Mellen Center for Multiple Sclerosis Treatment and Research at the Cleveland Clinic. 51 MS patients representing a range of neurological disability and disease duration, and 49 age and gender matched HC were recruited for a single study visit. The inclusion criteria were as follows: healthy controls willing to participate in MSPT validation or a diagnosis of MS by International Panel Criteria16, ages 18-65, able to understand the purpose for the study and provide informed consent; ambulatory and able to walk 25 ft, with or without ambulation assistive device. - Utilize the following comparisons for validation:
- Compare the WST from the MSPT with the WST measured by a trained technician.
- Compare the MDT from the MSPT with the 9HPT measured by a trained technician.
- Compare the LCLAT test from the MSPT with the Sloan LCLA measured by a trained technician.
- Compare the PST from the MSPT with the SDMT measured by a trained technician.
- Compare the balance Test from the MSPT with balance testing by a trained technician using the Tetrax balance platform.
Validation results are provided for all testing except Balance Test, which will be reported elsewhere.
- Define the relationship between technician or MSPT testing and patient reported outcomes as correlations with the MS Performance Scales (MSPS)17,18. Additionally, collect Neuro-QOL PRO measures19 and work status (results to be reported elsewhere). The MSPS are validated patient reports of mobility, hand dexterity, vision, fatigue, cognition, bladder function, sensory function, spasticity, pain, depression, and tremor.
Results
MSPT testing methodology is illustrated by Figures 1-4 and demonstrated in the video.
We tested 51 MS patients and 49 HC (Table 2). They were well-matched for age, gender, race, and years of education. Disease duration in the MS patients, defined as time from first MS symptom, was 12.1 (9.1) years; EDSS was 3.9 (1.8); 74.5% were using MS disease modifying drugs; 29.4% had progressive forms of MS; and 43% were employed fulltime.
Reproducibility was tested for all measures by having each research subject perform each test twice, both during a morning test session, and during a second test session in the afternoon following a 2-4 hr rest period. Test-retest reproducibility was analyzed by inspecting visual plots (Figure 5), and by generating Concordance Correlation Coefficients. The figure shows reproducibility data for the technician (panels labeled 1) and MSPT (panels labeled 2) testing for the dimensions of walking (Figure 5A), upper extremity dexterity (Figure 5B), vision (Figure 5C), and cognitive processing speed (Figure 5D). For all patients, correlation coefficients for the walking test were 0.982 for the technician, and 0.961 for the MSPT; for the manual dexterity dimension, correlation coefficients were 0.921 for the technician and 0.911 for the MSPT; for the vision dimension (2.5% contrast level) they were 0.905 for the technician, and 0.925 for the MSPT; and for the cognitive processing speed dimension, they were 0.853 for the technician and 0.867 for the MSPT. Reproducibility was similar for MS and HCs.
Concurrent validity was tested by comparing the technician and iPad based testing for each of the 4 dimensions using Pearson Correlation Coefficients. Data in Table 3 shows strong correlations. Correlation coefficients exceeded 0.8 for all tests, and in many cases, correlation coefficients exceeded 0.9. Correlations were strong both for the morning and afternoon test sessions, and for both MS and HC.
Table 4 shows the ability of each test to distinguish MS from HC. Data from the morning and afternoon test sessions is shown. All tests distinguished between the two groups, although the MSPT vision testing was borderline significant. Sensitivity in distinguishing MS from HC was quantified using Cohen’s d as the measure of effect size. Effect sizes of 0.8 or higher are considered strong effects. All tests showed good ability to distinguish MS from HC, and the tablet testing generally compared favorably to the technician testing.
Within the MS group, technician and tablet testing for all 4 disease dimensions correlated significantly with EDSS score and disease duration. For EDSS, the strongest correlations were with the walking tests (technician WST r = 0.67; tablet WST r = 0.67). Correlations between the other tests and EDSS ranged from -0.37 (technician SLCLA, 2.5%) to 0.53 (tablet MDT). Correlations with disease duration ranged from r = -0.34 (technician SLCLA, 2.5%) to r = -0.46 (technician SDMT).
Table 5 shows test scores for more severe compared with more mild MS (Table 5a - progressive forms of MS compared with relapsing forms of MS; Table 5b - longer disease duration compared with shorter disease duration; Table 5c - EDSS >=4.0 compared with EDSS <4.0). For each definition of disease severity, scores were significantly worse in the more severe MS group. Not surprisingly, the walking tests strongly separated progressive from relapsing patients, and high from low EDSS patients, since the definition of these categories is heavily dependent on walking ability. Cognitive processing speed testing correlated better with disease duration than with disease category, as expected. In most cases, the effects were quite strong, and MSPT testing performed as well or better than technician testing.
Table 6 shows correlations with patient reported outcomes from the MSPS. There were significant correlations between walking test scores, and patient self-reports on mobility; and between manual dexterity test scores and patient self-reports on hand function. There were no significant correlations between the vision or processing speed testing and patient reports of visual or cognitive problems. There were significant correlations between bladder and spasticity self-reports and test scores from all 4 dimensions and significant correlations between fatigue and test scores from 3 of the 4 dimensions.
Figure 6 shows research subject satisfaction with the iPad MSPT testing. Each subject was asked to rate their level of agreement with a series of questions, and the proportion of responses in each category were tabulated for each question. Research subjects responded to the following statements: 1) The instructions for the application were easy to understand (Figure 6A). 2) I am a frequent tablet or smart phone user (Figure 6B). 3) The applications were easy to see on the screen (Figure 6C). 4) Completing tasks on the tablet using the touch screen was easy (Figure 6D); 5) I had difficulty wearing the tablet during the walking and balancing tests (Figure 6E). 6) Completing these applications caused me to become fatigued (Figure 6F). Research subject acceptance of the iPad testing was generally favorable and comparable between MS and HC for 4 of the 6 statements. MS patients were less likely than HCs to state that understanding the instructions was easy, and more likely to state that using the tablet was fatiguing.

Figure 1. Research subject with tablet positioned at sacral level for walking and balance testing.

Figure 2. Manual dexterity test apparatus fitted to tablet.

Figure 3. Research subject testing low contrast letter acuity.

Figure 4. Processing Speed Test Screen Layout. Please click here to view a larger version of this figure.
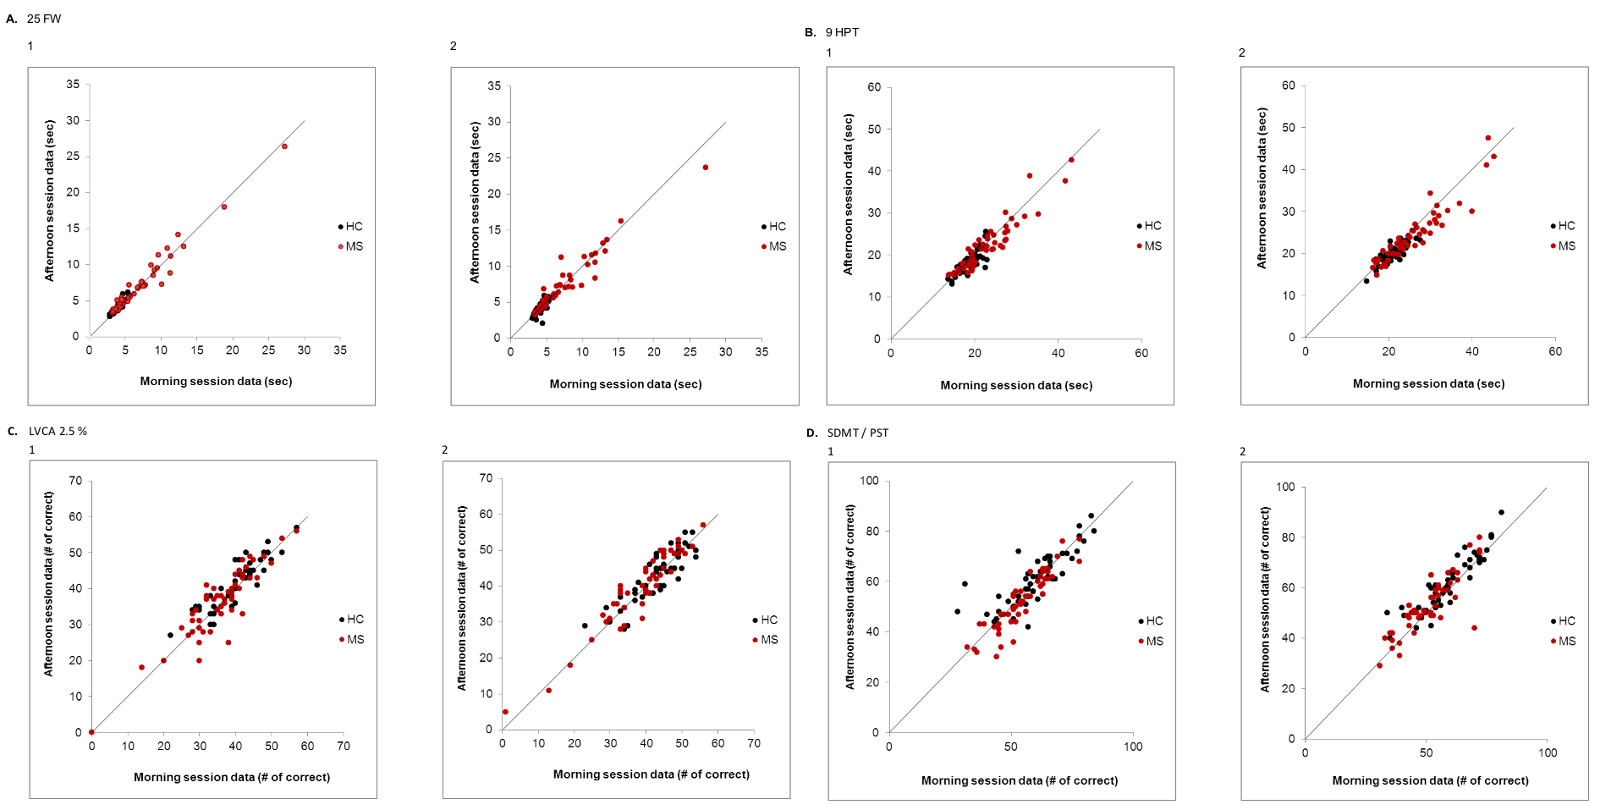
Figure 5. Test-Retest Data for technician and tablet testing. Each panel shows test-retest data for each subject for the technician testing (labeled “1”) and the tablet testing (labeled “2”). HCs are closed black circles, and MS patients are closed red circles. Panel A shows test-retest data for the 25FW/WST; Panel B shows test-retest data for the 9HPT/MDT; Panel C shows test-retest data for the SLCLA/LCLAT; and Panel D shows test-retest data for the SDMT/PST. Reproducibility was high for both technician and tablet based tests. Concordance correlation coefficients for all subjects/HCs/MS: Technician WST: 0.982/0.917/0.981; tablet WST: 0.961/0.736/0.959, Technician 9HPT: 0.921/0.777/0.93; tablet MDT dish test: 0.911/0.749/0.910; Technician SLCLA: 0.905/0.883/0.905; tablet LCLAT: 0.925/0.874/0.944; Technician SDMT: 0.853/0.791/0.889; tablet PST: 0.867/0.865/0.831. Please click here to view a larger version of this figure.
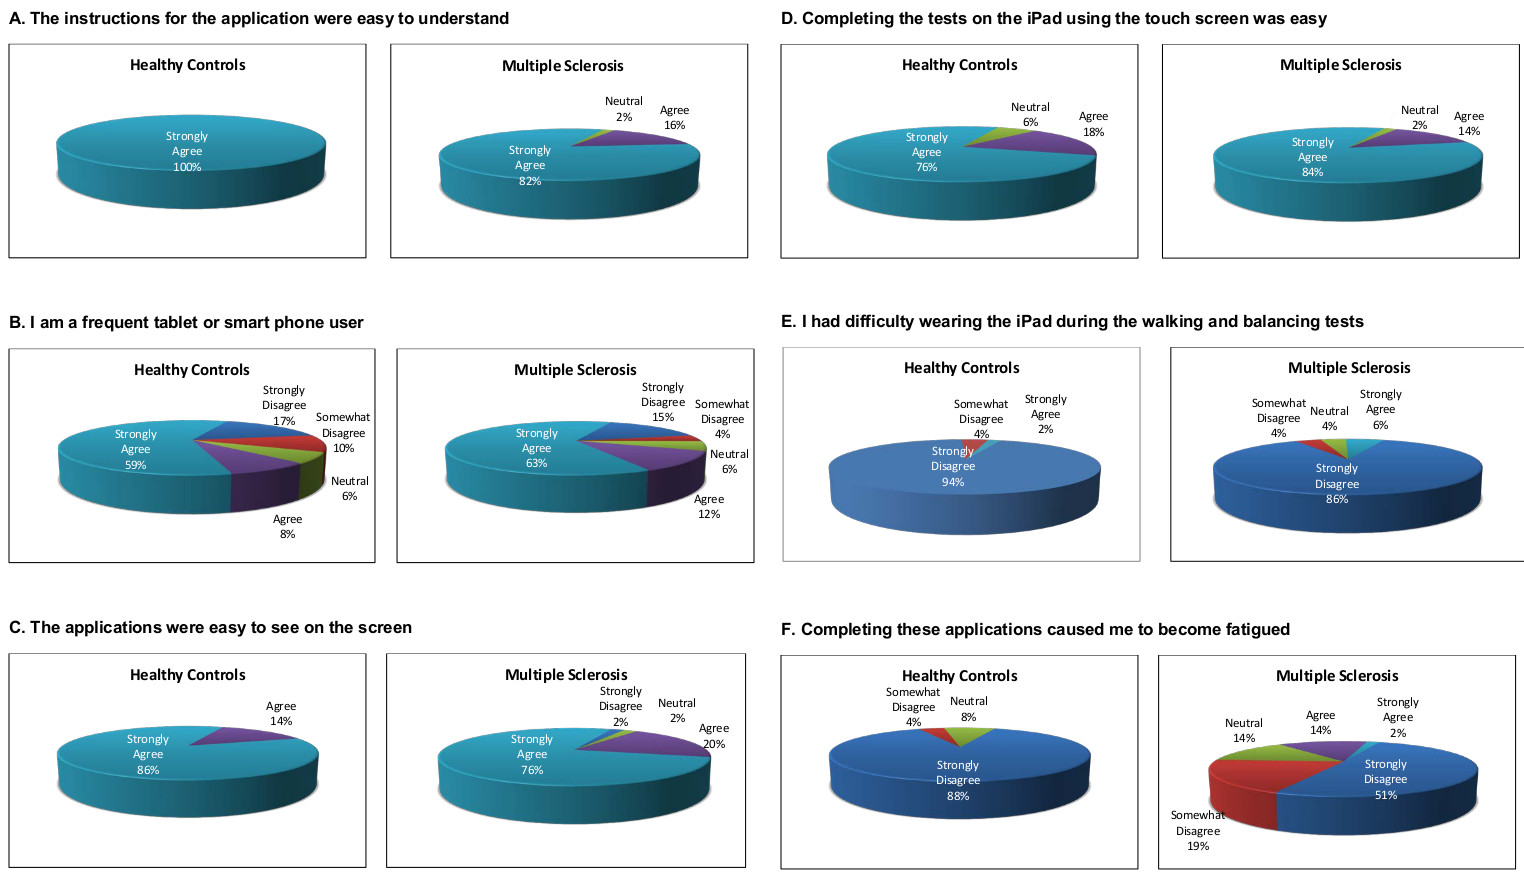
Figure 6. Satisfaction Data with tablet MSPT. The figure shows level of agreement with the questions above each panel. For each of the 6 questions, HC responses are shown on the left, and MS responses on the right. The large majority of research subjects agreed that the instructions were easy to understand, the tablet applications easy to see, that completing the testing was easy, and disagreed that wearing the tablet for gait testing was difficult or that the testing was fatiguing. Response distribution was similar for HC and MS subjects for 4 of the 6 questions. MS patients were less likely to state that understanding the instructions was easy, and were more likely to find the testing fatiguing. Please click here to view a larger version of this figure.
Table 1. Dimensions of Interest and MSPT / MSFC Tests.
| Dimension | MSPT Test | MSFC Test | Comment |
| Lower extremity function | WST | 25FW | WST has been shown to correlate with EDSS, and patient self-reports |
| Walking and standing stability | Balance Test | None | Imbalance is a common MS manifestation, but there are no practical balance tests for general use |
| Hand coordination | MDT | 9HPT | 9HPT has been shown to be informative in clinical trials |
| Cognitive processing speed | PST | SDMT | PASAT-3 was recommended for the initial version of the MSFC, but an expert panel has recommended that it be replace by SDMT |
| Vision | LCLAT | SLCLA | SLCLA has been validated in MS patients and recommended for future versions of the MSFC |
Table 2. Patient and Healthy Control Characteristics.

Table 3. Pearson Correlation Coefficients Between iPad Tests and Analogous Technician Tests.

Table 4. Ability of Each Test to Distinguish Between MS and HC.

Table 5. Test outcomes for MS of varying disease progression states.
Table 5a. CIS+RR vs. SP.

Table 5b. DD

Table 5c. EDSS

Table 6. Pearson Correlation with MSPS (Patients Reports) – Morning session data.
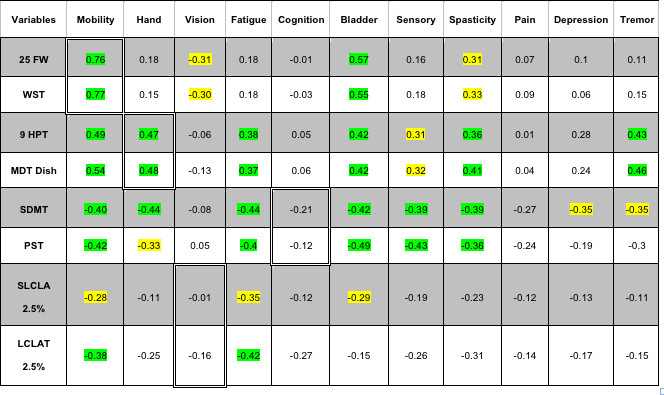
Note: Rows with gray color include data of Technician and rows with white color include data of iPad. Light green color correlations with p-value <0.01, light yellow correlations with p-value <0.05 are marked within the table. Cells showing correlations expected (25FW/WST vs mobility; 9HPT/MDT Dish vs hand coordination; SLCLA/LCLAT 2.5% vs vision; and SDMT/PST vs cognition) are highlighted with double cell borders. Please click here to view a larger version of this table
Discussion
Multiple sclerosis outcome assessment methods range from biological measures of the disease process (e.g., inflammatory markers in blood or CSF) to patient reported outcomes (PROs) reflecting symptoms and feelings related to the disease. In between these extremes are imaging measures, many based on magnetic resonance imaging (MRI), clinician rated outcomes (Clin-ROs), and performance based outcomes (Perf-Os). They are extremely important for many reasons. They are used to rate the severity of clinical manifestations, track disease evolution over time, or assess response to therapy. In the regulatory environment, Clin-ROs and Perf-Os are used as the primary outcome measure for phase 3, registration trials. Importantly, Clin-ROs and Perf-Os are also used to categorize or measure disease severity for studies focused on pathogenesis. For these reasons, reproducible and validated clinical outcome measures are crucial to advance patient care and research.
Two fundamentally different approaches to MS clinical outcome measures are clinician rating scales and quantitative tests of neurological and neuropsychological performance. The most commonly used, and generally accepted rating scale used in the MS field is the Kurtzke EDSS. The most common quantitative preformance measure is the MSFC. The advantages of each of these approaches, and their shortcomings have been reviewed and debated. MSFC-type measures carry advantages in terms of precision and the quantitative nature of the data, but interpreting the meaning of small changes to the patient may be difficult. Nevertheless, efforts are underway to improve on the MSFC approach and to derive a more informative disability measure that could be qualified as a primary outcome measure for future trials in progressive MS populations.
MSFC testing has been included in most MS drug trials over the past 15 years, and components of the MSFC (particularly WST and 9HPT) are commonly used in clinical practice. This is empirical evidence of value in neuroperformance testing in both the clinical trial and practice settings. Given the tendency within the MS field to use MSFC testing, current efforts to further develop this approach15, and advances in information technology, we developed the MSPT.
In this report, we document high precision, strong correlations between MSPT component test results and the analogous technician-based testing, and favorable sensitivity in distinguishing MS from controls, and mild from severe MS. Also, we document significant correlation between patient reports and MSPT testing of walking and hand function. In all comparisons, MSPT testing compared favorably to technician-based testing. Finally, we document high test subject acceptance of the iPad based testing.
There are implications of this work. First, conducting neurological performance testing within the computer environment enables various direct manipulations and analyses of primary and derivative data. An example is the Symbol Digit Modalities Test. For this technician administered test, the number of correct answers in 90 sec is recorded manually on a case report form, and transferred to a research database. For each research subject, one number is returned for each test session. Using a computer-based analogue of the SDMT as a measure of cognitive processing speed, the analysis program can easily and instantaneously determine the number correct for each 30 sec interval and can generate within-test-session slopes based on each 30 sec interval. These slopes might represent learning ability (e.g., improving slope) or cognitive fatigue (e.g., worsening slope). These exploratory parameters may correlate with dimensions of the disease not captured by the limited information available from technician testing. Thus the context of testing results in greater information content, even though the testing itself may require similar effort on the part of the research subject.
Secondly, results can be directly transmitted to research or clinical data repositories without paper or electronic case report forms. This would substantially reduce the need for manual data quality checks, the cost of transcribing data manually, and would reduce human error. In aggregate, these advantages should translate into improved efficiency and data quality.
Third, computer based testing could be widely disseminated to patients who do not reside near a clinical trial performance site. Patients could be tested using the MSPT in a rural doctor’s office, potentially supporting participation in clinical trials for patients who might otherwise not be able to participate in a clinical trial simply because of distance.
Third, the MSPT could be used in practice settings (e.g., MS clinics) to collect standardized neuroperformance information. Because the data is standardized and quantitative, MSPT could provide a highly cost-efficient mechanism to collect MS assessment data during routine clinical practice. This could populate research registries and inform practice-based research related to natural history, treatment, effects of co-morbidities, and various other important topics.
Finally, the computer-based MSPT described in this paper could be adapted to in-home testing. This could be transformative, since data could be collected in the same location as the research participant’s (or clinical patient’s) normal environment, as opposed to the highly artificial circumstances in most clinical trial or patient care settings. In addition to substantially lowering barriers imposed by travel to a clinical trial site or academic center, this feature would provide data on neurological function in a real world setting. Further, multiple measurements over defined time periods could be collected, allowing a more precise assessment of overall neurological performance and identification of relevant fluctuations (e.g., fatigability over the course of the day, or significant deviation from individual average performance). This, in turn, would make functional testing much more patient-relevant, and more informative to clinicians and researchers.
It is important to note that the iPad is used as a platform to host the data collection and processing algorithms in the software. Much like other computerized testing approaches, the software was written in such a manner that should Apple or other tablet makers update the hardware or operating system, adjustments can be made in the acquisition and processing of the data to ensure that outcomes remain consistent across test modules and do not have to be re-validated under the future device or software configurations.
As neuroperformance testing is increasingly applied in MS and other chronic neurological and neuropsychological disorders, computer-adapted testing will have the same transformative effect on clinical care and research as standardized computer-adapted testing has had in the education field, with clear potential to accelerate progress in clinical care and research for neurological disorders.
Disclosures
Dr. Rudick has received honoraria or consulting fees from: Biogen Idec, Genzyme, Novartis, and Pfizer and research funding from the National Institutes of Health, National Multiple Sclerosis Society, Biogen Idec, Genzyme, and Novartis. As of May 12, 2014, Dr. Rudick will be an employee of Biogen Idec.
Dr. Miller has received research funding from the National Multiple Sclerosis Society and Novartis.
Dr Bethoux has received honoraria or consulting fees from: Biogen Idec, Medtronic, Allergan, Merz, Acorda Therapeutics, and Innovative Neurotronics, and research funding from the National Multiple Sclerosis Society, Acorda Therapeutics, Medtronic, Merz, and Innovative Neurotronics.
Dr. Rao has received honoraria or consulting fees from: Biogen Idec, Genzyme, Novartis and the American Psychological Association and research funding from the National Institutes of Health, US Department of Defense, National Multiple Sclerosis Society, CHDI Foundation, Biogen Idec, and Novartis.
Dr. Alberts receives consulting fees from Boston Scientific and research funding from the National Institutes of Health.
JC Lee, C Reece, D Stough, B Mamone, D. Schindler – nothing to declare.
Acknowledgements
The authors gratefully acknowledge research funding for validation of the MSPT from Novartis Pharmaceutical Corporation, East Hanover, New Jersey.
Materials
| Name | Company | Catalog Number | Comments |
|---|---|---|---|
| 9-Hole Peg Test Kit | Rolyan | A8515 | |
| Apple iPad with Retina Display (16 GB, Wi-Fi, White) | Apple | MD513LL/A | |
| CD Player | Non-brand specific | ||
| iPad Body Belt | Motion Med LLC | RMBB001 | Special order for The Cleveland Clinic |
| LCVA Wall Chart | Precision Vision | 2180 | |
| Music Stand | Non-brand specific | ||
| PASAT Audio CD | PASAT.US | English | |
| SDMT Test Materials | WPS | W-129 | |
| Upper Extremity Overlay Apparatus | Motion Med LLC | PB002 | Special order for The Cleveland Clinic |
References
- Fisher, E. Multiple Sclerosis Therapeutics. , 173-199 (2007).
- Whitaker, J. N., McFarland, H. F., Rudge, P., Reingold, S. C. Outcomes assessment in multiple sclerosis clinical trials: A critical analysis. Multiple Scerlosis: Clinical Issues. 1, 37-47 (1995).
- Rudick, R., et al. Clinical outcomes assessment in multiple sclerosis. Ann. Neurol. 40, 469-479 (1996).
- Cohen, J. A., Reingold, S. C., Polman, C. H., Wolinsky, J. S. Disability outcome measures in multiple sclerosis clinical trials: current status and future prospects. Lancet Neurol. 11, 467-476 (2012).
- Kurtzke, J. F. Rating neurologic impairment in multiple sclerosis: an expanded disability status scale (EDSS). Neurology. 33, 1444-1452 (1983).
- Willoughby, E. W., Paty, D. W. Scales for rating impairment in multiple sclerosis: a critique. Neurology. 38, 1793-1798 (1988).
- Rudick, R., et al. Recommendations from the National Multiple Sclerosis Society Clinical Outcomes Assessment Task Force. Ann. Neurol. 42, 379-382 (1997).
- Cutter, G. R., et al. Development of a multiple sclerosis functional composite as a clinical trial outcome measure. Brain. 122 (Pt 5), 871-882 (1999).
- Gronwall, D. M. A. Paced auditory serial-addition task: A measure of recovery from concussion. Percept Mot Skills. 44, 367-373 (1977).
- Rao, S. M., Leo, G. J., Bernardin, L., Unverzagt, F. Cognitive dysfunction in multiple sclerosis I. Frequency, patterns, and prediction. Neurology. 41, 685-691 (1991).
- Ontaneda, D., LaRocca, N., Coetzee, T., Rudick, R. Revisiting the multiple sclerosis functional composite proceedings from the National Multiple Sclerosis Society (NMSS) Task Force on Clinical Disability Measures. Mult. Scler. 18, 1074-1080 (2012).
- Balcer, L. J., et al. New low-contrast vision charts: reliability and test characteristics in patients with multiple sclerosis. Mult. Scler. 6, 163-171 (2000).
- Smith, A. Symbol-Digit Modalities Test Manual. , Western Psychological Services. (1973).
- Benedict, R. H., et al. Reliability and equivalence of alternate forms for the Symbol Digit Modalities Test: implications for multiple sclerosis clinical trials. Mult. Scler. 18, 1320-1325 (2012).
- Rudick, R. A., LaRocca, N., Hudson, L. D. Multiple Sclerosis Outcome Assessments Consortium: Genesis and initial project plan. , (2013).
- Polman, C. H., et al. Diagnostic criteria for multiple sclerosis: 2010 revisions to the McDonald criteria. Ann. Neurol. 69, 292-302 (2011).
- Schwartz, C. E., Vollmer, T., Lee, H. Reliability and validity of two self-report measures of impairment and disability for MS. North American Research Consortium on Multiple Sclerosis Outcomes Study Group. Neurology. 52, 63-70 (1999).
- Marrie, R. A., Goldman, M. Validity of performance scales for disability assessment in multiple sclerosis. Mult. Scler. 13, 1176-1182 (2007).
- Cella, D., et al. The neurology quality-of-life measurement initiative. Arch. Phys. Med. Rehabil. 92, (2011).
Reprints and Permissions
