Around 1882, Ernst Abbe found that the resolution of a visible light microscope is ~λ/2NA, or ~200 nm (where λ is the wavelength and NA is the numerical aperture)1,2. Therefore any object smaller than this dimension would appear as a diffraction-limited spot in an optical microscope. However, it is possible to determine the center of the spot, that is, the location of the object, with a much higher precision3. Fluorescence imaging with one-nanometer accuracy (FIONA) is a simple but useful technique for localizing single fluorophores with nanometer precision in the x-y plane4. The precision of localization, σµ (i.e., the standard error of the mean), depends on the total number of collected photons,  , where N is the photon count, s is the standard deviation of the fluorescent spot, a is the pixel size of the imaging detector, and b is the standard deviation of the background3,4. For a fluorophore emitting ~ 10,000 photons, FIONA can achieve ~1 nm precision4.
FIONA can be used to accurately determine the position of a stationary emitter, or a moving one (assuming images can be taken fast enough). FIONA can be applied sequentially to the frames of the movie and thus track the motion of the single molecule4-8. Photo-protective reagents may be necessary to ensure that the sample does not photodegrade. Furthermore, the fluorescent object itself may be of any size, smaller or larger than the diffraction limit—e.g., it may consist of an organelle (~1 µm) with many fluorescent proteins dispersed on its membrane. Using FIONA can still yield a very accurate (nanometer) average of its average center-of-mass. The great improvement in localization precision by FIONA allows resolving nanometer-scale movements over time. This has pushed microscopy into the molecular length scale4-8.
Since its invention, variants of FIONA have been developed. For example, bright-field imaging with one-nanometer accuracy (bFIONA)9, a slight variant of FIONA, images and localizes dense objects such as melanosomes in vivo (dark objects containing the pigment melanin) with transmitted light. In addition, FIONA has been employed to resolve multiple dyes. For example, single-molecule high-resolution imaging with photobleaching (SHRImP)10,11 or single-molecule high-resolution colocalization (SHREC)12 have been developed to resolve two dyes within about 10 nm. (Notice that this is resolution, i.e. how accurately one can tell identical dyes apart.) More recently, FIONA analysis has contributed to the localization process of certain super-resolution microscopy such as stochastic optical reconstruction microscopy (STORM)13-15 and photo-activated localization microscopy (PALM)16, in which temporary dark fluorophores are excited, and then the fluorescence is localized. By repeatedly exciting a fairly low density of dyes (less than one per diffraction limited spot), and then collecting the fluorescence, analyzing each of them by FIONA, one can build up a high-resolution map. The resolution is then just limited by the number of photons each dye puts out, as well as things like keeping the sample stationary (including, e.g., the microscope stage) during the acquisition.
In this paper, a summary of the FIONA technique and briefly describe examples of research that have been performed using FIONA is reported. First, how to set up the required equipment for FIONA experiments, i.e., a total internal reflection fluorescence microscopy (TIRFM), with details on aligning the optics, is described. Then how to carry out a simple FIONA experiment on localizing immobilized Cy3-DNA single molecules using appropriate protocols, is illustrated. After that, the use of FIONA to measure the 36 nm step size of a single truncated myosin Va motor labeled with a quantum dot is presented. Myosin Va is an essential processive motor protein which carries cellular cargo while translocating along actin filaments. Here a myosin Va construct truncated is used to remove domains irrelevant to the step size, and with a FLAG tag added to the C-terminus to allow ease of labeling with quantum dots functionalized with Anti-FLAG antibodies. This experiment is done under low ATP to slow down the myosin and allow the use of long enough exposure times to get a good photon count in every frame. Any sufficiently bright fluorescent label could be substituted in the following protocol. Lastly, recent effort of extending the application of FIONA to thick samples is reported. As a proof-of-principle, quantum dots were soaked in sol-gels and rabbit eye corneas and then imaged and localized using FIONA. For imaging, a 60X water immersion objective with NA=1.2 was used because this objective has a longer working distance than previously used 100X oil immersion objective. To compensate the loss in the magnification in the objective, an extra-magnification lens (3.3X or 4.0X) was inserted in the emission path. In addition, epi-fluorescence (not TIR) microscopy needs to be used to access deep regions in the thick samples. It is shown that quantum dots soaked deep in sol-gels and in rabbit eye corneas (Z > 200 µm) can be localized with 2-3 nm precision.
Ethics Statement: The cornea tissue from rabbits was collected in accordance with the University of Illinois Institutional Animal Care and Use guidelines.
1. TIRFM Setup
NOTE: Wear laser-safety goggles all the time.
- Make sure that all necessary optical components listed in the List of Materials are available and ready for alignment. If needed, use substitutes with equivalent functions from other companies. Ensure that Mirrors and lenses should have anti-reflective (AR) coatings matching the laser in use.
- Set the heights of all the optical components to the height of the center of the microscope back port.
- Mount the laser, laser shutter and ND filter(s). Use ND filters to attenuate the laser power down as low as possible while keeping the beam visible. Tighten screws with appropriate hex keys.
- Plan a beam path and mark it with tape or marker on the optical table (dotted blue lines in Figure 1). For simplicity, keep straight paths along lines of holes on the optical table.
- Place mirror M1 (Figure 1) at the first right angle turn. Place the two irises along the second straight section of the planned beam path. Adjust both the position and the tilt of M1 such that the laser goes through the irises.
- Place mirror M2 (Figure 1) at the second right angle turn. Place the 10X beam expander (L1 & L2, Figure 1) along the third straight section of the path. Adjust its tilt such that the beam expander is parallel to both the optical table and the planned beam path.
- Adjust M1 and M2 iteratively such that the laser goes straightly through the centers of both lenses of the beam expander. Repeat this step until the beam profile of the expanded beam is non-clipped Gaussian.
- Adjust M1 to center the beam on L1 (Figure 1) and M2 to center the beam on L2 (Figure 1) iteratively. A bad beam profile usually means the laser is clipped; use a piece of white paper to block the beam after the beam expander to check the beam profile with eyes. For high-precision analysis, use an optical beam profiler.
- Adjust the distance between L1 and L2 such that the beam is collimated. Repeat Step 1.8 and 1.9 if necessary.
NOTE: When the beam size does not change with distance, the beam is collimated enough for a TIRFM setup. To further improve the beam collimation, tools such as a shearing interferometer could be used. A typical beam size after expansion is ~20 mm. - Shutter the laser. Unscrew the microscope objective and screw in a fluorescent alignment target. Place mirrors M3 and M4 (Figure 1) to direct the expanded beam into the microscope port and onto the dichroic mirror inside the turret. Ensure that the laser beam bounces off the dichroic and towards the ceiling.
- Adjust M3 to center the brightest part of the beam on the fluorescent target, and M4 to adjust the beam tilt to be vertical.
- Shutter the laser and screw the objective back in. If the alignment in the previous step is done well there should be a symmetric spot exiting the objective. Fine-tune the tilts of M3 and M4 to optimize the laser power and beam profile out of the objective.
- Mount an EMCCD camera to the microscope and connect the camera to a computer. Start the software for the camera.
- Mount a fluorescent sample (solution of fluorophores) on the microscope. Look at the bright fluorescent spot on the camera. Check that the spot does not shift on the screen as the focus is changed.
- Place the TIR lens (L3, Figure 1) on the XYZ translation stage at a distance from the back focal plane of the objective which is equal to the focal length of L3 (~30 cm). Adjust the position of L3 such that the laser goes through the center of the lens.
- Translate L3 along the beam path to adjust the beam collimation. Make sure that the beam is still centered on the monitor and symmetrical in shape.
NOTE: The illumination area at the sample plane increases with decreasing TIR lens focal length. In general, use the smallest focal length that could fit on the set-up. - Translate L3 perpendicular to the beam path to tilt the beam out of the objective. Keep translating the TIR lens such that TIR is achieved. Observe a sample of fluorescent beads through the EMCCD camera, and fine-tune L3 to get good SNR.

Figure 1. Optical configuration for total internal reflection fluorescence microscopy (TIRFM).
2. FIONA on Cy3-DNA
- Clean microscope slides and coverslips: rinse microscope slides and coverslips with ddH2O and isopropanol and dry them with nitrogen gas; place the slides and coverslips in the plasma cleaner for 5 min under argon plasma.
- Construct sample chambers (as sketched in Figure 2).
- Place a tissue on the bench and then put a piece of lens paper on top of the tissue. Place the slide on the lens paper. Make sure that the clean side of the slide is upwards.
- Apply two strips of double-sided tape onto the slide along the long edges, leaving a gap of 3-5 mm at the center. Place the cleaned coverslip on top of the slide. Make sure that the clean side of the coverslip is facing the slide.
- Use a pipette tip to press down over the double-sided tape. Use a razor to remove excess tape from the slide so that the tape remains only under the coverslip.
NOTE: The open ends of the chamber are left open and serve as inlet and outlet. The chamber volume is several microliters.

Figure 2. Sketch of a typical sample chamber. (a) Top view; (b) Side view from the right; (c) Side view from the front.
- Immobilize Cy3-DNA on inner surfaces of the sample chambers.
- Prepare T-50 buffer (10 mM Tris-HCl pH 8.0, 50 mM NaCl). Prepare BSA-biotin in T-50 at a final concentration of 1 mg/ml. Prepare T50-BSA buffer by dissolving BSA in T-50 at a final concentration of 10 mg/ml.
- Prepare 0.5 mg/ml neutravidin in T50-BSA buffer. Prepare biotinylated Cy3 labeled DNA (Cy3-DNA) in T50-BSA at a final concentration of 5-10 pM.
- Pipette 10 µl BSA-biotin (1 mg/ml) into the sample chamber. Wait for 5 min.
- Wash the chamber with 40 µl T50-BSA. Pipette 10 µl neutravidin (0.5 mg/ml) into the sample chamber. Incubate for 5 min.
- Wash the chamber with 40 µl T50-BSA. Pipette 20 µl Cy3-DNA into the sample chamber. Incubate for 5 min and then wash the chamber with 80 µl T50-BSA.
- Image Cy3-DNA single molecules under TIRFM.
- Prepare imaging buffer (100 µl) by mixing 1 µl Protocatechuate-3,4-dioxygenase (PCD, 5 µM), 4 µl Protocatechuic acid (PCA, 62.5 mM), 50 µl 6-hydroxy-2,5,7,8-tetramethylchromane-2-carboxylic acid (Trolox, 2 mM in T-50), and 45 µl T50-BSA.
- Pipette in 30 µl imaging buffer and wait for 8-10 min.
- Mount the sample for imaging on a TIRFM that is equipped with a green laser (532 nm), a 100X oil immersion objective (1.45 NA), and an EMCCD camera.
- Set the exposure time to 100 to 500 msec and EM gain to 25 to 100. Acquire a movie of the sample for 1,000 frames.
- Perform FIONA data analysis on the recorded images of Cy3-DNA.
- Determine the effective pixel size (i.e., conversion factor from pixels to nanometers) by dividing the physical pixel size (read from the specification sheet of the EMCCD camera) by the total magnification (the magnification of the microscope objective multiplied by any extra magnifications).
- Determine the conversion factor from pixel intensities to photon numbers by dividing CCD sensitivity (i.e., electrons per A/D count, read from the specification sheet of the CCD camera) by the electron multiplier (EM) gain used during image acquisition.
- Compile and run FIONA.pro for FIONA analysis. Use this IDL program to import the acquired image, to input the effective pixel size (from Step 2.5.1) and the conversion factor from intensity to photon number (from Step 2.5.2), and to choose spots for FIONA analysis.
NOTE: At the end, the program will output the fitting results with 2D Gaussian functions, as well as total photon numbers and localization precision. A typical result is shown in the section of representative results and Figures 4c-4d. - Compile and run phcount.pro to characterize photon count. Use this IDL program to measure the average number of photons emitted by a fluorophore before photobleaching, to import the acquired image and to input the conversion factor from intensity to photon number (from Step 2.5.2).
NOTE: The program will then detect fluorescent spots automatically (manual selection is an option), calculate photon counts as a function of frame number, and output the traces of photon counts.- Discard bad traces and specify frame ranges after photobleaching for baseline correction. At the end, the program will output a list of total photon numbers for all the spots not discarded. Then plot the distribution of the photon numbers and fit the distribution with an exponential decay to obtain the average photon number. A typical result is shown in the section of representative results and Figures 4e-4f.
3. FIONA Applied to Quantify Motor (e.g., Myosin on Actin) Dynamics at Nanometer Scale
- Polymerize actin (i.e. prepare F-actin) one day before FIONA experiment.
- Reconstitute G-actin (monomer) and biotin G-actin (monomer) to 10 mg/ml with general actin buffer. Stir to make sure both are fully dissolved, and keep both on ice.
- Mix 10 µl G-actin (monomer) with 1.7 µl biotin G-actin in a 1.5 ml microcentrifuge tube. Add 100 µl ice cold actin polymerization buffer.
- Leave the mixture overnight at 4 °C (F-actin formed) and then add ddH2O to a total volume of 1 ml.
- Store the actin filaments (F-actin) at 4 °C for later use in experiments.
NOTE: Filaments will disintegrate and shorten over time, but can be used for at least two weeks.
- Prepare sample for imaging.
- Make a sample chamber (as described in Protocol 2.1 and 2.2). Pipette in 20 µl biotinylated BSA at 1 mg/ml in ddH2O. Incubate for 10 min. Rinse with 30 µl ddH2O.
NOTE: This blocks the glass surface and lays down biotin for binding of the actin filaments. Biotinylated poly-L-lysine – polyethylene glycol (PLL-PEG) could serve the same function. - Pipette in 0.5 mg/ml neutravidin. Incubate for 2 min and then wash the chamber with 30 µl M5 buffer.
- Pipette in the prepared F-actin diluted 25 times in general actin buffer, to final concentration ~0.004 mg/ml. Wait 10 min, rinse the chamber with 30 µl buffer.
- Dilute myosin Va with FLAG tags 30-fold in M5 buffer (20 mM HEPES (pH 7.6), 2 mM MgCl2, 25 mM KCl, 1 mM EGTA) to a final concentration of 250 nM. Mix 1 µl myosin with 1 µl Anti-FLAG-Qdot705 (~1 µM, conjugated from Anti-FLAG antibodies and Qdot705 using the Qdot705 Antibody Conjugation Kit according to the instruction manual from the manufacturer). Add in 8 μl M5 to fill to 10 µl. Pipette up and down to mix well. Incubate for 10 min on ice.
NOTE: This yields a mixture of 1 motor to 4 quantum dots, at ~25 nM myosin concentration.
- Make a sample chamber (as described in Protocol 2.1 and 2.2). Pipette in 20 µl biotinylated BSA at 1 mg/ml in ddH2O. Incubate for 10 min. Rinse with 30 µl ddH2O.
- Imaging of the myosin walking on actin.
- Prepare imaging buffer (100 µl) by mixing 84 µl M5-BSA (M5 buffer with 1 mg/ml BSA), 1 µl ATP (50 µM in ddH2O), 2 µl DTT (500 mM in ddH2O), 1 µl CK (500 U/ml), 5 µl CP (200 mM), 1 µl PCD, 4 µl PCA, 1 µl myosin-qdot after diluted another 10-fold to 2.5 nM myosin concentration, and 1 µl BME.
- Pipette in 20 µl imaging buffer to sample chamber and incubate for 8-10 min.
- Image the sample on TIRF microscope at 30 msec exposure. Acquire at least 1,000 frames. Adjust the volume of myosin-qdot in Step 3.3.1 if necessary.
- Perform data analysis and find the step-size of myosin walking.
- Open the video file in ImageJ17 and crop the video around a moving spot. Crop a large enough area that the spot never gets within 20 pixels of the edge, and make sure there are no other spots in the video. Ensure that this spot is moving in a linear path.
- Track the spot through the video to generate x and y coordinates through time, in pixels, by applying FIONA analysis (Step 2.5.3) to each and every frame of the video.
- Convert pixels to nanometers, as described in the previous section.
- Calculate displacement from initial position as a function of time.
- Run t-test on the displacement to obtain the steps of myosin walking.
NOTE: The program provided for t-test (step_t_test.zip) is coded in IDL and consists of 14 subroutines in the folder.- Open all of the subroutines in IDL and compile all twice. Then run mtltyanalysis_ttest.pro and choose a text file containing only the distance data in a single column. An output Excel file will be generated, containing the raw data, the fit, and the step size.
- Delete all zero-values from the step-size column. Plot the distribution of the step sizes using Origin or MATLAB. Fit a Gaussian to the histogram.
NOTE: Step sizes of zero-values need to be deleted because a step of zero means that no step is taken from the previous frame. The fitting gives a peak around 36 nm (as shown in Figure 5).
4. Thick Sample Preparation for FIONA
- Prepare quantum dots encapsulated in sol-gel.
- Mix 4.5 ml TMOS, 1 ml ddH2O and 100 µl HCl (120 mM). Sonicate the mixture on ice for 30 min in the ultrasonic cleaner specified in the List of Materials (frequency = 40 kHz, heater = off). Mix the solution every 10 min.
- Dilute 1.5 µl Qdot605 in 1.5 ml HEPES (50 mM pH 7.2). Mix solution with 1.5 ml TMOS from the previous step.
- Pour the mixture into a glass bottom dish. Seal the glass bottom dish with Parafilm and store at 4 ºC for 1. 5 hr.
- Add 2 ml 1% BME in PBS to the sample dish and incubate at room temperature for 30 min before imaging.
- Prepare cornea sample stained with quantum dots.
NOTE: Rabbit-eyes were gifts from Dr. Marina Marjanovic.- Separate the cornea from the eyes and cut it into 3 mm x 3 mm pieces.
- Dilute 1 µl Qdot 605-streptavidin in 1 ml of PBS. Incubate the cornea tissue with 1 nM Qdots solution at 4 ºC for 1 hr. Wash the tissue with PBS.
- Take a clean glass slide and a #1.5 coverslip. Put 4 layers of double sided tape on the glass slide along the longer side, and put another 4 layers of double sided tape parallel to the previous tape and leave a channel about 1 cm in between. Put the tissue from the previous step in the middle of the channel, and cover it with a coverslip.
- Press gently on the sides of the coverslip to make it stick to the tapes. Wet the channel with 50 µl PBS before imaging.
- Image quantum dots in sol-gel and cornea.
- For FIONA imaging in thick samples, use a 60X water-immersion objective with working distance of 0.27 mm, or a 60X water-immersion objective with working distance of 0.28 mm.
- Mount the sample on the microscope. Adjust the TIRF lens such that it reaches the epi-fluorescence mode (i.e. the laser beam comes out of the objective with an angle against the coverslip). Insert an extra magnification lens (3.3X or 4.0X).
- Move the focal plane of the objective to a desired z position (e.g. >200 µm). Record images of immobile quantum dots in the sample.
- Perform FIONA analysis as described in section 2.5 of this protocol.
A typical objective-type TIRFM setup is shown in Figure 3. First, surface-immobilized Cy3-DNA sample was imaged. A typical image is shown in Figure 4a. The image was taken with exposure time 0.5 sec, with EM gain = 50 and CCD sensitivity = 12.13 for the camera. The point-spread-function (PSF) of a single Cy3-DNA molecule is shown in Figure 4b (from the spot indicated by the arrow in Figure 4a), where the color-bar shows the scale of pixel intensities. The actual photon counts could be calculated by multiplying the pixel intensities by a conversion factor, α = CCD sensitivity / EM gain. This spot contains approximately 14,000 photons (after correction for the background).
The PSF is then fitted with a two-dimensional Gaussian function, f(x,y) = z0 + A·exp(-(x-µx)2 / (2sx2) – (y-µy)2 / (2sy2)), as shown in Figure 4c (with fitting residuals shown in Figure 4d). The precision of localization is then calculated by  , where i = x or y, si is the standard deviation of the fitting, N is the total photon number, a is the pixel size, and b is the standard deviation of background. In this specific example, N = 14,528, a = 106.67 nm, sx = 115.5 nm, sy = 109.4 nm, b = 18.9, resulting in localization precisions of σx = 1.3 nm and σy = 1.2 nm. The localization precision of a fluorophore is approximately proportional to 1/√N, i.e., the more photons are, the more precise localization is. However, in actual applications of FIONA, duration of experimental observation is another consideration. Therefore one should in general realize the tradeoff between localization precision and observation duration and plan ahead. In such situations, it is usually helpful to determine how many photons in total a fluorophore is able to emit before photobleaching. A typical trace of photon count vs. frame is shown in Figure 4e. An exponential fitting gives that the average photon number ~1.4 x 10⁶ (Figure 4f).
The data analysis process of myosin step-size measurement is shown in Figure 5. First, a video file with good signal-to-noise of a single myosin as it walks along an actin filament is captured. Figure 5a shows three frames from a video taken at 100 msec exposure with 100X oil immersion objective. The moving PSF is then tracked through the cropped video file using a custom code written in IDL to extract distance versus time information, which is put through a T-test for steps. Figure 5b shows with the distance versus time (red) and step-finder output (white). Localization errors in each frame obscures the staircase shape of the trace, so it is critical to achieve a photon count in each frame which corresponds to a localization error less than half of the theoretical step size one wishes to see. Figure 5c shows steps from several traces combined into one histogram that is Gaussian-distributed about the true myosin step size. A Gaussian fit to the histogram bins yields a final step size measurement of 35.8 ± 0.4 nm.
Because sol-gel and cornea samples are transparent, excitation lasers can penetrate deep into the samples without being scattered too much. In addition, the auto-fluorescence from the sample is minimized. When labeled with low concentration of quantum dots, it is possible to collect fluorescence from Qdots deep in the sample with high signal to noise ratio. The use of water objective gives us the working distance of 270 or 280 µm, which means that it is possible to focus as far as 280 µm away from the coverslip. This allows us to perform FIONA analysis on quantum dots in thick samples. For quantum dots in a sol-gel sample, localization precision of 1-2 nm near the coverslip and 2-3 nm at 280 µm deep into the sample (Figures 6a-6b) is achieved. For quantum dots in a biological sample (part of a cornea from a rabbit eye, Figure 6e), localization accuracy of 1-2 nm near the coverslip and 2-3 nm at ~223 µm deep into the sample (Figures 6c-6d) is achieved. It is noted that the localization precision is improved by using the extra magnification lens, without which a localization precision of 6-7 nm was obtained. This is consistent with previous numerical studies showing that the localization precision can be improved by changing the effective pixel size from ~200 nm to ~50 nm even if the total number of collected photons might be lower due to additional reflections/refractions18.

Figure 3. Optical configuration. The optical configuration of total internal reflection fluorescence (TIRF) microscopy. a) is a picture when laser is in TIRF condition and b) is the beam shape of laser on the ceiling when laser is in epi-illumination.
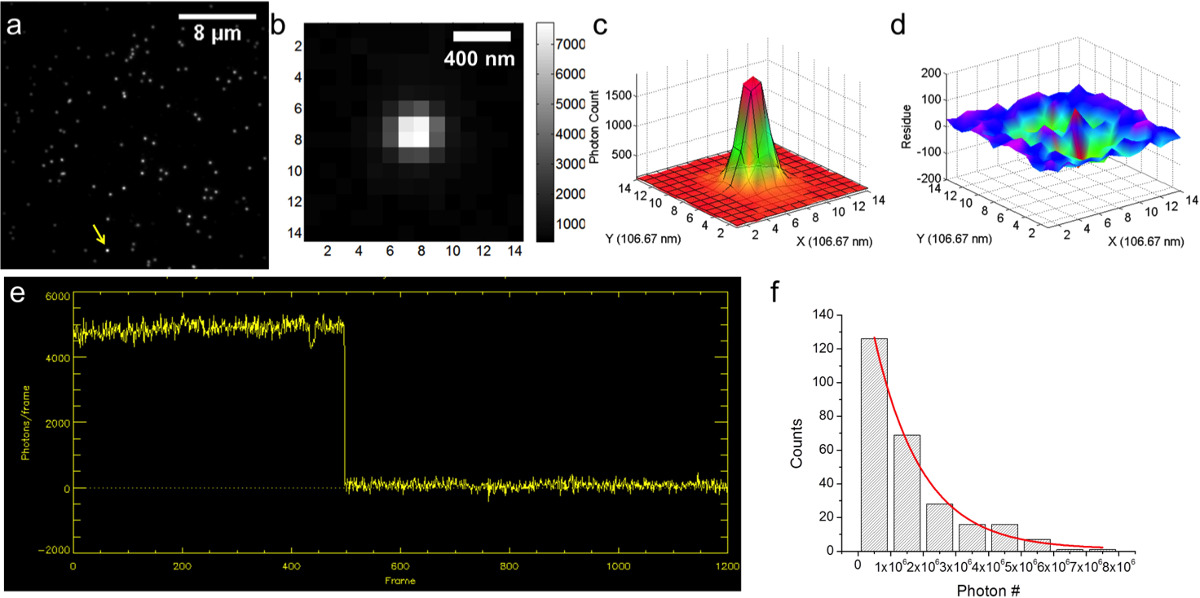
Figure 4. Localization of immobilized Cy3-DNA. a) CCD image (256 x 256 pixels) of Cy3-DNA. b) CCD image of a single Cy3-DNA molecule, indicated by the yellow arrow in a). c) Fitting the point spread function of the single Cy3-DNA molecule with a two-dimensional Gaussian function. d) Fitting residuals from c). e) Photon count vs. frame number. f) Distribution of the number of photons emitted by Cy3 molecule before photobleaching. Please click here to view a larger version of this figure.

Figure 5. Myosin walking observed by FIONA. a) Frames from example data file corresponding to t = 0 sec, 30 sec, and 60 sec. The myosin-qdot construct is moving in along a straight path and has a good photon count (>5,000) in every frame. b) Application of FIONA to each frame yields a distance versus time trace which is plotted in red. A step-finding algorithm based on the T-test is used to then extract individual steps, and the output is overlaid in white. Step sizes are labeled in white in units of nanometers. c) Steps from multiple traces are combined in a histogram. The measured step sizes are Gaussian-distributed about 35.8 ± 0.4 nm. Please click here to view a larger version of this figure.
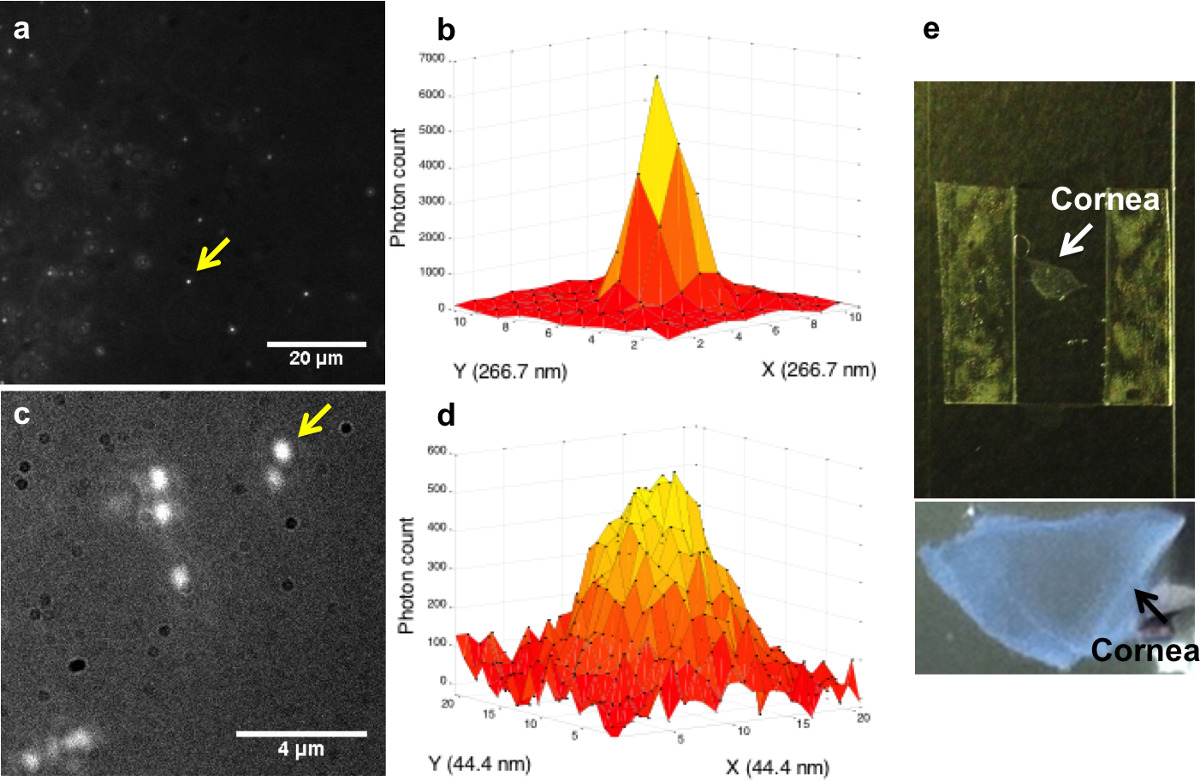
Figure 6. FIONA analysis on quantum dots deep in thick samples. a) Fluorescent image of QD 605 in sol-gel at Z = 280 µm with 90X magnification. b) The point spread function of the QD marked in a). σx = 2.6 nm, σy = 2.3 nm. Each unit in the X and Y axis represents 266.7 nm. c) Fluorescent image of QD 655 in rabbit cornea tissue at Z = 223 µm with 360X magnification. d) The PSF of the QD marked in c). σx = 2.2 nm, σy = 3.6 nm. Each unit in the X and Y axis represents 44.4 nm. e) Pictures of the cornea tissue mounted on a coverslip. Please click here to view a larger version of this figure.
