The human vascular endothelium provides structural and functional roles within the body. In histological sections, the endothelium appears small, comprising a thin layer of cells 1-2 microns thick sitting atop a layer of smooth muscle cells (the media) and a thick layer of connective tissue (the adventitia). Taken as a whole, the endothelium provides a wide area for the exchange of information between the blood and vascular smooth muscle tissue. By one estimate, a cross sectional area of 700 m2 and a mass of 1,000-1,500 grams in a 70 kg man, is comparable in mass to the liver1. A healthy endothelium allows for mechanical to chemical signal transduction to maintain homeostasis of the blood vessel. Endothelial dysfunction is an imbalance of these mediators and the first step in vascular disease, present prior to histological evidence of atherosclerosis. A non-invasive, in vivo method for quantifying the vasodilatory function of human artery exists. This method, endothelium-dependent, flow-mediated vasodilation (FMD) is widely used in clinical trials.
The endothelium acts as a structural component of the vasculature and manufactures components of the extracellular matrix such as glycosaminoglycans and fibronectin2. Long term changes in blood flow and acute injury to the artery may lead to structural changes. Functionally, the vascular endothelial cells participate in regulation of vessel tone, inflammatory processes, antithrombosis, and anticoagulation. Endothelial cells affect vasoconstriction through endothelin while vasodilation is mediated by nitric oxide (NO), prostacyclin, and endothelial derived hyperpolarizing factor (EDHF)3-6.
Endothelial dysfunction is an impairment of any of these mediators and the first step in atherosclerosis. Not surprisingly, as a mechanism of disease, it is associated with a number of clinically important conditions such as coronary artery disease, hypertension and diabetes mellitus7-11. Importantly, endothelial dysfunction can be observed in individuals without diagnosed cardiovascular disease and is predictive of future cardiovascular events7,12,13. One measure of endothelial dysfunction, in combination with the Framingham score, can provide additional prognostic information above either measure alone14.
Measures of endothelial dysfunction may involve the direct infusion of a pharmacological agent. Intercoronary infusion of acetylcholine, for example, combined with quantitative angiography demonstrates vasodilation in subjects with an intact endothelium. However, individuals with endothelial damage experience paradoxical vasoconstriction.15 In peripheral arteries, infusion of a pharmacological agent with measurement of flow by gauge-strain plethysmography is possible16.
Agents that directly affect the endothelium and elicit a chemical signal are termed endothelium-dependent vasodilators. Acetylcholine, for example, acts on muscarinic receptors on endothelial cells, leading to increased intra-cellular calcium concentration, activation of nitric oxide synthase and vasodilation. Agents that affect vasodilation without involvement of the endothelium are called endothelium-independent agents. Nitroglycerin, for example, activates soluble guanyl cyclase and cyclic guanosine-3’,-5’-monophasphate (cGMP) which mediates vasodilation in the vessel wall through protein kinases regulating intracellular calcium concentrations17.
There is a non-invasive, in vivo method for quantifying endothelial dysfunction introduced by Celermajer and associates called “flow-mediated, endothelium-dependent vasodilation” (FMD)18. Briefly, changes to arterial blood flow open shear stress sensitive ion channels in the endothelium. The signal is tranduced via a second-messenger cascade and activates endothelial nitric oxide synthase (eNOS), generating NO. This species diffuses across the cell membrane to neighboring smooth muscle cells (SMC). Within the SMC, the signal is transduced, lowering intracellular calcium concentration and affecting vasorelaxation19. The diameter of the artery lumen increases, leading to an increase in blood flow consistent with the Hagen-Poiseullie equation. The effect of FMD may be abolished with administration of an NO synthase inhibitor such as mono-methylarginine (L-NMMA)20.
Celermajer et al.’s innovative work has allowed the use of high resolution B-mode ultrasound to assess the change in artery diameter during the reactive hyperemia that follows ischemia. In this technique, a human subject rests supine and the diameter of the brachial artery is measured in a longitudinal plane. A blood-pressure cuff is used to produce ischemia in the limb. Following release of the blood pressure cuff the diameter of the artery is measured again. The rapid change in shear stress is the stimulus for NO mediated vasodilation. A simple equation describes the change in the diameter relative to the baseline diameter (Equation 1). A full discussion of the parameters of this equation, hyperemia and baseline diameter, can be found in the Protocol and Results sections.
<!–Equation 1: Percent FMD
%FMD = 
In multiple studies, percent FMD has been found to predict cardiovascular events in patient with established cardiovascular disease21-24. A correlation between brachial artery percent FMD and coronary artery FMD was established by Anderson et al., demonstrating a link between peripheral measurements and the more clinically-relevant ischemic changes to the heart25. FMD does not demonstrate the maximum vasodilation of the vessel. To evaluate this, FMD can be followed by endothelium-dependent, nitroglycerin-mediated vasodilation of the same vessel.
There are technical issues affecting the measurement of percent FMD. Since the introduction of the technique, several studies showed a high degree of within-subject and inter-operator variability26. It has been shown that physiological factors such as cigarette smoking, antihypertensive medications, time of day, and fasting state affect percent FMD. Likewise, technical choices such as the position of the cuff relative to the site of measurement and duration of occlusion have been shown to affect the measurement27,28. Guidelines have been published that describe the current consensus and allow for standardization of technique between laboratories19,29.
Despite the evolving consensus on technique, flow-mediated vasodilation remains heavily operator dependent with a long learning curve. Corretti, for example, recommends the sonographer complete 100 scans under the supervision of an experienced investigator before operating independently. To maintain a level of adequate expertise, it is recommended the technician complete 100 scans annually. For investigators with a small sample population and limited resources, the learning curve presents a barrier to entry. This article will demonstrate a method for flow-mediated vasodilation of the brachial artery in the upper arm and offer technical suggestions to reduce intra-operator variability.
The key variables of flow-mediated vasodilation are shown in Table 1.
| Variable | Description |
| Mean Velocity (cm/sec) | The mean arterial velocity of blood in the middle 50% of the lumen during one cardiac cycle estimated from Doppler spectral waveforms, proportional to blood flow and inversely proportional to cross-sectional area (see Figure 1). |
| Diameter (mm) | The intima-intima distance as measured from a longitudinal view along the vessel axis (see Figure 2). This is measured at Baseline and during reactive hyperemia. |
| Flow (ml/min) | The bulk flow of fluid in the circulation, derived mathematically from mean velocity and diameter (see Equation 2). |
| Shear Stress (dynes/cm2) | The frictional force exerted by circulating blood on the intima surface, proportional to velocity and inversely proportional to diameter, derived from mean velocity and diameter (see Equation 3). |
| % FMD | The change in arterial diameter after occlusion in response to hyperemia, over the baseline diameter (see Equation 1). |
Table 1. The key variables of flow-mediated vasodilation.
This FMD protocol will provide sufficient data to measure % flow-mediated vasodilation, flow, and shear stress. Recording 60 sec of baseline data will help account for normal, physiological variation in heart rate and respiration. Analysis software will calculate diameter during the baseline and hyperemia phases. Some software packages can measure the average velocity (m/sec) during a point in the cardiac cycle by integrating the area under the velocity spectral waveform and dividing by time to arrive at a time-averaged velocity. Diameter and Velocity will allow an investigator to calculate the following variables.
Equation 1.
% FMD is defined as: .
Equation 2.
Mean Flow in ml/min is defined as:  .
.
Equation 3.
Shear Stress is defined as:  where Tw is shear stress in dynes/cm2, Q is mean volumetric flow, and µ, the viscosity of blood, is assumed to be 0.035 poise.
Example data from studies conducted at the UCSF Vascular Integrated Physiology and Experimental Therapeutics lab (VIPERx) is given in Table 2 and Table 3. Briefly, the example cohort is a randomly chosen subset of participants in the cross-sectional arm of the Omega-PAD trial (NCT01310270)30. All participants were patients referred to the outpatient vascular surgery clinic of the San Francisco Veterans Affairs Medical Center for evaluation of peripheral artery disease (PAD). PAD diagnosis was based on current guidelines of an ankle-brachial index <0.9. Patients with incompressible arteries (ABI>1.4) were excluded. Inclusion in the “No PAD” group was based on ABI > 0.9 and the absence of PAD, CAD, and CVD. Statistical analysis was done by t-test for continuous variables or chi-square test for categorical variables.
The example cohort is almost entirely male with a mean age is 68 ± 9 years and Caucasian, 74%. As a whole, participants carry a number of cardiovascular risk factors including: hypertension (84%), hyperlipidemia (78%), smoking history (86%), and obesity (mean BMI is 30 ± 6). Overall, 16% of participants carry a diagnosis of coronary artery disease (CAD) and 40% a diagnosis of diabetes mellitus.
The prevalence of hypertension was higher in the PAD group than the non-PAD group (96% vs. 72%, p = 0.02) as was CAD (32% vs. 0%, p < 0.001) and diabetes (56% vs. 24%, p = 0.02). The PAD group had greater abdominal adiposity but not to the level of significance (waist-hip ratio of 1.04 vs. 1.00, p = 0.065). Likewise, the PAD group had worse low density lipoprotein (LDL) than the non-PAD group (68 vs. 101 mg/dl, p < 0.001) but better total cholesterol (142 vs. 174 mg/dl, p = 0.002). Both groups were appropriately managed with medications, demonstrating widespread use of statins and antihypertensive medications. The PAD group shows a higher level of aspirin (84% vs. 48%, p = 0.007) and beta-blockers (60% vs. 28%, p = 0.023), consistent with their co-morbidities.
Table 3 demonstrates example flow-mediated vasodilation data from the two groups. The baseline characteristics are similar for each group showing similar diameter, velocity, and flow. The PAD group, however, demonstrate worse flow-mediated vasodilation than the non-PAD group (6.8% vs. 9.1%, p = 0.021). Results for both group fall within the expected range for individuals with cardiovascular risk factors (<10%). A review of several studies suggest a %FMD of 6-10% in healthy adults and a %FMD of 0-5% in CAD populations using lower arm occlusion31-36. Values above 10% were observed in young, healthy adults using the upper arm technique37. The %FMD for each group has a wide standard deviation, presenting an opportunity to further segment the cohort based on %FMD.
Figures 1-4 demonstrate example images collected during the phases of FMD. Figure 1 shows a Doppler Spectral waveform obtained at Baseline. The arrows indicate the extent of one cardiac cycle which forms the basis for calculating mean arterial velocity. The protocol calls for averaging the results of multiple cycles collected during 60 sec. In the example cohort, the mean baseline velocity for all participants was 17 ± 6 cm/sec. No significant difference between the PAD and No PAD cohort was seen.
Figure 2 shows an example B-mode image of the Baseline vessel diameter. The arrows indicate the location where the intima-intima distance, the basis for the lumen diameter, was measured. In the example cohort, the mean baseline diameter for all participants was 4.20 ± 0.57 mm. No significant difference between the PAD and No PAD groups was seen.
Figure 3 shows an example Doppler Spectral waveform obtained immediately after cuff release in the Reactive Hyperemia phase. The yellow arrow indicates the moment of cuff release. Waveforms obtained in the first 5 sec after cuff are used to calculate the Reactive Hyperemia Velocity. For all participants, the mean Reactive Hyperemia Velocity was 74 ± 26 cm/s. No significant difference was seen between the PAD and No PAD groups.
Figure 4 shows example B-mode image obtained 60 sec after cuff release during the Reactive Hyperemia phase. Like the Baseline diameter, the intima-intima distance is used to calculate Reactive Hyperemia Diameter. For all participants, the mean Reactive Hyperemia diameter was 4.53 ± 0.59 mm. The difference between PAD and No PAD subgroups was approached, but did not meet, significance (p = 0.08). The difference between Baseline and Reactive Hyperemia diameter forms the basis of the numerator in the %FMD variable.
| Characteristics | All patients (n = 50) |
PAD (n = 25) |
No PAD (n = 25) |
P-value |
| Age, Mean (SD), y | 68 ± 9 | 68 ± 6 | 68 ± 11 | 0.89 |
| Male Sex (%) | 98 | 100 | 96 | 0.31 |
| Caucasian (%) | 74 | 84 | 64 | 0.37 |
| BMI | 30 ± 6 | 29 ± 7 | 30 ± 4 | 0.73 |
| Waist-hip ratio (%) | 1.02 ± 0.06 | 1.04 ± 0.06 | 1.00 ± 0.05 | 0.07 |
| Systolic Blood Pressure (mm Hg) | 136 ± 19 | 139 ± 22 | 134 ± 15 | 0.33 |
| Diastolic Blood Pressure (mm Hg) | 79 ± 10 | 78 ± 11 | 80 ± 10 | 0.47 |
| Index ABI | 0.93 ± 0.27 | 0.72 ± 0.16 | 1.14 ± 0.16 | <0.001 |
| Comorbidities | ||||
| Hypertension (%) | 84 | 96 | 72 | 0.02 |
| Hyperlipidemia (%) | 78 | 88 | 68 | 0.09 |
| Hx of CAD (%) | 16 | 32 | 0 | 0.00 |
| Diabetes Mellitus (%) | 40 | 56 | 24 | 0.02 |
| Medications | ||||
| Aspirin (%) | 66 | 84 | 48 | 0.01 |
| Ace-inhibitor (%) | 48 | 52 | 44 | 0.57 |
| β-Blocker (%) | 44 | 60 | 28 | 0.02 |
| Statin (%) | 66 | 68 | 64 | 0.77 |
| Insulin (%) | 30 | 14 | 6 | 0.39 |
| PAD Risk Factors | ||||
| History of smoking (%) | 86 | 92 | 79 | 0.24 |
| Total Cholesterol (mg/dl) | 158 ± 38 | 142 ± 31 | 174 ± 37 | 0.00 |
| LDL (mg/dl) | 85 ± 32 | 68 ± 27 | 101 ± 29 | <0.001 |
| HDL (mg/dl) | 44 ± 11 | 43 ± 11 | 46 ± 10 | 0.30 |
| Triglycerides (mg/dl) | 153 ± 119 | 165 ± 125 | 141 ± 115 | 0.49 |
| Hemoglobin A1C (%) | 6.3 ± 1.5 | 6.5 ± 1.5 | 6.1 ± 1.6 | 0.38 |
| Serum creatinine (mg/dl) | 1.11 ± 0.84 | 1.28 ± 1.15 | 0.95 ± 0.22 | 0.17 |
| eGFR (ml/min) | 80 ± 21 | 75 ± 21 | 86 ± 21 | 0.10 |
| Albumin (g/dl) | 4.0 ± 0.3 | 4.0 ± 0.3 | 4.1 ± 0.3 | 0.43 |
Table 2. Baseline characteristics of a sample cohort. The following data are a randomly chosen subset of participants in the cross-sectional arm of the Omega-PAD trial (NCT01310270) and cohort . All participants were patients referred to the outpatient vascular surgery clinic of the San Francisco Veterans Affairs Medical Center for evaluation of peripheral artery disease (PAD). PAD diagnosis was based on current guidelines of an ankle-brachial index <0.9. Patients with incompressible arteries (ABI > 1.4) were excluded. Inclusion in the “No PAD” group was based on ABI > 0.9 and the absence of PAD, CAD, and CVD.
| Characteristics | All patients (n = 50) |
PAD (n = 25) |
No PAD (n = 25) |
P-value |
| Baseline Artery Diameter (SD), mm | 4.20 ± 0.57 | 4.11 ± 0.60 | 4.29 ± 0.53 | 0.27 |
| Baseline Velocity (SD), cm/sec | 17 ± 6 | 18 ± 6 | 16 ± 5 | 0.13 |
| Baseline Flow (SD), ml/min | 145 ± 68 | 151 ± 84 | 138 ± 47 | 0.51 |
| Baseline Shear Stress (SD), dynes/cm2 | 12 ± 4 | 13 ± 5 | 11 ± 3 | 0.07 |
| Reactive Hyperemia Diameter (SD), mm | 4.53 ± 0.59 | 4.38 ± 0.60 | 4.68 ± 0.55 | 0.08 |
| Reactive Hyperemia Velocity (SD), cm/sec | 74 ± 26 | 70 ± 25 | 78 ± 27 | 0.32 |
| Reactive Hyperemia Flow (SD), ml/min | 735 ± 340 | 658 ± 327 | 812 ± 342 | 0.11 |
| Reactive Hyperemia Shear Stress (SD), dynes/cm2 | 46 ± 18 | 46 ± 19 | 47 ± 18 | 0.79 |
| Brachial FMD (%) | 8.0 ± 3.7 | 6.8 ± 3.5 | 9.1 ± 3.6 | 0.02 |
Table 3. Flow-Mediated Vasodilation analysis. As described in the protocol, baseline diameter and velocity are the mean of 60 sec of data. Reactive hyperemia diameter was obtained at 60 sec post-occlusion. Reactive hyperemia velocity was the time-averaged velocity of the first 5 sec of Doppler spectral waveforms obtained after cuff-release.
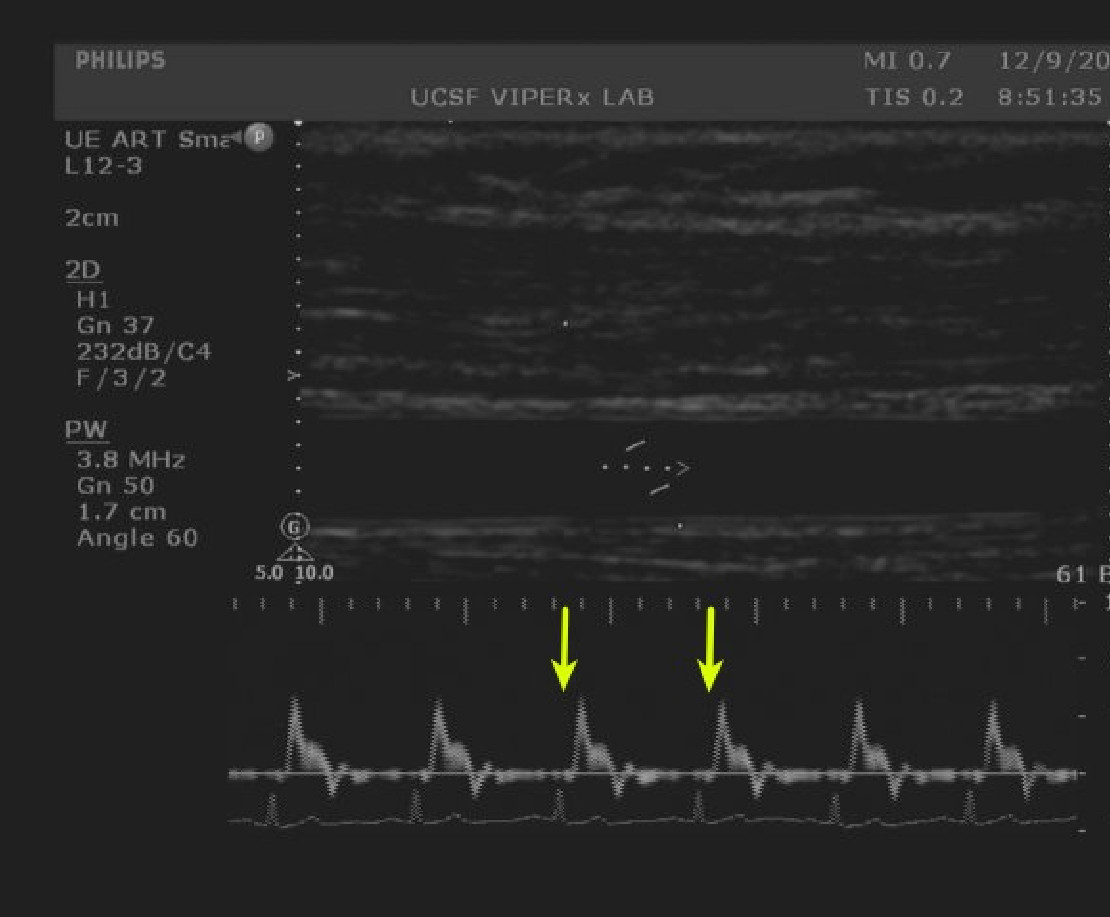
Figure 1. Baseline velocity measurements. Doppler spectral waveforms of the brachial artery are captured by an image analysis system. A single cardiac cycle is shown between the arrows. Image analysis systems can calculate the mean arterial velocity. Please click here to view a larger version of this figure.
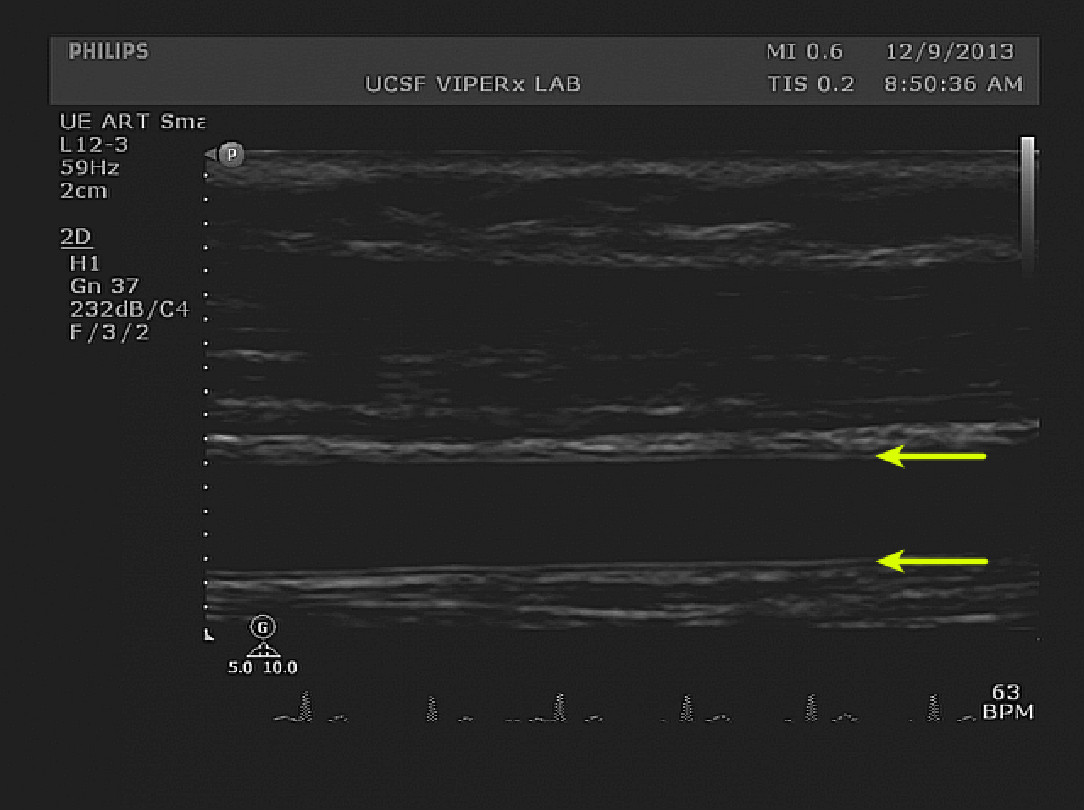
Figure 2. Baseline diameter measurements. The double-lines of Pignoli, corresponding to intima and media boundaries are visible on both the superficial and deep edges of the brachial artery (yellow arrows). The image shows proper horizontal and vertical alignment. Please click here to view a larger version of this figure.

Figure 3. Hyperemia velocity measurements. Doppler spectral waveforms immediately after cuff release are visible. The moment of cuff release can be appreciated by the sharp increase in velocity to the left of the image (yellow arrow). The top half of the image shows the positioning of the sample gate prior to cuff release. After cuff release, the artery may shift to a more superficial position. Placing the gate above the axis of the occluded artery helps compensate for vertical shifting of the artery after cuff release. Please click here to view a larger version of this figure.
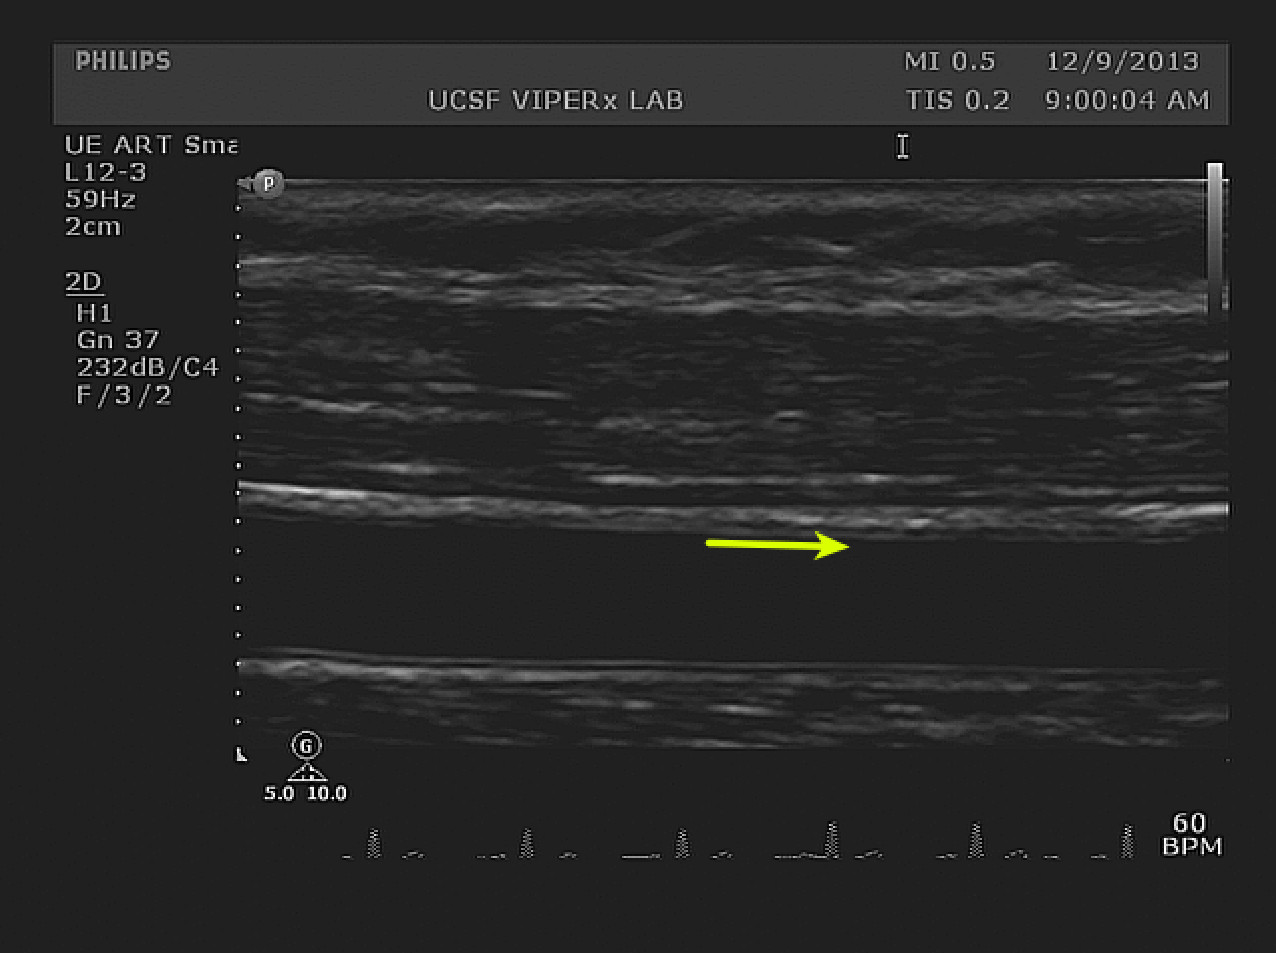
Figure 4. Hyperemia diameter measurements. A longitudinal view of the index segment after cuff release is visible. The change in diameter is small and may be quantified by image analysis software. The IMT boundary on the superficial wall is clearly visible along the index segment (yellow arrow). The width of the arrow shafts represents a 10% increase from the baseline diameter. Please click here to view a larger version of this figure.
