Primer extension1 is a molecular method to determine the 5’ ends of specific RNA molecules up to a one base resolution. The advantage to other methods such as 5’-RACE (rapid amplification of cDNA ends) is the fast turnaround time and the ability to easily analyze a mixture of different lengths of RNA molecules.
This method works by subjecting RNA molecules to reverse transcription reactions using specific fluorescent primers, generating cDNA fragments of certain lengths. These cDNA molecules are run alongside traditional Sanger sequencing reactions2 on denaturing polyacrylamide gels and can be detected by their fluorescence due to the use of fluorescently labeled primers. The lengths of the cDNA fragments are then assessed by comparison to the sequencing ladder, allowing the mapping of the 5’ RNA ends.
Traditionally, primer extension reactions are used in conjunction with radioactive isotopes to detect cDNA molecules on X-ray films. Due to health hazards, waste disposal issues and ease of handling, newer protocols utilize fluorescence for the detection of the primer extension with automated sequencers, albeit their sensitivity is slightly lower. Using fluorescently labeled primers, the recurring radio-labeling procedure can be omitted, as fluorescent primers are stable for a long time (more than a year in our hands).
The method we describe here utilizes an automated gel sequencer, but with slight modifications, capillary sequencers can be also used for the cDNA separation and detection3. The parallel nature of gel analysis makes it possible to detect even a small amount of RNA cleavage or processing. Another advantage is the high resolution of this method, as terminal cleavage or processing of even one base can be detected.
In regard to the detection of RNA cleavage or processing, typically two different types of primer extensions are distinguished. In one case, the enzymatic treatment is done in vitro using purified RNA and purified enzyme, whereas in the other case, the processing is done in vivo and the resulting RNA is purified. In both cases the RNA is subjected to a primer extension carried out in vitro, however, depending on the source of RNA, the method is either called an in vitro or in vivo primer extension. In the protocol we present here, we focus solely on the in vivo primer extension, because of ease of use (no purified proteins necessary) and the possibility to determine transcriptional starting points and processing at the same time. However, in vitro primer extensions are in principle set up the same way and this protocol can serve as a starting point.
The method illustrated here can be applied to many bacterial species as long as they are amenable to high purity and high-yield preparation of nucleic acids.
The research in our lab focuses on the regulatory scope of toxin-antitoxin (TA-) systems4,5, a field in which the primer extension method is extensively used. TA-systems are small genetic elements present in prokaryotic genomes that consist of a stable and endogenously active toxic protein and a mostly unstable protein or RNA antitoxin that counteracts toxicity6,7. Toxin activity is sometimes exerted by inhibition of replication, cell wall synthesis or other mechanisms, but most often by RNase activity8,9. Typically, RNase specificity is determined by conducting different tests, one of which is the primer extension method. Primer extension reactions are well suited for this application, as a mixture of cleaved and full length fragments can be simultaneously analyzed to determine their 5’ ends. Using a mix of in vitro and in vivo primer extensions, the specific toxin RNase cleavage, e.g., sequence specificity can be determined10-13.
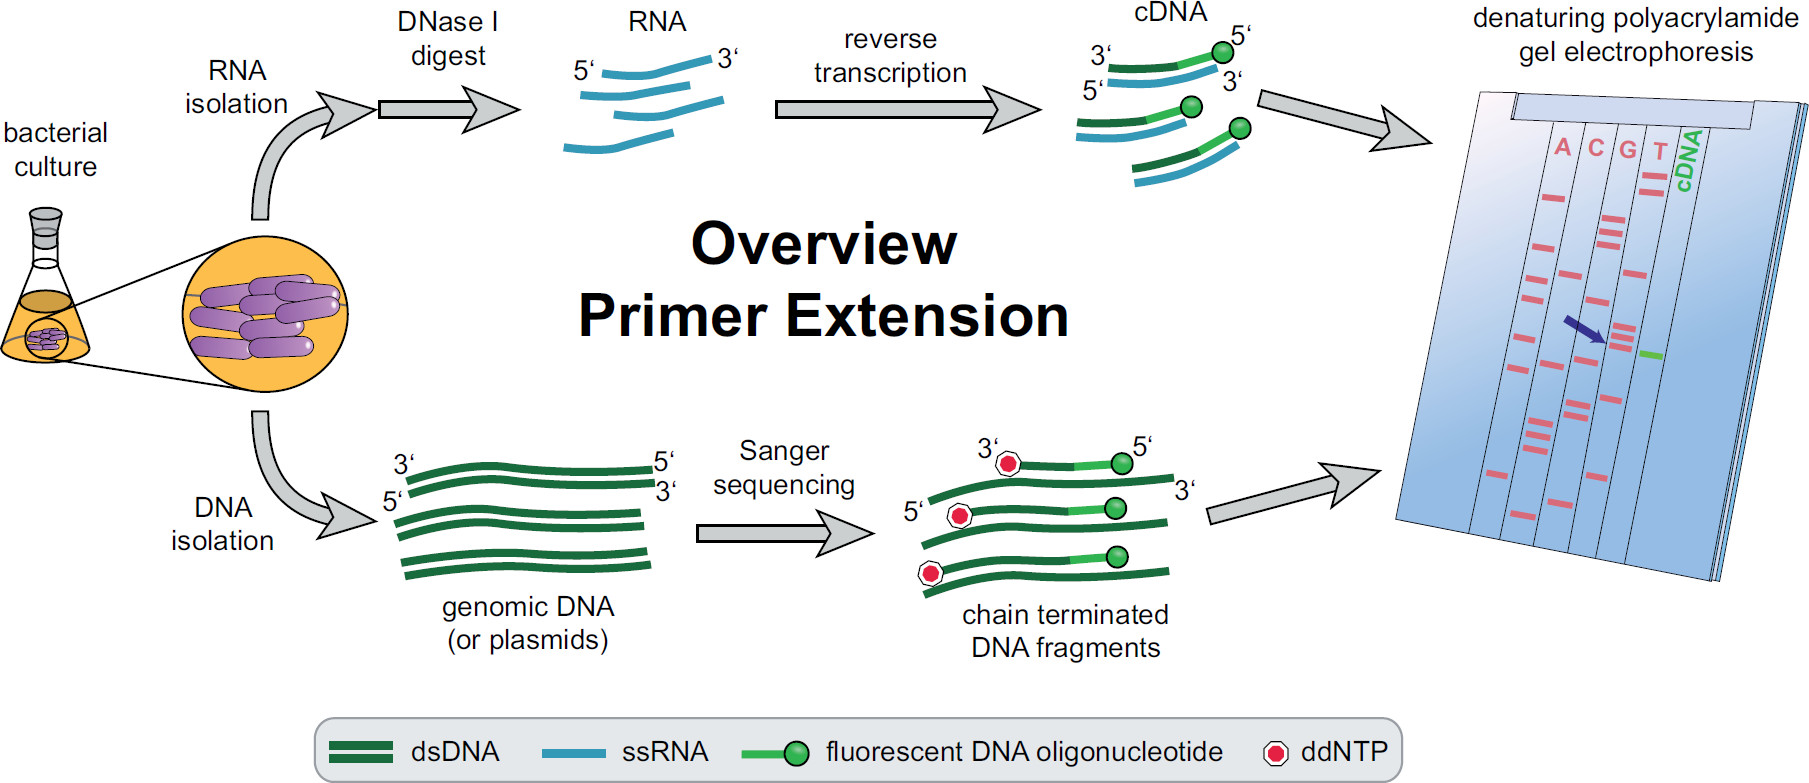
Figure 1. Overview of primer extension procedure. Bacterial cultures are incubated and treated according to the experimental needs. Total RNA is extracted from the cells, treated with DNase I to remove DNA traces and subjected to a reverse transcription reaction using target specific fluorescent DNA primers yielding cDNA. Genomic DNA or plasmids are extracted and subsequently used for fluorescent Sanger sequencing reactions for size comparison with the cDNA fragments. Primer extension products are run alongside Sanger sequencing products on a denaturing urea polyacrylamide gel and analyzed with an automated laser and microscope. The sequencing base that lines up with the cDNA band is the last base of the 5’ cDNA end (blue arrow). More information in Fekete, et al. 3 Please click here to view a larger version of this figure.
An overview of the whole primer extension procedure can be found in Figure 1. Briefly, bacterial cells are cultured, harvested, the cell pellet lysed and the RNA extracted. Purified RNA is then treated with DNase I to remove traces of DNA molecules which could act as templates for the reverse transcriptase. Specific fluorescent primers are added to the RNA, hybridized to the region of interest and subsequently reverse transcribed, resulting in single stranded complementary DNA (cDNA). A sequencing ladder is created by traditional Sanger sequencing employing fluorescent primers and separated on a denaturing polyacrylamide gel alongside of the primer extension cDNA fragments. The resulting gel is analyzed by comparing the fluorescent bands, allowing the identification of the 5’ ends of interest. Transcriptional starting points and processing sites are then assessed individually by sequence comparisons.
1. High Yield RNA Preparation
- RNA Isolation
NOTE: High concentrations of total RNA are needed for the primer extension reaction. Spin column kits usually do not yield the amount of RNA needed (~5 – 16 µg in 5 µl volume). Therefore purification using the acid guanidinium thiocyanate-phenol-chloroform extraction method is recommended, outlined below.
NOTE: Phenol is carcinogenic, toxic and corrosive. Please read the material safety data sheets and use under a fume hood with appropriate protection!- Grow or treat the bacterial cells (S. aureus or E. coli in this example) as desired and harvest by 10 min centrifugation at 4,600 × g and 4 °C. Note: Typically we harvest a total OD600 of 20 – 70. Cell pellets can be stored for several weeks at -20 °C.
- Resuspend the cell pellet in 1 ml of acid guanidinium thiocyanate-phenol-chloroform solution and transfer to a 2 ml screw cup containing 0.5 ml of 0.1 mm glass zirconium/silica beads.
- Lyse the cells three times in a fast prep/bead beater at 6.5 m/sec for 30 sec for three rounds, cooling the samples on ice for 5 min after each run. Note: Homogenized sample can be stored at -80 °C for several weeks.
- Incubate lysate for 5 min at RT and then add 200 µl of chloroform.
- Vigorously shake or vortex the sample for 30 sec to extract RNA.
- Incubate at RT for 3 min then centrifuge for 15 min at 13,000 – 15,000 × g and 4 °C. Note: Solvents are separated into a lower organic phase (pink, contains proteins), an interphase (white, contains DNA) and an upper aqueous phase (clear, contains RNA).
NOTE: From this step on use only RNase free reagents and plastic ware! - Prepare fresh RNase-free 1.5 ml reaction tubes, label appropriately and add about 500 µl of 100% RNase free isopropanol each (use approximately the same volume as the aqueous phase in the previous tube).
- Hold the tube at an angle and transfer the aqueous phase (about 500 µl) to the prepared tubes using RNase free tips. Do not disturb the interphase.
- Precipitate the RNA by inverting several times and incubating for 10 min at RT.
- Centrifuge the samples for 15 min at 13,000 – 15,000 × g and 4 °C and remove supernatant by pipetting or aspiration (water jet pump and feeding bottle). Do not disturb the white transparent RNA pellet at the bottom.
- Add 1 ml of 70-80% RNase free ethanol (do not vortex) to wash. Note: RNA in ethanol can be stored for several weeks at -20 °C.
- Centrifuge for 5 min at 7,500 × g and 4 °C and discard supernatant by pipetting or preferably aspiration.
- Air dry RNA pellet for 15 – 30 min under the fume hood. Do not overdry, otherwise pellets might be difficult to redissolve.
- Resuspend the pellet in 50 µl of RNase free ddH2O or RNA storage buffer.
- Measure RNA concentration with a microvolume UV-Vis spectrophotometer or a quartz cuvette (and conventional photometer) and proceed to DNase I digestion.
- DNase I digestion of RNA to remove traces of DNA
NOTE: Since DNA may act as a spurious template in the reverse transcription (primer extension) reaction, it should be removed from the sample. Various methods for removing DNA from RNA solutions are available which usually rely on DNase digestion. A simple but effective and cost efficient method for DNA removal is outlined below.- Preheat water bath to 37 °C.
- Mix the compounds listed in Table 1 in a 1.5 ml reaction tube.
- Incubate the mixture for 1 hr at 37 °C in a water bath, and then proceed directly to the phenol/chloroform extraction. Note: Heat inactivation of the DNase I is not recommended, as this might degrade the RNA.
- Phenol/chloroform extraction of RNA after DNase I Digestion
NOTE: The RNA must be purified to remove free nucleotides, DNA fragments and buffer components from the DNase I digestion. Phenol/chloroform extraction allows for high recovery and concentration of the RNA sample and is therefore outlined below. Other methods for RNA purification might also be used, if they satisfy these requirements.- Split the 500 µl DNase I digestion mix into two 250 µl samples in 2 ml reaction tubes.
- Add 1 volume (250 µl) of acidic P/C/I solution (in water saturated phenol, chloroform and isopentanol, ratio of 25:24:1, pH 4.5 – 5).
NOTE: P/C/I solution is carcinogenic, toxic and corrosive. Please read the material safety data sheets and use under a fume hood with appropriate protection! - Vigorously vortex or place in a vortexing platform for 1 – 3 min.
- Centrifuge for 30 min at 13,000 – 15,000 × g and 4 °C.
- Collect the upper (aqueous) phase and transfer to fresh tube (250 µl).
- Add 1/9 volume (28 µl) of 3 M sodium acetate pH 5.2.
- Add 2.5-3 volumes of pure ethanol (700 µl).
- Mix by vortexing shortly and place at -80 °C for 30 min or at -20 °C for 2 – 3 hr. If needed, store the RNA O/N at -20 °C.
- Centrifuge for 30 – 60 min at 13,000 – 15,000 × g and 4 °C.
- Remove supernatant by pipetting or aspiration.
- Wash pellet by adding 1 ml of 70% ethanol onto the pellet. Do not vortex sample.
- Centrifuge sample for 5 min at 13,000 – 15,000 × g and 4 °C.
- Remove supernatant by pipetting or aspiration.
- Air dry pellet under the fume hood. Store the pellet at -20 °C O/N if needed.
- Dissolve the pellet in 30 µl DEPC treated H2O by vortexing for 2 min and use this solution to dissolve the pellet of the corresponding second tube per sample (30 µl solution per one extraction pair).
- Measure RNA concentration, and ensure that it exceeds 1 µg/µl for use in primer extension of averagely expressed mRNAs.
- If needed, store the RNA at -20 °C for several weeks up to few months.
2. Primer Extension Reaction
- Primer design
NOTE: When designing primers for a primer extension experiment, obey general guidelines of PCR primer design (see the manual accompanying the automated gel sequencer for more information and discussion section in this paper).- Specifically, ensure that the primers (i) do not contain runs of bases, (ii) possess a G or C at the 3’ end, (iii) have a balanced GC:AT ratio, (iv) have an annealing temperature of about 55 – 60 °C and (v) bind at least 50 bp, better 100 bp downstream of the region of interest to receive clear images.
- Primer extension reaction
NOTE: The primer extension reaction (cDNA synthesis) requires high amounts of template RNA. If the amounts of RNA used are chosen to low, the signal may be too low to detect! We therefore recommend purification of the RNA as described above.
NOTE: CAUTION: Use RNase free reagents and plastic ware!!!- Preheat the thermo-cycler to a temperature of 95 °C and carry out all further incubation steps in a thermo-cycler for ease of use and reproducibility.
- Mix the compounds from Table 2 in a PCR tube for each RNA sample.
- Denature the samples for 1 min at 95 °C.
- Place the tubes on ice and chill for 5 min to hybridize RNAs and primers.
- Set the PCR machine to 47 °C.
- In the meantime prepare the reverse transcription master mix as described in Table 3.
- Add 4 µl of reverse transcription master mix to each hybridized RNA sample.
- Incubate the tubes for 1 hr at 47 °C. Note: The optimal temperature for AMV RT is 42 °C, however higher temperatures help to overcome secondary structures of the RNA molecules.
- Stop the reaction by heating the samples to 95 °C for 2 min.
NOTE: Formamide is corrosive, toxic and can be harmful to the unborn child. Please read the material safety data sheets, handle with care and wear appropriate protection! - Add 6 µl of formamide loading dye (95% (v/v) deionized formamide, 10 mM EDTA, 0.05% (w/v) bromophenol blue) and store for O/N to two weeks at -20 °C in the dark.
3. Preparation of the Sequencing Ladder
NOTE: The sequencing ladder reaction requires either moderate amounts of plasmids or high amounts of genomic DNA. Whenever possible, the use of plasmids in the sequence reaction is recommended due to the ease of isolation and high signal intensity. In other cases, we routinely use a method adopted from Marmur5,14 to prepare genomic DNA from E. coli and S. aureus cells without the need to use phenol. In principal any method that yields high amounts and purity of genomic DNA can be used.
- Genomic DNA Isolation
- Grow 10 ml of E. coli or S. aureus cells O/N in LB, BM5 or TSB medium.
- Harvest cells by centrifugation for 10 min at 4,600 × g in a 15 ml falcon tube.
- Resuspended pellet in 2 ml buffer P1 as found in some mini preparation kits (50 mM Tris-HCl pH 8.0, 10 mM EDTA, 100 μg/ml RNase A).
- Lyse cells for 45 – 60 min with 20 – 40 µl lysostaphin (0.5 mg/ml, storage at -20 °C). Note: For E. coli cells the enzymatic pre-treatment can either be omitted or lysozyme used.
- Add 100 µl of saturated SDS-solution (in 45% ethanol) to the suspension and incubate for 5 min at 37 °C.
- Add 650 µl 5 M NaClO4 and the briefly vortex cells.
NOTE: Chloroform is a potential carcinogen. Please read the material safety data sheets and use under a fume hood with appropriate protection!!! - Add 3 ml of chloroform/isopentanol (24:1 ratio) to the mixture and shake for at least 60 sec. Note: The liquid should turn into a homogenous white emulsion.
- Centrifuge sample for 10 min at 4,600 × g and RT to separate phases.
- Carefully transfer the clear upper (aqueous) phase to a fresh tube. If solution is turbid, repeat the chloroform/isopentanol extraction. Measure the volume of the DNA solution and prepare a fresh tube with 2 volumes of Ethanol (100%).
- Slowly decant or pipette the DNA solution into the ethanol containing tube. Note: DNA should precipitate as transparent, dense coils on the bottom or when completely dehydrated as a floating white cluster.
- Retrieve the DNA using hooks made from glass Pasteur pipettes (Figure 2) and wash each sample twice by dipping into an individual tube of 1 ml of 70% ethanol.
- Place the hooks upright in a rack and air dry the pellet for 60 min. If necessary, store the dried DNA for several days at RT.
- Dissolve DNA by breaking off the DNA covered glass hooks and placing in a 2.0 ml reaction tube containing 100 – 500 µl ddH2O. Adjust volume to a final DNA concentration of 1,000 – 1,500 ng/µl. For one sequencing reaction, use 10 – 18 µg of genomic DNA.

Figure 2. Instruction on how to create a DNA fishing rod. Hold the tip of a glass Pasteur pipette into the flame of a Bunsen burner. This causes the glass to start melting after several seconds, creating a small hook at the end. Quickly remove from the flame and let cool for 1 min.
- Plasmid Isolation
- Prepare plasmids using standard mini preparation kits and dissolve in elution buffer (10 mM Tris-Cl, pH 8.5). Depending on the plasmid size, use 100 – 500 ng of plasmid for one sequencing ladder.
- Sanger Sequencing reaction
NOTE: Find below a simple protocol that uses a fluorescently labeled primer sequencing kit with 7-deaza-dGTP that works well for the purpose of primer extensions. Refer to the sequencing kit manual for detailed information. Please note that the sequencing reaction must use the same primer as the primer extension reaction to create products of the same length.- Mix 12 µl of genomic DNA (~10 – 15 µg) with 1 µl DMSO and 1 µl fluorescently labeled primer (2 pmol/µl).
- To each 1 µl of the four sequencing reaction mixes (A, C, G or T), add 3 µl of the DNA/DMSO/Primer mix.
- Place the samples into a PCR machine, and run the following PCR program: 95 °C for 2 min; 35 cycles of 95 °C for 20 sec, 54 °C for 20 sec, 70°C for 30 sec; keep at 4 °C forever.
- After the run, remove the samples from the machine, add 6 µl of loading dye and store on ice (short term) or at -20 °C for several days to weeks.
4. Gel Setup and Apparatus Run
NOTE: Detailed information on how the sequencing gel apparatus is assembled, the gel is prepared and how the gel is run can be found in the manufacturer protocol.
- Preparations
- Prepare 10x TBE as indicated in Table 4.
- On the day of the gel run prepare 1 L of 1x TBE buffer with ultrapure ddH2O.
- Prepare 10% (w/v) APS. Note: Can be stored in 200 µl aliquots at -20 °C for several months, but activity may decrease over time.
- Assembly of gel casting chamber
- Avoid dust and lint between the glass plates. Therefore thoroughly clean working surfaces using wet wipes.
- Clean a pair of 25 cm glass plates using disposable paper towels and distilled water on both sides and then isopropanol for the inner side of the glass plates.
- Place 0.25 mm spacers on the rear glass plate and lower the notched glass plate on top (Figure 3).
- Attach the gel rails to both sides of the glass plates with the notched end and the rail entry pilots facing upwards and tighten knobs lightly.

Figure 3. Exploded view of the gel electrophoresis glass plates. Glass plates should be used directionally. Take care to face the inner side of the glass plates inwards and the outer side outwards.

Figure 4. View of an assembled gel apparatus. After injecting the gel solution, the pocket spacer is placed in the solution between the glass plates. The casting plate is then slid between the front glass plate and the gel rails and secured by fastening the rail knobs.
- Casting the gel
NOTE: non polymerized acrylamide is neurotoxic! Please read the material safety data sheets and use with appropriate protection!!!- Add the compounds listed in Table 5 into a beaker and mix using a stir bar and a magnetic stirrer.
- Immediately after adding APS and TEMED, take up the gel solution in a 50 ml syringe and place a 0.45 nm filter on the tip.
- Either hold the top edge of the glass plate with one hand or place the sandwich in a gel casting stand to create a slope angled 10 – 20°.
- Slowly dispense the gel solution between the glass plates while continuously moving the syringe tip from one side to the other and stop once the gel solution meets the bottom end.
- Move to the side or remove completely any formed bubbles using a bubble hook.
- Slide the gel pocket spacer (0.25 mm) between the glass plates at the notched end, submerge into the gel solution and fix by attaching the casting plate.
- Fasten upper rail screws lightly (See Figure 4 for fully assembled apparatus).
- Let gel set for 1 – 2 hr.
- Remove the casting plate and pocket spacer and clean the pocket from salt and gel residues.
- Rinse with ddH2O and wipe up excess solution with tissue papers.
- Running and visualizing the gel
NOTE: The sequencing gels are directly subjected to electrophoresis in the gel imager, while the fluorescence is simultaneously detected by a laser microscope. In contrast to conventional gel electrophoresis, where the gel is run first and then stained and visualized, the detection unit is fixed and scans the bands in real time as they pass the laser. Below a procedure for the ImagIR Data collection software on OS/2 is outlined, which can be adopted to more recent versions. For more information see the user manual.- Slide the buffer tank holder into the gel rails on the front glass plates and tighten the knobs.
- Place gel into the lower gel tank of the automated gel imager against the heating plate and fix by sliding the rail entry pilot into the apparatus brackets.
- Fill 1x TBE buffer into the lower and upper gel buffer chambers, close the lower buffer chamber and connect the upper buffer chamber to the power using the power cord.
- If present, clean the gel pocket from salt-residues by repeatedly pipetting buffer into the pocket.
- Close the top buffer tank chamber using the top buffer lid.
- Close the machine door and switch on the imager and computer and start the Base ImagIR Data collection software.
- Create a new project file (File->New…), enter a project filename, select the appropriate laser ranges (700 or 800 nm) and confirm with OK.
- Select Options->Auto gain… from the image menu at the top, click Auto to start auto gain measurement and accept settings by clicking OK.
- Focus the laser by selecting Options->Focus… from the scanner control menu, clicking on the Auto button and accepting the settings by clicking OK.
- Repeat the auto gain procedure to adjust to the newly focused region.
- Setup the scanner control according to these settings: 2,000 V, 35 mA, 45 W, 45 °C, Scan filter: 3, Scan speed: 3.
- Prerun the empty gel for 20 min (select voltage ON and press <ENTER>).
- In the meantime, heat the sequencing ladder and the primer extension products in a PCR machine for 2 min to 90 °C, then cool on ice.
- Stop the electrophoresis, open the automated gel sequencer and remove the upper buffer tank lid.
- Insert the shark tooth-comb in between the glass plates and slightly pierce the gel with the shark teeth (see Figure 5).

Figure 5. Close-up view of gel with shark tooth comb. Sample (purple) is applied in between the shark teeth.
- Pipette either 1 – 2 µl of the primer extension products or sequencing ladder reactions into each gel pocket (formed by the shark teeth).
- If not all pockets are needed, fill empty pockets with loading dye to prevent inconsistent running behavior.
- Close the buffer tank and door of the gel sequencer.
- Start electrophoresis and turn on laser (Select Voltage ON and Laser ON and press <ENTER>).
- Stop electrophoresis once region of interest has passed the laser.
As depicted in Figure 6, a primer extension reaction can be used to determine the transcriptional starting points of transcripts of interest and can help to deduce promoter regions (typically identified by -10 and -35 elements). The topmost (longest) cDNA fragment represents the 5’ end of the mRNA and thus can be easily mapped when compared to the sequencing ladder.

Figure 6. Representative result of a primer extension reaction. On the left side a full in vivo primer extension gel from E. coli with various plasmids is shown. Individual areas of interest are enlarged. In the top part (A), the determination of the ompA transcriptional starting point is depicted. The reverse transcription stops at the 5’ end of the mRNA and thus creates a band of the full length RNA (indicated by an arrow). By aligning the cDNA band with the sequencing ladder, the 5’ end of the mRNA can be determined as shown in the accompanying sequence. In the lower part (B), the cleavage of the ompA transcript by the YoeB-seq2 RNase is shown. Lanes 1 – 3 represent samples in which the toxin YoeB-seq2 is missing or inactive, whereas lanes 4 – 5 represent samples with an active RNase, coinciding with the absence and presence of cDNA products. Two main cleavage products are created as indicated by the arrows. The ddNTP used in each lane and the corresponding RNA base of the sequencing ladder is labeled. Transcript parts are indicated by blue font, promoter elements and AUG start codon by magenta font. For more information; see the original research article from Nolle et al., Microbiology 159, 1575-1585 (2013). Please click here to view a larger version of this figure.
In the example shown in Figure 6, the TSP of the ompA mRNA was determined to be a G base (marked with an arrow in the sequence below the gel). This is consistent with the ompA TSP published before15. The -35 and -10 elements of the promoter can be deduced to be TTGTAA and TAGACT16 as the motifs only differ two bases each from their respective consensus sequences (TTGACA and TATAAT respectively).
In contrast to other methods such as 5’ RACE, primer extension reactions can be used to accurately determine and quantify the cleavage of RNA molecules. Cleavage of RNA molecules creates free 5’ ends, which can be simultaneously detected as cDNA bands in the gel. Identifying several cleavage products of one mRNA is more difficult in 5’ RACE experiments, since several PCR products must be sequenced to obtain cleavage products that only represent a small fraction of the total (unprocessed) RNA bulk.
In the lower part of Figure 6, the RNA mapping of the cleavage by an RNase is depicted. As previously described5, the RNase YoeB-seq2, part of a TA-system from S. equorum17, cleaves mRNAs close to the start codon. This cleavage can be inhibited by the cognate anti-toxin YefM-seq2. When the RNase YoeB is not present or inactive (lanes 1 – 3), no primer extension products are formed close to the start codon. Whenever RNase activity is present (lanes 4 & 5), two strong bands shortly downstream of the start codon appear. Using this approach, cleavage patterns can be easily identified.
Figure 7 shows a failed primer extension experiment. Due to excess RNA in the reverse transcription reaction, the generated amount of cDNA creates such a strong signal, that individual cDNA bands cannot be distinguished. This makes 5’ RNA end determination impossible.
When using highly expressed RNAs in the primer extension reaction, such as a ribosomal RNA (as depicted in Figure 7), the risk of over-exposed areas increases. Therefore, the amount of total template RNA must be adjusted to the abundance of the RNA of interest. In contrast, when transcripts of interest only constitute a small amount of the total RNA, the amount in the reverse transcription reaction must be increased, otherwise the signals will be too faint (not shown). This also applies to the Sanger sequencing reaction, as multicopy templates per cell (such as rRNA genes or genes encoded on plasmids) result in much stronger signals.

Figure 7. Representative result of a failed primer extension from S. aureus. 16S RNA is highly abundant in bacterial cells. This leads to strong reverse transcription signals when moderate amounts of total RNA are used. In the case depicted here, the strong cDNA bands mask the exact 5’ end and therefore prevent 5’ mapping. In addition, ribosomal RNAs are highly structured and therefore can terminate reverse transcription prematurely, producing short cDNA products that do not represent full length fragments. In this case increasing reverse transcription temperature, together with a heat resistant reverse transcriptase can make it easier to synthesize past secondary structures. Due to multiple copies of the sequence in the genomic DNA, the Sanger sequencing ladder is stronger than for single copy genes. To improve the gel picture, RNA and DNA amounts for the reverse transcription and Sanger reaction should be reduced and/or less product applied to the gel. Please click here to view a larger version of this figure.
Table 1: DNase I digestion of RNA.
| Substance | Amount |
| RNA from step above | 70 – 100 µg |
| 10x DNase I Buffer (100 mM Tris, pH 7.5, 25 mM MgCl2, 5 mM CaCl2) | 50 µl |
| DNase I, RNase free (2 U/µl) | 10.0 µl (up to 10 µg of RNA per 1 µl of DNase I) |
| Bring volume up to 500 µl with ddH2O (DEPC treated) | |
Reaction volume and amount of DNase I can be scaled up or down depending on the amount of RNA used.
Table 2: RNA-Primer hybridization.
| Compound | Amount for one reaction |
| RNA | 5 – 15 µg |
| Fluorescently labeled primer | 2 pmol |
| Bring volume of to 6 µl with ddH2O (DEPC treated) | |
Set up one reaction per RNA sample and primer.
Table 3: Primer extension master mix.
| Compound | Amount for one reaction |
| ddH2O (DEPC treated) | 1.3 µl |
| AMV RT Buffer (10x) | 1.0 µl |
| dNTPs (10 mM, RNase free) | 1.0 µl |
| RNase Inhibitor | 0.2 µl |
| AMV Reverse Transcriptase (RT) (20 – 25 U/µl) | 0.5 µl |
Scale up to the number of reactions needed.
Table 4: 10x TBE recipe.
| Substance | Amount |
| Tris Base | 107.8 g |
| Boric Acid | 55.0 g |
| EDTA | 7.4 g |
| Bring volume up to 1,000 ml with ultrapure ddH2O and filter to remove dust and lint | |
Filter to remove dust and lint and store at 4°C.
Table 5: Sequencing gel recipe.
| Compound | Amount |
| Urea | 10.5 g |
| ddH2O (MilliQ) | 13.0 ml |
| 10x TBE | 2.5 ml |
| XL Rapid gel solution | 5.0 ml |
| TEMED (N,N,N′,N′-Tetramethylethane-1,2-diamine) | 25 µl |
| APS (Ammonium persulfate, 10%) | 175 µl |
Process gel solution quickly after the addition of TEMED and APS.
