Studies of biomolecules in vivo are crucial for understanding molecular function in a biological context. Here we describe a novel method allowing the internalization of fluorescent biomolecules, such as DNA or proteins, into living microorganisms. Analysis of in vivo data recorded by fluorescence microscopy is also presented and discussed.
Method Article
Internalization and Observation of Fluorescent Biomolecules in Living Microorganisms via Electroporation
In This Article
Summary
Abstract
The ability to study biomolecules in vivo is crucial for understanding their function in a biological context. One powerful approach involves fusing molecules of interest to fluorescent proteins such as GFP to study their expression, localization and function. However, GFP and its derivatives are significantly larger and less photostable than organic fluorophores generally used for in vitro experiments, and this can limit the scope of investigation.
We recently introduced a straightforward, versatile and high-throughput method based on electroporation, allowing the internalization of biomolecules labeled with organic fluorophores into living microorganisms. Here we describe how to use electroporation to internalize labeled DNA fragments or proteins into Escherichia coli and Saccharomyces cerevisiæ, how to quantify the number of internalized molecules using fluorescence microscopy, and how to quantify the viability of electroporated cells. Data can be acquired at the single-cell or single-molecule level using fluorescence or FRET. The possibility of internalizing non-labeled molecules that trigger a physiological observable response in vivo is also presented. Finally, strategies of optimization of the protocol for specific biological systems are discussed.
Introduction
Most fluorescence studies inside living cells depend on protein fusions with fluorescent proteins (FPs), such as GFP1. These fluorescent tags allow studies of the copy number, diffusion pattern or localization of proteins involved in processes such as gene expression or membrane transport2-7. FPs offer high labeling specificity, easy implementation, and are available in a large inventory of variants with various photophysical and chemical properties1. However, organic fluorophores remain the prime choice for in vitro experiments due to their greater photostability (up to 100-fold more stable than FPs)8,9, small size (up to 100-fold smaller volume than FPs) and ease of intramolecular labeling (mainly through the use of cysteine residues). All these factors are particularly important for single-molecule fluorescence and FRET studies10.
Several internalization methods combining the advantages of organic labeling and in vivo detection have been introduced over the past decade; however, such methods either employ relatively large polypeptides tags (e.g., TMP, HALO, or 20 kDa SNAP tags)11-14, require the use of unnatural amino acids15, or are limited to large, single-membrane eukaryotic cells (e.g., scrape loading, syringe loading, microinjection)16-19.
This protocol describes a novel, straightforward and high-throughput internalization method that couples the advantages of organic fluorophores with in vivo observation. To develop this technique, we adapted the electroporation procedure commonly used to transform cells with plasmid DNA20,21 in order to load microorganisms, such as E. coli or S. cerevisiæ with organically labeled biomolecules. The protocol consists of 4 simple steps: incubation of cells with labeled biomolecules, electroporation, cell recovery, and cell washing to remove non-internalized biomolecules. Here, we present this electroporation protocol, as well as the cell imaging and data analysis processes to study cell-based and single-molecule fluorescence and FRET signals.
Electroporation relies on discharging a high-voltage electric field across a low ionic strength cell suspension to form transient membrane pores through which biomolecules can enter cells (Figure 1)20,21. Just as with transformation of bacteria or yeast with plasmid DNA, cells have to be prepared prior to electroporation to ensure their electrocompetency. This procedure, consisting of several washing steps with water, increases the membrane permeability and lowers the ionic strength of the cell solution to avoid arcing in the electroporation cuvette. In this protocol, cells can be prepared as described below (See PROTOCOL: 1.1) or bought from commercial providers.
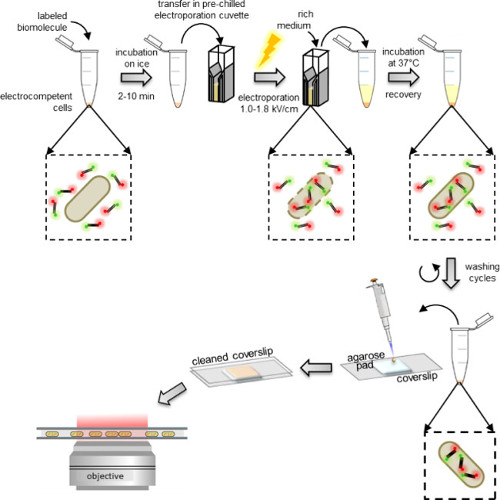
Figure 1: Schematic representation of the internalization protocol. From left to right: add a few microliters of labeled biomolecules to the aliquot of electrocompetent cells (doubly-labeled DNA fragments and bacteria in this example); incubate 1 to 10 min on ice and transfer to a pre-chilled electroporation cuvette; electroporate and then add 0.5-1 ml rich medium to the cells immediately after; incubate at 37 °C (or the temperature required by the organism, e.g., 29 °C for yeast) to let the cells recover; perform 5 washing steps to remove any excess non-internalized labeled molecules; resuspend the final pellet in 100-200 μl of PBS buffer and pipette 10 μl on an agarose pad; cover the pad with a cleaned coverslip and image on a fluorescence microscope (in wide field mode or HILO mode).
Electrocompetent cells are incubated with the labeled biomolecules just before electroporation, which can be performed using standard electroporators found in most biochemistry laboratories. Immediately after electroporation, cells are incubated in a rich medium allowing their recovery before washing (Figure 1). The excess of non-internalized labeled biomolecules is first removed by washing in a buffer containing a fairly high concentration of salt and some detergent (See PROTOCOL: 3.3). The presence of salt disrupts non-specific electrostatic interactions formed by non-internalized labeled biomolecules which otherwise may stick on the outer membrane. Similarly, the presence of detergent in the washing buffer disrupts non-specific hydrophobic interactions.
While DNA internalization is straightforward (Figure 2), precautions need to be taken when internalizing labeled proteins using electroporation. First, the stock sample of organically labeled protein might still contain a small percentage of free dye. Free dye molecules are much smaller than proteins and might therefore be internalized preferentially. To ensure that the vast majority of the observed internalized fluorescent molecules correspond to the protein of interest, the initial protein sample should contain less than ~2% free dye (Figure 5)22. The excess of non-internalized labeled proteins can also stick to the outer cell membrane after electroporation; this phenomenon is protein-specific and needs to be checked for each new protein. We propose several options that allow the removal of non-internalized proteins from the loaded cell sample (See PROTOCOL: 3.3.3).
Finally, cells are resuspended in a small volume of phosphate buffer and pipetted onto an agarose pad, allowing their imaging on a fluorescence microscope. Immobilization on agarose pads is a simple and efficient way of imaging cells on a coverslip without harming their integrity. The pad should contain a low-fluorescence culture medium.
Cell imaging can be performed either in widefield, total internal reflection fluorescence (TIRF) or using HILO (Highly Inclined and Laminated Optical Sheet) microscopy. In the HILO configuration, the laser beam penetrates deeper into the specimen than in TIRF, yet does not illuminate the entire sample as for widefield, allowing a greater signal-to-noise ratio23. Depending on the laser power and time resolution used, internalized biomolecules can be counted (using stepwise-photobleaching analysis, Figure 3), localized, or tracked24-28. Internalization of doubly labeled constructs with a FRET pair of fluorophores allows the quantification of FRET both at single-cell or single-molecule levels (Figure 6).
Different parameters can be varied depending on the desired output and the biological system studied. First, the amount of internalized material per cell can be tuned by altering the concentration of labeled biomolecules added to the cells prior electroporation (Figure 2). Electroporation field strength will also influence both the loading efficiency and cell viability; as expected, while the loading efficiency increases with increasing field strength, the viability of electroporated cells decreases (Figure 4A). Both parameters can be quantified by recording the percentage of loaded and dividing cells after electroporation. This viability assay coupled with fluorescence imaging also verifies the observation of internalized biomolecules in living cells and allow continuous observation over several generations (Figure 4B).
In summary, this protocol allows the internalization of fluorescently labeled DNA and protein molecules into E.coli or S. cerevisiæ26. Individual molecules labeled with organic fluorophores can be tracked with high spatiotemporal resolution for timescales an order of magnitude longer than FPs. Finally, this method is compatible with widefield, TIRF and confocal detection, as well as pulsed excitation schemes, such as ALEX (alternating laser excitation28,29).
Protocol
1. Cell preparation
- Preparation of lab-made electrocompetent bacteria
- Prepare a 5-10 ml overnight preculture from a single colony of the E.coli strain of interest in a low-fluorescence medium such as M9 or EZ Rich Defined Medium.
- In the morning, inoculate a new 400 ml culture with the overnight preculture such that OD600 nm starts at 0.02. Add to the 400 ml low-fluorescence medium 2.5 ml of 1 M MgSO4 and 2.5 ml of 1 M MgCl2.
- Grow at 37 °C and 250 rpm until OD600 nm reaches 0.4 to 0.6.
- Stop the growth by chilling the culture in an ice-water bath for 10-15 min.
Note: From now on, carry out all steps at 4 °C (on ice). - Centrifuge the culture 15 min at 1000 x g. Discard the supernatant and resuspend the cell pellet in 250 ml chilled and sterile distilled H2O.
- Repeat the centrifugation and resuspension steps twice, decreasing the volume of water to 100 ml and then 50 ml.
- Centrifuge the culture 10 min at 1000 x g. Discard the supernatant and resuspend the cell pellet in 25 ml chilled and sterile distilled H2O + 10% glycerol.
- Repeat the centrifugation and resuspension steps three times, decreasing the volume of 10% glycerol solution to 10 ml, 5 ml, and finally to 500 µl.
- Aliquot the cells in aliquots of 20 µl each, flash-freeze in liquid nitrogen and store at -80°C.
- Commercial electrocompetent bacterial cells
- Dilute a commercial cell aliquot 1:1 with sterile chilled distilled water. Make 20 µl aliquots and store at -80 °C.
- Preparing electrocompetent yeast
Note: Electrocompetent S. cerevisiæ cells are prepared before each electroporation experiment and cannot be stored at -80°C as for E. coli.- To start, inoculate 50 ml YPD medium with a single colony of the desired strain of interest.
- Incubate at 30 °C and 250 rpm until the OD600 nm reaches 0.6 to 0.8.
- Centrifuge cells at 1000 x g for 5 min at 4 °C.
- Resuspend the pellet in 25 ml chilled and sterile distilled H2O.
- Repeat the washing steps resuspending twice in 25 ml water and resuspending twice in 2 ml of a chilled solution of sorbitol at 1 M.
- Resuspend the cells in 250 µl of 1 M sorbitol and split the cells into 50 µl aliquots.
2. Agarose pad preparation
- To remove background fluorescent particles, burn a coverslip in a furnace at 500 °C for 1 hour. “Clean burned” coverslips can be stored for weeks at room temperature covered in aluminum foil.
Note: Other common cleaning methods such as plasma cleaning or piranha solution might be used as long as the background fluorescence of the cleaned slides remains quasi-null. - Prepare a low-fluorescence agarose solution by melting in a microwave oven a 2% agarose - distilled water solution (70 °C). Immediately add 500 µl of the clear 2% agarose solution to 500 µl of 2X low fluorescence culture medium and mix gently.
- Before it cools down and harden, promptly pipette this agarose - medium solution on a microscope coverslip (No 1.5 thickness) in order to form a pad of roughly 2 cm diameters and a few millimeters height. Avoid bubbles and pop them with a pipette tips if needed.
- Flatten the pad with a second “burned” coverslip (No 1.5 thickness, see Figure 1).
Note: This upper coverslip helps form a flat homogeneous pad and protect from dust and drying while cells are being prepared. Minimal medium such as M9 or rich medium such as EZ Rich Defined Medium have been tested for their low fluorescence.
3. Electroporation
- Incubation
- Add up to 5 µl of labeled molecules stored in a low-salt buffer (< 50 mM salt) to a single aliquot of competent cells (20 µl bacteria or 50 µl yeast) and incubate 10 min on ice.
Note: The concentration of fluorescently labeled molecules in the stock solutions and thus the amount of labeled molecules added to the cell prior to electroporation is directly correlated with loading efficiency (Figure 3, and Discussion). As some proteins are less compatible with low salt condition, the salt concentration in the storage buffer might be increased but the volume of labeled molecules added to the cells prior electroporation then needs to be decreased. - Transfer the mixture of cells and labeled biomolecules into a pre-chilled electroporation cuvette (0.1 and 0.2 cm spacing for bacteria and yeast, respectively). Gently tap the cuvette on the bench to remove any potential bubbles from the solution.
- Place the cuvette into the electroporator and apply a high-voltage electric pulse to the solution (0.9 to 1.8 kV/cm, see Discussion for more details on choosing voltage). Such a pulse forms transient pores in the cell membranes allowing labeled biomolecules to diffuse into the cells.
- Check that the time constant displayed on the electroporator is between 4 to 6 ms. Lower time constants are often due to too high salt concentration and/or the presence of bubbles in the cuvette, and will lead to very low or no loading of the cells.
- Add up to 5 µl of labeled molecules stored in a low-salt buffer (< 50 mM salt) to a single aliquot of competent cells (20 µl bacteria or 50 µl yeast) and incubate 10 min on ice.
- Recovery
- Immediately after electroporation, add 500 μl of rich medium such as SOC, EZ Rich Defined Medium, YPD or any rich medium to the cells.
- Incubate the sample at 37 °C for bacteria and 29 °C for yeast for 2 to 10 min. For viability measurements, where the user wants to evaluate the percentage of cells growing and dividing after electroporation, use a longer recovery time (up to 1 hour) as we observe such lag times before the first cell division.
- Washing steps
- Wash the cells to remove any non-internalized biomolecules by spinning down the cells for 1 min at 3300 x g and 4 °C. Discard the supernatant and resuspend the cells in 500 μl PBS.
Note: For each sample, prepare a negative control of cells incubated with the same amount of labeled biomolecules but not electroporated and washed exactly the same way as the main sample. - Repeat the previous steps 3 times.
- In the case of protein internalization, optimize the washing procedure depending on the properties and behavior of the labeled protein of interest. The following steps are example of possible optimizations:
- Perform the first 3 washing cycles using PBS containing 100 mM NaCl and 0.005% Triton X100 to remove non-internalized proteins which might stick to the outer cell membrane22,26.
- Filter the electroporated cells with a 0.22 µm pore diameter filter fitted inside a 1.5 ml microcentrifuge tube by pipetting the electroporated cells into the filter. Spin down for 3 min at 800 x g and 4 °C. Discard the flow-through. Add 500 µl new PBS over the cells and spin them once again as before and repeat these steps once22.
- Add a small amount of protease K (10 ng in 500 μl PBS) during the first washing cycle to allow the digestion of any non-internalized protein.
- Perform the first 3 washing cycles using PBS containing 100 mM NaCl and 0.005% Triton X100 to remove non-internalized proteins which might stick to the outer cell membrane22,26.
- Spin down the cells for 1 minute at 3300 x g and 4 °C. Discard the supernatant and resuspend the cells in 150 μl of PBS.
- Spread the loaded cell solution on the agarose pad by removing the upper coverslip and spreading 10 µl of the cell suspension droplet by droplet. Replace an unused clean burned coverslip (No 1.5 thickness, matching the microscope objective specification) on the top of the pad and press very gently on the slide.
- Protect the electroporated cells from light by storing the pads in an opaque box while imaging different samples.
- Wash the cells to remove any non-internalized biomolecules by spinning down the cells for 1 min at 3300 x g and 4 °C. Discard the supernatant and resuspend the cells in 500 μl PBS.
4. Microscope data acquisition
Note: Single-cell and single-molecule fluorescence microscopy in living microorganisms can be performed on any appropriate fluorescence microscope (custom-built or commercial).
- Settings
- Widefield or HILO illumination
- Image samples with any TIRF/single-molecule microscope.
Note: As an example, we use in the laboratory a customized inverted microscope with a TIRF set-up. Beams from a 532-nm and a 637-nm diode laser are combined and collimated before focusing onto the back focal plane of the objective. Fluorescence from the sample is collected through the same objective, separated from the excitation light using a long-pass and a notch filter, and split into red and green channels using a dichroic mirror. The two channels are imaged onto separate halves of the chip of an electron-multiplying charge-coupled device (EM-CCD) camera. Videos are recorded using the kinetic mode. White light images are obtained using a white light lamp and a condenser attached to the microscope as an illumination source. - For general single-molecule observation, set the illumination mode of the microscope to TIRF or HILO23 (see Discussion for more details about TIRF versus HILO imaging). To set an HILO mode on a TIRF microscope, decrease slightly the angle of incidence of the excitation light to shift the focus slightly higher than the coverslip surface (image the cell interior rather than its lower membrane in contact with the coverslip, see 4.5.4).
- For cell-level analysis, long single-molecule tracking experiments or step-wise photobleaching analysis, set the illumination mode of the microscope to a widefield mode ensuring the continuous observation of the whole cell volume and therefore of all internalized labeled molecules.
- Image samples with any TIRF/single-molecule microscope.
- Typically, use excitation powers around 0.5-3 mW (~50-400 W/cm2).
Note: Lower laser powers are useful to achieve long-lived fluorescence observation and tracking (over 1 minute) while higher laser powers might be required for higher spatiotemporal resolution or stepwise photobleaching analysis. - Use exposure times ranging from 15 ms for tracking experiments to 100 ms for more general observation and intensity quantification. Note: Other frame rates and modes can be used such as stroboscopic illumination, particularly for studying fast diffusing species 30.
- In the TIRF microscope, record the fluorescence channel on an electron-multiplying CCD (EMCCD) camera at a magnification resulting in a pixel length of ~100 nm/pixel. The TIRF setup is describe in greater details in reference26.
- Widefield or HILO illumination
- Data acquisition
- Switch off or block the laser illumination until the start of the experiment. Switch the EMCCD camera gain off to prevent damage to the camera due to overexposure.
- Place the agarose pad sandwich upside down on the microscope stage, with the cell-covered side facing downwards, in order to bring the cell close to the objective. Set the focus on the cells in transmitted light microscopy mode28. Record an image of each cell of view under white light imaging in order to locate the cell outlines before switching off the white light.
- Protect the sample from lab ambient light.
- For HILO excitation mode, adjust the angle of the excitation beam to each maximum signal-to-noise ratio by illuminating only the section of the sample close to the coverslip surface.
- To achieve HILO illumination, focus the laser beam into the back focal plane of a 100x NA 1.4 objective28 (higher numerical apertures such as 1.45 or 1.49 are also suitable). By shifting the focusing lens perpendicular to the beam, the focus moves apart from the objective center so that the beam exits the objective with an angle.
- Adjust the lens position in order to maximize the signal-to-noise ratio, intracellular fluorescence intensity versus extracellular background signal.
- Switch the camera gain and start data acquisition before switching on the laser.
- While recording data, acquire a white-light image of each FOV before or after recording the fluorescence data; this helps to identify cell boundaries in the fluorescence channels.
- For viability estimation
- Use a low-fluorescence rich medium in the agarose pad to allow cells to grow after electroporation.
- Equilibrate the microscope to the optimal temperature for the studied microorganism (37 °C for E. coli, 29 °C for S. cerevisiæ) with an objective heater system.
- Record both white light and fluorescence images every 30 min, making sure to remain on exactly the same field of view during the entire data recording. A lag of ≈1 hour is typically observed before cells start to divide.
- Counting the number of internalized biomolecules per cell
- Set the laser power to high values (2-3 mW) and long exposure time (100 ms).
- Set the illumination to widefield mode in order to illuminate the entire cell.
- Record movies as described in step 4.2 making sure to record additional frames (50-100 frames) after the completion of the fluorescence photobleaching.
5. Data analysis
- General analysis
- Analyze the recorded images and movies, both in white light and fluorescence excitations, using an imaging software, such as the free software ImageJ.
- In ImageJ, open the images or movies recorded on the microscope (TIF format) in File>Open>Your file location.
- To qualitatively compare fluorescence intensities on a computer screen, make sure that all the fluorescence images are displayed with the same brightness and contrast settings in Image>Adjust>Brightness/Contrast. Adjust manually or automatically the settings for a selected image, press “Set” button and select the “Propagate to all the other images” option.
- Set the type of information to extract :Analyze>Set Measurements, and select (at least) “Area”, “Standard deviation”, “Min & max gray value” and “Mean gray value”.
- To compare cell fluorescence intensities, select the area s of interest using the Freehand selection button of ImageJ and extract the cell intensities in Analyze>Measure. The resulting table contains the measurement values and can be saved and/or copied to other software. The “Mean” value corresponds to the average intensity per pixel in the selected area and can be directly compared between cells or between a cell and the background.
- In an electroporated cell sample, a cell is considered loaded if its average intensity per pixel is larger than the average intensity per pixel of the negative control plus 3 times its standard deviation (Av(I loaded cell) > Av(I–EP)+3*StdDev(I–EP)).
- Build false-colored fluorescence overlay images and movies in order to evaluate the quality and loading of the samples.
- In ImageJ, overlay images such as the white light image and the fluorescence image corresponding to the same FOV in Image>Colors>Merge channels. Select a color for each image (C4(gray) for the white light, C1(red) for red channel, C2(green for green channel…etc.).
- Check on the overlay image that the fluorescence is located within the cell boundaries (white light image) and that background fluorescence is low and homogeneous (no bright spots outside the cell boundaries).
- Before analyzing a large number of cells, check qualitatively the images corresponding to the negative sample are similar to the empty cell images and display much lower intensities than the electroporated cells.
- For viability experiments, count manually the percentages of dividing, non-dividing but visibly intact (identical) and damaged (dead) cells from the same field of view growing over time (See 4.2.6).
- Evaluate the viability of at least 200 cells per sample (electroporated, negative control and empty cells) in order to gather enough statistics.
- Analyze the recorded images and movies, both in white light and fluorescence excitations, using an imaging software, such as the free software ImageJ.
- Cell-based analysis
- Counting the number of internalized biomolecules per cell by step-wise photobleaching analysis
- Segment cells by selecting the area of interest using the Freehand selection button of ImageJ and draw a shape surrounding precisely the cell (equivalent to cell membrane).
- Extract the cell intensities over time in Image>Stacks>Plot Z-axis Profile. The resulting graph represents the average intensity per pixel for the area within the cell boundary versus each movie frame resulting in a photobleaching curve for that specific cell. It contains an initial exponential decrease of the cell intensity reaching a lower asymptote (background fluorescence). The measurement values and can be saved and/or copied to other software by clicking on “Save” or “Copy”.
- Copy and paste the bleaching values into a spreadsheet column (Iraw).
- Calculate the average autofluorescence per pixel remaining after photobleaching (Iauto) by averaging the Iraw values obtained for the last 50-100 frames (lower asymptote).
- Subtract the average autofluorescence per pixel remaining after photobleaching for that cell from the initial photobleaching curve: Ibleaching = Iraw - Iauto.
- Use baseline-subtracted photobleaching timetraces (Ibleaching versus frame) showing less than 10 quantized steps to evaluate the average step size (unitary fluorophore intensity) due to the bleaching of a single fluorophore26.
- Evaluate the number of internalized molecules per cell by dividing the initial baseline-subtracted cell intensity (Ibleaching at t = 0) by the unitary fluorophore intensity.
- Single-cell FRET efficiencies
- Measure the average cells intensity per pixel in both the donor and acceptor emission channels (upon donor excitation) and within the cell boundary for each channel as explain in 5.1.1.4.
- Measure the average pixel intensity for the background in each channel from a blank area of the slide.
- Subtract this background intensity from the average intensity per pixel. Use these background-subtracted fluorescence intensities to calculate FRET for each cell by calculating the background-subtracted acceptor intensity divided by total (acceptor + donor) background-subtracted intensity upon donor excitation: Iacceptor / (Iacceptor + Idonor)
- Counting the number of internalized biomolecules per cell by step-wise photobleaching analysis
- Single-molecule analysis
- Single-molecule tracking and diffusion analysis
Note: The protocol for tracking diffusing fluorescent molecules in living cells and to evaluate their apparent diffusion coefficient has been described26,28.- Briefly, fit the images of single fluorophores in each frame by a 2D elliptical Gaussian. Link localized molecules to a track if they appeared in consecutive frames within a window of 5-7 pixels (0.48-0.67 μm). Use a memory parameter of 1 frame to account for the transient disappearance of a fluorophore due to blinking or missed localization.
- In vivo smFRET analysis
- Manually identify localized molecules inside cells from movies by going through a movie in ImageJ and identify immobile (or fairly immobile) molecules in the FRET (acceptor) channel.
- To extract the intensities in the acceptor and donor channel corresponding to an immobile molecule, select the area around the molecule in each channel using the “Oval” selection button of ImageJ (circle around each single fluorophore, using a ∼3-pixel radius) and extract the molecule intensities in Analyze>Measure. The resulting table contains the measurement values and can be saved and/or copied to other software.
- Calculate background values per channel from the average pixel intensity from a circle of the same size in a blank area of the slide over all frames analyzed.
- Use background-subtracted fluorescence values in the donor and acceptor channels (upon donor excitation) for the fluorescence and FRET time traces, as in the single-cell FRET case (see 5.2.1.7).
Note: Automated and robust analysis and algorithms have been described in References26-28,31.
- Single-molecule tracking and diffusion analysis
Results
Sample preparation
The different steps of the protocol are presented as schematics in Figure 1. As an example, we represented the loading of bacteria with doubly labeled (donor and acceptor dyes) DNA fragments. Representative results for DNA internalization are shown in Figure 2. For each electroporated sample, data for empty cells and non-electroporated cells were also recorded (Figure 2). “Empty cells” correspond to electrocompetent cells neither incubated with fluorescent biomolecules nor electroporated; their intensity in the fluorescent channel reflects the autofluorescence level under identical experimental conditions (laser power, time resolution, temperature, etc.). “Non-electroporated cells” (also called –EP, i.e., minus EP) correspond to a negative control in which electrocompetent cells have been incubated with the fluorescent biomolecules but not electroporated. These non-electroporated cells should exhibit a fluorescence level similar to the autofluorescence of the empty cells and significantly lower than the fluorescence intensity displayed by loaded, electroporated cells. This confirms the removal of any non-internalized labeled biomolecules that could have adhered to the outer cell membrane.
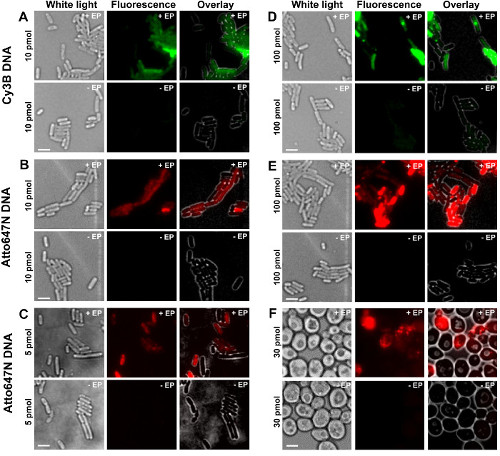
Figure 2: Representative results for the internalization of dsDNA labeled with different fluorophores at different concentrations in bacteria (A-E) and yeast (F). Left to right: white-light, fluorescence and overlay images. -/+ EP denotes incubation without/with electroporation. Scale bars: 3 µm. A. Cy3B dsDNA, 10 pmol, E. coli. B. ATTO647N dsDNA, 10 pmol, E. coli. C. Alexa647 dsDNA, 5 pmol, E. coli. D. Cy3B dsDNA, 100 pmol, E. coli. E. ATTO647N dsDNA, 100 pmol, E. coli. F. ATTO647N dsDNA, 30 pmol, Yeast. This figure has been modified from reference 26. Please click here to view a larger version of this figure.
Counting the number of internalized biomolecules per cell
The procedure to estimate the number of internalized labeled biomolecules per cell using photobleaching analysis is presented in Figure 3 and Supplementary Movie 2, together with representative results obtained with different concentrations of labeled DNA. Cell loading efficiency increases with the initial amount of incubated labeled DNA, allowing the user to tune the number of labeled molecules per cell from a “single-molecule” level (<10, Supplementary Movie 2B) to an “ensemble” level (>10, Supplementary Movie 2A). A robust way of estimating the percentage of loaded cells is to count the number of electroporated cells displaying a cell intensity above the average cell intensity of non-electroporated cells plus 3 times their standard deviation (i.e., Av(I–EP)+3*StdDev(I–EP) where Av = average, I = intensity per pixel, Std. Dev. = standard deviation and –EP = non-electroporated) as shown in Figure 3.
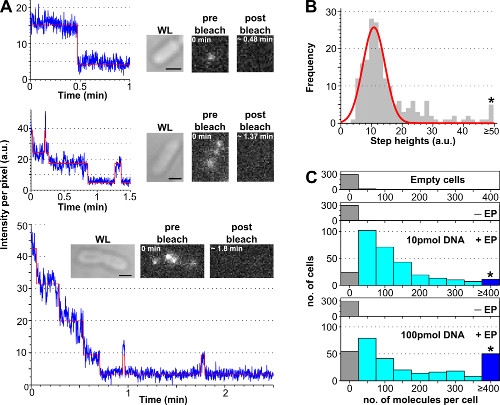
Figure 3: Counting the number of internalized molecules using photobleaching analysis. (A) Single-cell photobleaching analysis. Examples of fluorescence intensity timetraces (blue: raw data; red: fit; insets: WL and fluorescence images of E. coli loaded with ATTO647N-labeled dsDNA before and after bleaching). Top: single-step bleaching event. Middle: cell containing ±3 molecules showing bleaching and blinking. Bottom: cell containing >10 steps corresponding to at least 10 molecules. (B) Histogram of single-step height intensities from an automated step-fitting algorithm from 57 cells containing less than 6 distinguishable steps. Single-Gaussian fit is centered at 11 ± 3 a.u., corresponding to a unitary fluorophore intensity of 8100 photons per second. The asterisk marks the bin gathering all the step heights above or equal 50 a.u. (C) Histogram of internalized molecules per cell electroporated with different amounts of ATTO647N dsDNA, calculated after dividing the initial fluorescence intensity by the unitary fluorophore intensity. Top to bottom: empty cells (i.e., not incubated with fluorescent molecules and not electroporated), non-electroporated (but incubated with fluorescent molecules, named –EP), and electroporated cells incubated with 10 and 100 pmol dsDNA (named +EP). Empty and non-electroporated cells correspond to autofluorescence, whereas electroporated cells show a broad distribution of internalized molecules, with a higher proportion of highly loaded cells at 100 pmol (≥ 4 molecules, see asterisk-marked bin). Internalization efficiency (fraction of cells with Int. > mean + 3x Std. Dev. of non –EP sample) for the 10 and 100 pmol samples was 94% and 90%, respectively. Mean number of internalized molecules per cell: 121 ± 106 molecules for 10 pmol dsDNA, and 176 ± 187 molecules for 100 pmol dsDNA. Settings: 100 ms exposure, widefield illumination. Scale bars: 1 μm. This figure has been modified from reference 26. Please click here to view a larger version of this figure.
Cell loading and viability
In addition to changing the amount of labeled biomolecules added to the cells prior to electroporation, the user can tune the amount of internalized molecules by choosing different field strengths during electroporation (Figure 4, Supplementary Movie 1). Higher field strengths lead to greater internalization efficiencies, but lead to a slight decrease of cell viability. For protein internalization, the use of a filtration step may help remove non-internalized labeled proteins (see 3.3.3.1.1). In such cases, cell filtration ensures that observed fluorescent proteins are indeed internalized inside the bacterial cytoplasm; we note, however, that filtration also has a negative impact on cell viability (for more details, see REF 22).
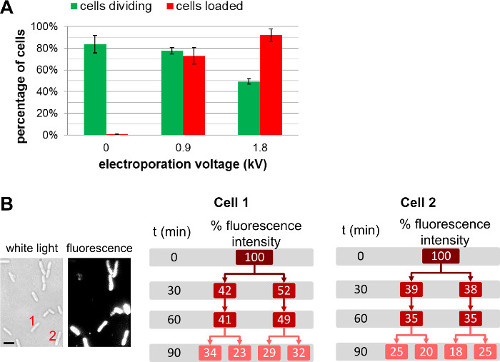
Figure 4: Influence of electroporation voltage upon cell loading and viability. (A) Bar chart representing the effect of electroporation field strength on loading efficiency (red bars) and viability of the cells (green bars). 84 ± 8 % of the non-electroporated cell (0 kV/cm) divide after 1 h on an agarose pad at 37 °C. Under the same conditions, 78 ± 3 % and 49 ± 3 % of the cells electroporated at 0.9 kV/cm and 1.8 kV/cm respectively divide after 1 hr. For loading efficiency, 73 ± 8 % of the cells are loaded at 0.9 kV/cm, while 92 ± 6 % of the cells are loaded at 1.8 kV/cm. The error bars represent the standard deviation calculated from three independent measurements; more than 200 cells were analyzed for each sample and each repeat. Overall loading efficiency increases with electroporation voltage to the slight detriment of cell viability. (B) Cell-based fluorescence measurements over several generations show that the overall fluorescence intensity is shared equally between both daughter cells. Cell 1 and 2 refers to the cell number in the white light image (left) and fluorescence image at t = 0. Scale bar: 1 µm). This figure has been modified from reference 26.
Protein internalization
Representative results for protein internalization are in Figures 5A & B. It is particularly important to remove as much of the remaining free (unreacted) dye from the protein sample as possible prior to electroporation. In the examples in Figures 5A & B, the Cy3b-labeled Klenow Fragment sample (Cy3b-KF, where KF is the Klenow fragment of the E. coli DNA Polymerase I, 66 kDa) only contains 1% free dye; such dye contribution to the overall cell loading is negligible. Comparisons of the electroporated sample of interest with both the non-electroporated cells (incubated with the same amount of labeled protein) as well as cells electroporated with the equivalent amount of free dye constitute two required controls to ensure that the observed fluorescent molecules are indeed internalized labeled proteins.
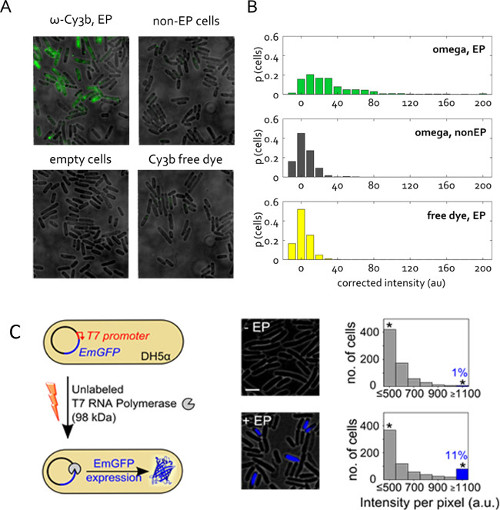
Figure 5: Protein internalization in live bacteria. (A) Representative fluorescence overlay field of views. Cells electroporated at 1.4 kV voltage with 50 pmol RNAP ω subunit from a protein stock solution that contained only 1% free Cy3b dye. Non-electroporated (non –EP) and empty cells are defined as previously. Free dye was internalized at the same concentration as in the RNAP ω electroporated sample. Imaging in wide field mode, 532-nm excitation at 1 mW, 50 ms exposure. (B) Distribution of uncorrected cell-averaged intensities for samples in (A), given in proportion of the total cell count. More than 400 cells per sample were segmented. This figure has been modified from reference 22. (C) Internalization of unlabeled T7 RNA polymerase (T7 RNAP, 98 kDa) into electrocompetent DH5α carrying the pRSET-EmGFP plasmid encoding emerald GFP (EmGFP) under control of a T7 promoter. Left: Schematic of assay. Middle: fluorescence overlay. Right: histograms of cell-based fluorescence intensities for the non-electroporated sample (top) and cells incubated and electroporated with T7 RNAP (bottom); approximately 11% of the electroporated cells show high fluorescence intensity (fraction of cells with Int. > mean + 3x Std. Dev. of non –EP sample) indicating expression of EmGFP. The asterisks indicate bins gathering all the intensities above or equal 1,100 a.u. Scale bar: 3 μm. This figure has been modified from reference 26.
Figure 5C presents another application of protein electroporation. Here, the electroporated protein is unlabeled, but its internalization triggers an observable fluorescent response. This experiment verifies the presence and functionality of electroporated proteins in the cell cytoplasm. Unlabeled T7 RNA polymerase (98 kDa) was internalized into E. coli strain DH5α containing a plasmid encoding for fluorescent protein EmGFP under the control of a T7 promoter26. As the gene for T7 RNA polymerase is absent in DH5α, EmGFP expression in our experiments requires that functional T7 RNA polymerase is introduced into the cells via electroporation (Figure 5C). Following electroporation with 1 pmol T7 RNAP, >11% of the cells (blue bar, Figure 5C) exhibited fluorescence higher than the negative control (incubated with the same amount of T7 RNAP, but not electroporated). This result establishes that a proportion of the T7 RNAP molecules internalized by electroporation retain their integrity in vivo and can perform their intended functions in the cell cytoplasm.
In vivo FRET at the single-molecule and single-cell levels
Finally, the internalization and analysis of doubly labeled species in living bacteria is presented in Figure 6 and Supplementary Movie 3. As fluorescent protein fusions are not ideal for in vivo smFRET studies, the ability to deliver doubly labeled biomolecules into living cells using electroporation is one of the great assets of this method. Figure 6A presents single-cell FRET analysis of bacteria loaded with different FRET DNA standards (using Cy3B and Atto647N fluorophores as donor-acceptor FRET pair). Cells are electroporated with 20 pmol of three short doubly-labeled dsDNA FRET standards with apparent FRET efficiencies (E*) of 0.17, 0.48, and 0.86 in vitro (previously determined26). All DNAs enter cells efficiently (Figure 6A, left) and the main peak of each single-cell E* distribution agrees well with the in vitro results (Figure 6A, right). In the intermediate- and high-FRET samples, cell populations with lower E* than expected are observed, presumably due to a combination of acceptor bleaching and photophysical inactivity, variable cell loading (thus, variable signal-to-noise ratio) and DNA degradation.
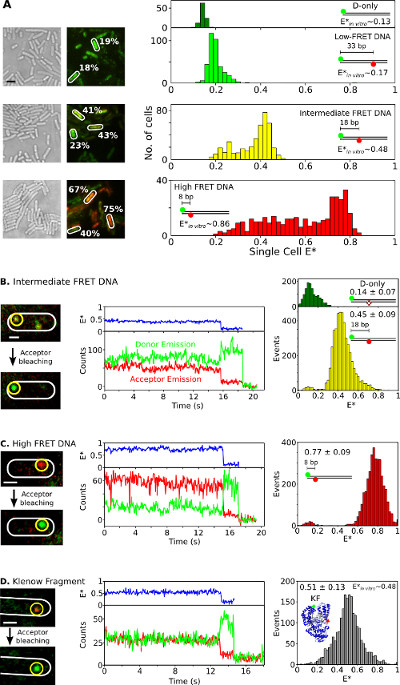
Figure 6: Representative results for single-cell and single-molecule FRET observation in living bacteria. Ensemble and smFRET studies in single bacteria. (A) Analysis of cells loaded with 20 pmol each of three DNA FRET standards exhibiting low (~0.17), intermediate (~0.48), and high (~0.86) FRET (as measured using in vitro single-molecule measurements; see REF 26). Left: white light and green/red (FRET) fluorescence overlay images (Scale bar: 3 μm). Examples of FRET values from different cells are indicated (white). Right (top to bottom): uncorrected cell-based FRET (E*) histograms for donor only (dark green), low (light green), intermediate (yellow), and high (red) FRET DNA standards. (B–D) In vivo smFRET. Cells are loaded with 0.25 pmol intermediate-FRET DNA (panel B), 0.25 pmol high-FRET DNA (panel C), and 5 pmol doubly-labeled KF (panel D). Left column: green/red fluorescence overlay of single frame before and after acceptor photobleaching. Middle column: time traces corresponding to the molecule in the yellow circle. FRET efficiencies, donor emission intensities, and acceptor emission intensities are displayed in blue, green, and red, respectively. Right column: FRET histograms of donor only molecules (green) and donor-acceptor molecules (yellow, red, and gray) from 20 time traces for each sample. Scale bars: 3 μm for A, 1 μm for B–D. This figure has been modified from reference 26. Please click here to view a larger version of this figure.
To observe smFRET in vivo for DNA or protein samples, low amounts (0.25 pmol) of intermediate- and high-FRET DNA standards (Figure 6B, C) or 5 pmol of double-labeled KF (Alexa647/Cy3B fluorophores as FRET pair, Figure 6D) are electroporated into E. coli. Such concentrations led to many cells loaded with few (n = 1–10) labeled molecules, allowing direct localization, tracking, and FRET monitoring for single molecules. Some molecules diffuse freely, whereas others appear immobile or diffuse slowly (Supplementary Movie 3). Timetraces of immobilized doubly-labeled biomolecules (Figure 6, middle) last for 1 to 30 s and show the hallmarks of smFRET: anticorrelated changes in the donor and acceptor fluorescence upon acceptor bleaching (for example, t~16 sec; Figure 6B, middle), followed by single-step donor bleaching (for example, t~;19 sec; Figure 6B). FRET distributions generated from such timetraces (Figure 6, right) result in a mean value that is in excellent agreement with published in vitro studies26,31,32. These results establish the capability for quantitative smFRET studies on internalized DNAs and proteins, and suggest that proteins maintain their integrity and structure upon electroporation and internalization (as supported by the T7 RNAP internalization experiments).
Supplementary Movie 1: Cell viability. Left: White light images. Right: fluorescence images. Animated GIF animated showing the division after electroporation (1.8 kV/cm) of bacteria loaded with 10 pmol Atto647 labeled DNA. The overall apparent decrease of fluorescence is due to the dilution of labeled DNA upon cell division and also partially to the photobleaching which occurs during each measurement.
Supplementary Movie 2: Cell-based photobleaching studies. A. Representative example of a heavily loaded cell (containing >100 Atto647N-labeled DNA molecules). Top left, white light image of the cell of interest (red rectangle). Top right, movie of the loaded cells showing their fluorescence decay over several minutes. Bottom, time trace of the overall fluorescence intensity decay of the cell of interest. Organic fluorophores can exhibit photobleaching lifetimes 2 orders of magnitude higher than FPs (here, ~41 sec for Atto647N). B. Representative example of a cell loaded with less than 10 labeled molecules (3 in this case). Top, same as panel A. Bottom, time trace of the overall fluorescence intensity of the cell of interest showing single step bleaching and/or blinking corresponding to single organic fluorophores. The average height of these steps corresponds to the single-molecule unitary intensity (here ~12 a.u.) used to estimate the initial number of internalized molecules per cell. Movies under continuous red laser excitation at 300 µW power and 100 msec per frame.
Supplementary Movie 3: In vivo single-molecule FRET. Top: Cells loaded with 0.25 pmol high-FRET DNA (as in Figure 6C) continuously monitored at 50 ms per frame under nTIRF illumination using 1 mW green (532 nm) laser. Each frame is a green/red (FRET) fluorescence overlay of each channel. Diffusing and immobile red (intact) and green (single active label) DNA molecules can be observed. Bottom: Time trace corresponding to the molecule in the yellow circle. FRET efficiencies, donor emission intensities, and acceptor emission intensities are displayed in blue, green, and red, respectively. Anti-correlated acceptor bleaching event (red-to-green transitions) corresponds to the signature of single-molecule FRET.
Discussion
Many parameters can be varied during cell electroporation and data acquisition depending on the biological system of interest and the precise nature of the experiment (cell-level or single-molecule analysis). For example, when electroporating DNA into bacteria, 0.25 to 5 pmol of labeled dsDNA fragments leads to a low internalization efficiency, allowing direct single-molecule detection (i.e., without the need for photobleaching beforehand). Above 5 pmol dsDNA, cells tend to be heavily loaded, a regime better suited for single-cell analysis. All labeled DNAs should also be previously gel-purified in order to remove any trace of free dye (non-reacted fluorophore) from the DNA stock solution. Besides, potential issues with DNA degradation, particularly for smFRET experiments, can be addressed by using DNAs with unnatural nucleic acids, or motifs that protect exonuclease-accessible termini such as hairpin loops.
Another adjustable parameter in electroporation is the field strength applied during electroporation. Low field strength (~1 kV/cm) will lead to a low loading efficiency appropriate for single-molecule studies. Higher field strengths (up to 1.8 kV/cm) will increase the loading efficiency; however, there is an inverse correlation between field strength and cell viability after electroporation (see Figure 4). For reference, a normal field strength used for bacteria and yeast electroporation is ~1.5 kV/cm. The time constant, representing the length of this decay, is a convenient parameter to follow, since the time constant drops as soon as any arcing phenomenon occurs in the cuvette. Under normal settings, the time constant should be greater than 4 ms; lower values will lead to low loading efficiency or even non-loaded damaged cells. Most electroporators offer other degrees of freedom (such as “pulse truncation” or “pulse shape”) which can be modified to tune both cell loading and viability. We applied this method to both bacteria and yeast, however similar procedures should also allow the internalization of labeled biomolecules into mammalian cells using appropriate electroporator settings since their membrane is actually less complex (single lipid bilayer) and since electroporation has already been used with such cells 21.
When internalizing labeled proteins, all free dye needs to be removed from the labeled protein stock solution prior electroporation. Free dye molecules, due to their smaller size, can be internalized preferentially over the proteins of interest, and are difficult to discriminate during data analysis (despite their expected faster diffusion). As a guide, for a sample of organically labeled protein to be suitable for electroporation, the amount of remaining free dye should be below 2% (detected using fluorescent scanning of a SDS-PAGE)22. This process is particularly important, as some molecules might stick to the outer membranes of electroporated bacteria or yeast. In this respect, the negative control sample should display fluorescence intensity per cell clearly lower than electroporated cells, ideally as low as the autofluorescence level of empty cells (cells which have not been incubated with any fluorescently labeled biomolecules nor electroporated, Figure 2).
As with dsDNA, the internalization efficiency of labeled proteins is linked to the amount of biomolecules added to the cells prior to electroporation. However, other parameters, such as size and charge, play a role in internalization. Small proteins exhibit high internalization efficiencies, whereas larger proteins (up to 98 kDa) can be successfully internalized but with lower efficiency (Figure 5)26. The isolelectric point of the protein, potential interactions with the cell membrane and other physicochemical parameters also influence cell loading during electroporation. As a result, users need to optimize experiments for their own system, knowing that a high initial concentration of labeled protein (>50 μM) will give the best chance for successful loading. Electroporation also offers a new tool to perturb and analyze cellular function by introducing proteins and other biomolecules into cells (either labeled or unlabeled). The T7 RNA polymerase experiments (Figure 5C) present such an example of an experiment where we can introduce a biomolecule that can change gene expression in vivo using electroporation.
When performing single-molecule fluorescence experiments, TIR illumination is usually favored over other illumination modes as it offers the best signal-to-noise ratio by exciting only fluorophores within a thin section above the coverslip surface (~100 nm). However imaging labeled biomolecules diffusing inside living microorganisms might require deeper illumination (up to 0.8 µm for E. coli). Deeper illumination is achieved in HILO mode, while preserving a high signal-to-noise ratio. On the other hand, wide field imaging is particularly important for step-wise photobleaching analysis, where the user is estimating the number of internalized molecules by photobleaching an entire loaded cell with high laser power and dividing the initial cell fluorescence intensity by the unitary intensity produced by a single molecule (single photobleaching step, Figure 3). Widefield imaging is also required for long-term molecule tracking in order to localize the diffusing molecules of interest even if their trajectories cover the entire cell volume.
In this protocol, we present how electroporation, a standard technique for biologists and biochemists for delivering nucleic acids in cells, constitutes a simple method for delivering fluorescent biomolecules in various cell types. This novel, high-throughput technique offers a unique tool to observe labeled molecules in their native environment. In addition biomolecules labeled with fluorophores covering a wide range of wavelengths, electroporation can deliver molecules modified with many chemical groups, such as unnatural nucleotides and amino acids, metal chelators, crosslinkers, and caging groups. If the biological system of interest is not essential to the cell development, the gene encoding for the target protein can also be deleted (or knocked-down), ensuring that the proteins observed after internalization represent all (or most) of the intracellular protein pool. In essence, electroporation can “transplant” the flexibility of in vitro bioconjugates into living cells and therefore benefit efforts in synthetic biology, systems biology, and in vivo single-molecule detection.
Disclosures
The authors have nothing to disclose.
Acknowledgements
We thank Stephan Uphoff for discussions.
R.C. was supported by Linacre College, Oxford University. A.P. was supported by the German Academic Exchange Service (DAAD), the German National Academic Foundation and EPSRC. M.S. was supported by the Wellcome Trust. A.N.K. was supported by a UK BBSRC grant (BB/H01795X/1), and a European Research Council Starter grant (261227).
Materials
| Name | Company | Catalog Number | Comments |
|---|---|---|---|
| ElectroMax DH5-alpha Comptent cells | Invitrogen | 11319-019 | or any other commercial or lab-mage electrocompetant bacteria or yeast. |
| EZ Rich Defined Madia | Teknova | M2105 | low fluorescence rich media |
| MicroPulser Electroporation Apparatus | Biorad | 165-2100 | or any classical electroporator for microorganism transformation |
| Certified Molecular Biology agarose | Biorad | 161-3100 | low fluorescence agarose for agarose pad |
| Microscope coverslips No 1.5 thickness | Menzel | BB024060SC | remove background particles by heating slides in furnace at 500 °C for 1h |
| Single-molecule fluorescence microscope | Home-built | described in REFs | |
| Localization software | Custom-written, available online | MATLAB and C++ software package that can be adapted for localization analysis. | |
| Tracking software | Available online | MATLAB implementation by Blair and Dufresne. |
References
- Tsien, R. Y. The green fluorescent protein. Annu Rev Biochem. 67, 509-544 (1998).
- Leake, M. C., et al. Stoichiometry and turnover in single, functioning membrane protein complexes. Nature. 443, 355-358 (2006).
- Taniguchi, Y., Kawakami, M. Application of HaloTag protein to covalent immobilization of recombinant proteins for single molecule force spectroscopy. Langmuir. 26, 10433-10436 (2010).
- Xie, X. S., Choi, P. J., Li, G. W., Lee, N. K., Lia, G. Single-molecule approach to molecular biology in living bacterial cells. Annual review of biophysics. 37, 417-444 (2008).
- Lee, J. H., et al. Highly multiplexed subcellular RNA sequencing in situ. Science. 343, 1360-1363 (2014).
- Miesenbock, G., De Angelis, D. A., Rothman, J. E. Visualizing secretion and synaptic transmission with pH-sensitive green fluorescent proteins. Nature. 394, 192-195 (1998).
- Sauer, M. Localization microscopy coming of age: from concepts to biological impact. J Cell Sci. 126, 3505-3513 (2013).
- Dempsey, G. T., Vaughan, J. C., Hao Chen, K., Zhuang, X. Evaluation of fluorophores for optimal performance in localizationbased super-resolution imaging. Nat Meth. 8, 1027-1041 (2011).
- Shaner, N. C., Steinbach, P. A., Tsien, R. Y. A guide to choosing fluorescent proteins. Nat Meth. 2, 905-909 (2005).
- Landgraf, D., Okumus, B., Chien, P., Baker, T. A., Paulsson, J. Segregation of molecules at cell division reveals native protein localization. Nat. Methods. 9, 480-482 (2012).
- Jaitin, D. A., et al. Massively Parallel Single-Cell RNA-Seq for Marker-Free Decomposition of Tissues into Cell Types. Science. 343, 776-779 (2014).
- Aldridge, S., et al. AHT-ChIP-seq: a completely automated robotic protocol for high-throughput chromatin immunoprecipitation. Genome Biol. 14, R124(2013).
- Keppler, A., et al. A general method for the covalent labeling of fusion proteins with small molecules in vivo. Nat Biotechnol. 21, 86-89 (2003).
- Wombacher, R., et al. Live-cell super-resolution imaging with trimethoprim conjugates. Nat. Methods. 7, 717-719 (2010).
- Zhang, Z., et al. A new strategy for the site-specific modification of proteins in vivo. Biochemistry. 42, 6735-6746 (2003).
- McNeil, P. L., Murphy, R. F., Lanni, F., Taylor, D. L. A method for incorporating macromolecules into adherent cells. J Cell Biol. 98, 1556-1564 (1984).
- Clarke, M. S., McNeil, P. L. Syringe loading introduces macromolecules into living mammalian cell cytosol. J Cell Sci. 102, 533-541 (1992).
- Sakon, J. J., Weninger, K. R. Detecting the conformation of individual proteins in live cells. Nat. Methods. 7, 203-205 (2010).
- Taylor, L. S. Electromagnetic syringe. IEEE Trans. Biomed. Eng. 25, 303-304 (1978).
- Dower, W. J., Miller, J. F., Ragsdale, C. W. High efficiency transformation of E. coli by high voltage electroporation. Nucleic Acids Res. 16, 6127-6145 (1988).
- Neumann, E., Schaefer-Ridder, M., Wang, Y., Hofschneider, P. H. Gene transfer into mouse lyoma cells by electroporation in high electric fields. EMBO J. 1, 841-845 (1982).
- Sustarsic, M., et al. Optimized delivery of fluorescently labeled proteins in live bacteria using electroporation. Histochem Cell Biol. , (2014).
- Tokunaga, M., Imamoto, N., Sakata-Sogawa, K. Highly inclined thin illumination enables clear single-molecule imaging in cells. Nat. Methods. 5, 159-161 (2008).
- Sinha, A., et al. A cascade of DNA-binding proteins for sexual commitment and development in Plasmodium. Nature. 000, 1-5 (2014).
- English, B. P., et al. Single-molecule investigations of the stringent response machinery in living bacterial cells. Proc Natl Acad Sci U S A. 108, E365-E373 (2011).
- Crawford, R., et al. Long-lived intracellular single-molecule fluorescence using electroporated molecules. Biophys J. 105, 2439-2450 (2013).
- Uphoff, S., Reyes-Lamothe, R., Garza de Leon, F., Sherratt, D. J., Kapanidis, A. N. Single-molecule DNA repair in live bacteria. Proc Natl Acad Sci U S A. 110, 8063-8068 (2013).
- Uphoff, S., Sherratt, D. J., Kapanidis, A. N. Visualizing Protein-DNA Interactions in Live Bacterial Cells Using Photoactivated Single-molecule Tracking. J Vis Exp. , (2014).
- Hohlbein, J., Gryte, K., Heilemann, M., Kapanidis, A. N. Surfing on a new wave of single-molecule fluorescence methods. Phys Biol. 7, 031001(2010).
- Xie, X. S., Yu, J., Yang, W. Y. Perspective - Living cells as test tubes. Science. 312, 228-230 (2006).
- Santoso, Y., et al. Conformational transitions in DNA polymerase I revealed by single-molecule FRET. Proc Natl Acad Sci U S A. 107, 715-720 (2010).
- Hohlbein, J., et al. Conformational landscapes of DNA polymerase I and mutator derivatives establish fidelity checkpoints for nucleotide insertion. Nature communications. 4, 2131(2013).
Reprints and Permissions
