In-depth analyses of cancer cell proteomes facilitate identification of novel drug targets and diagnostic biomarkers. We describe an experimental workflow for quantitative analysis of (phospho-)proteomes in cancer cell subpopulations derived from liquid and solid tumors. This is achieved by combining cellular enrichment strategies with quantitative Super-SILAC-based mass spectrometry.
Method Article
Quantitative Mass Spectrometric Profiling of Cancer-cell Proteomes Derived From Liquid and Solid Tumors
In This Article
Summary
Abstract
In-depth analyses of cancer cell proteomes are needed to elucidate oncogenic pathomechanisms, as well as to identify potential drug targets and diagnostic biomarkers. However, methods for quantitative proteomic characterization of patient-derived tumors and in particular their cellular subpopulations are largely lacking. Here we describe an experimental set-up that allows quantitative analysis of proteomes of cancer cell subpopulations derived from either liquid or solid tumors. This is achieved by combining cellular enrichment strategies with quantitative Super-SILAC-based mass spectrometry followed by bioinformatic data analysis. To enrich specific cellular subsets, liquid tumors are first immunophenotyped by flow cytometry followed by FACS-sorting; for solid tumors, laser-capture microdissection is used to purify specific cellular subpopulations. In a second step, proteins are extracted from the purified cells and subsequently combined with a tumor-specific, SILAC-labeled spike-in standard that enables protein quantification. The resulting protein mixture is subjected to either gel electrophoresis or Filter Aided Sample Preparation (FASP) followed by tryptic digestion. Finally, tryptic peptides are analyzed using a hybrid quadrupole-orbitrap mass spectrometer, and the data obtained are processed with bioinformatic software suites including MaxQuant. By means of the workflow presented here, up to 8,000 proteins can be identified and quantified in patient-derived samples, and the resulting protein expression profiles can be compared among patients to identify diagnostic proteomic signatures or potential drug targets.
Introduction
Mass spectrometry-based proteomics has emerged and is now a widely used discipline in cell biology and translational biomedical research. Technical advances in the field have made it possible to study complex cellular processes in cell lines and animal models, as thousands of proteins can be identified in a single mass spectrometric experiment1,2. Similar progress has been made for the analysis of many posttranslational modifications such as phosphorylation or ubiquitination, although this usually requires bespoke workflows for enrichment and data analysis for each type of modification2,3. Moreover, the involvement of chemical and metabolic labeling strategies, including SILAC, enables accurate relative quantification of proteins and PTMs, making this method particularly attractive for the discovery of basic cellular processes, diagnostic biomarkers and potential drug targets in human cancer4.
However, several challenges have to be overcome with regard to proteomic analysis of primary human cancers5. First of all, human cancer samples often show a high degree of cellular heterogeneity that is due to the presence of various cell types belonging to the tumor microenvironment, including immune cells and fibroblasts. Secondly, clonal evolution leads to genetic diversity within the tumors themselves, resulting in the existence of several cellular subpopulations with distinct functional properties. According to the current concept of a few cancer stem cells being the driving forces behind cancer development and progression, proteomic analysis of such (functionally highly relevant) cellular subpopulations is expected to be of major importance for a better understanding of oncogenic mechanisms relevant for clinical application6. Thirdly, quantitative protein expression profiles of large sets of samples are often required for the identification of robust clinical biomarkers; this cannot be accomplished by chemical labeling such as iTRAQ7, while metabolic labeling strategies – relying, as they do, on cellular proliferation4– are likewise inapplicable. Fourthly, most available solid tumor samples are formalin-fixed, which complicates mass spectrometric proteome analysis due to the formation of protein crosslinks8. Finally, most existing proteomics workflows require significant amounts of sample processing and data acquisition, rendering the analysis of sample numbers relevant for clinical research difficult, and calling for new workflow paradigms9,10.
To address these obstacles we developed an experimental setup that combines either flow-cytometric cell sorting11 or laser-capture microdissection12,13 for cellular enrichment with a Super-SILAC14 strategy to introduce a global internal standard for comprehensive mass spectrometric analysis. By using the method described here, it is possible to quantify up to 8,000 proteins in single human tumor samples derived from either liquid or solid cancers.
Protocol
All experiments on human tissue or blood samples must be approved by an ethics committee and conducted according to any guidelines given in the ethics vote.
1. Cellular Enrichment
- Liquid tumors/Fluorescence-activated cell sorting.
- Isolate mononuclear cells from bone marrow or blood sample by performing erythrocyte lysis using ammonium chloride or by Ficoll density-gradient centrifugation.
- For erythrocyte lysis, combine 1 ml of sample with 4 ml of ammonium chloride solution. Incubate the solution on ice for 5 - 10 min. Add 40 ml of phosphate buffered saline (PBS) + 2% fetal calf serum (FCS) and centrifuge for 5 min at 400 x g and 4 °C.
- For Ficoll gradient centrifugation, layer 10 ml of sample on 15 ml of Ficoll-Hypaque to form 2 distinct layers (be careful not to disturb the layers). Centrifuge at 400 x g for 30 min at RT (15 - 25 °C) carefully and harvest the mononuclear cells that collect at the interphase.
- Spin down the cells and take them up in PBS + 2% FCS. Centrifuge at 400 x g for 5 min and take up in 1 ml PBS + 2% FCS. Take one aliquot as negative control and one aliquot for each fluorescent dye used in the final stain.
- Incubate with fluorescence-labeled antibodies useful to isolate the leukemic cell population in dilution according to manufacturer’s instructions on ice for 30 min. Also stain the aliquots used for compensation with each antibody individually. Wash twice with PBS + 2% FCS.
NOTE: The antibodies used were mouse anti-human against CD117-PE (Clone 95C3), CD34-FITC (Clone 8G12) and CD33-PE (Clone P67.6). - Filter cells through 35 µm cell strainer, ideally using tubes with cell strainer integrated in cap.
- Add cell viability stain (e.g., 7-AAD). Sort cells using an appropriate cell sorter11 (Figure 2). Collect cells in Iscove's Modified Dulbecco's Medium (IMDM) containing 10% FCS.
- Isolate mononuclear cells from bone marrow or blood sample by performing erythrocyte lysis using ammonium chloride or by Ficoll density-gradient centrifugation.
- Solid tumors/Laser-capture microdissection.
- For the described experiments, FFPE samples from lung cancer specimen were used. For this purpose lung cancer tissue was immediately fixed in 4% buffered formalin after surgical resection and pieces of about 3 x 2 x 1 cm where embedded in paraffin for further analysis.
- Cut sections of 5 - 10 µm thickness from the formalin-fixed paraffin-embedded (FFPE) sample with a microtome. Mount sections on film-covered membrane slides and dry at 37 °C for 1 hr. Deparaffinize and rehydrate the mounted sections by successive incubation in xylene, absolute ethanol, 70% and water, each for 1 min.
- Stain the sections with hematoxylin for 20 sec and then rinse with tap water. Collect the cell population of interest by using a laser-capture microdissection system (also see 12).
2. Protein Extraction
- Liquid tumors.
- Centrifuge the cell suspension from step 1.1.5 at 400 x g, 4 °C for 4 min and discard the supernatant. Wash twice with 500 µl of cold PBS and centrifugation for 5 min at 400 x g and 4 °C
- Add 40 µl lysis buffer per 106 cells and incubate for 15 min on ice (105 cells (approx. 10 µg total protein) should be the minimum cell number). Centrifuge the lysate at 14,000 x g, 4° C for 10 min and transfer the supernatant (cleared cellular lysate) to a new reaction tube. Discard the pellet.
- Solid tumors.
- Add 60 µl of tissue lysis buffer to the microdissected tissue and incubate for 15 min on ice, collect the fluid by short centrifugation and transfer the suspension to a new reaction tube. Sonicate the lysate on ice for 3 min.
- Add 15 µl of 20% sodium dodecyl sulfate (SDS) to a reach a final SDS concentration of 4%. Incubate the microdissected tissue at 99 °C in a heating block for 1 hr and agitated at 600 rpm. Centrifuge the lysate at 16,000 x g, 18 °C for 10 min and transfer the supernatant to a new tube.
3. Establishment of a SILAC Spike-in Quantification Standard (Super-SILAC Standard)
NOTE: The quantification standard consists of a SILAC-labeled protein mixture derived from 4 - 6 cells lines that match the tumor type of interest. To achieve the maximum overlap between the SILAC-labeled reference proteome and the tumor-derived proteome, a principal component analysis needs to be performed before cell lines are selected for the quantification standard14.
- Principal component analysis (PCA).
- To determine the protein expression patterns of cell lines, cultivate about ten different cell lines in appropriate cell culture media. Lyse the cells as described in step 2.1. Prepare cellular lysates for mass spectrometry as described in step 6.1.
- Analyze the protein expression pattern of each cell line on a high-resolution, liquid chromatography-coupled mass spectrometer (nanoLC-MS/MS).
- Analyze the resulting raw data using a free ware MaxQuant and perform a principal-component analysis using the associated software such as Perseus16,17.
- Select 4 - 6 cell lines that show the greatest diversity between their protein-expression profiles and use them to generate the Super-SILAC spike-in standard.
- SILAC-labeling and label check.
- Cultivate the selected cell lines for at least five cell cycles in appropriate SILAC cell culture medium, in which arginine and lysine are labeled with stable isotopes of carbon and nitrogen (SILAC medium)4.
- Lyse the cells as described in step 3.1 and prepare cellular lysates for mass spectrometry as described in step 6.1. Measure the incorporation efficiency of SILAC labeling by nanoLC-MS/MS. Analyze the resulting raw MS data with MaxQuant and determine the efficiency of SILAC-labeling. This is achieved by counting the numbers of peptides identified in their labeled (heavy) and their endogenous forms (light), and calculating the ratio (heavy)/(heavy+light). Labeling efficiency should exceed 98%.
- Combination of SILAC proteomes and validation.
- Cultivate and expand selected cell lines according to manufactures instructions in appropriate SILAC medium. Lyse the cells as described in step 2.1 for liquid tumors or as described in step 3.2 for solid tumors and determine protein concentration for each cellular lysate.
- Mix equimolar protein amounts of each cell line and divide the mixture into aliquot. Snap-freeze the aliquots and store at -80°C until measurement. For one experiment you need 20 - 50 µg of Super-SILAC standard. Take care to prepare the standard in excess as changing the standard within a series of experiments should be avoided.
4. Measurement of Protein Concentration and Spike-in
- Liquid tumors.
- Using protein quantitation assay determine the protein concentrations of the respective cellular lysates and the Super-SILAC standard.
- Mix equal amounts of cleared cellular lysate and the Super-SILAC standard and subsequently add lithium dodecyl sulfate (LDS) buffer (25% of the sample volume) and reducing agent (10% of the sample volume).
- Heat the resulting solution in a heating block at 72 °C for 10 min. Optionally, store the resulting denatured proteins at -80°C.
- Solid tumors.
- For protein concentration measurement on a plate reader, mix a standard bovine serum albumin (BSA) dilution solution series, the lysate and the appropriate Super-SILAC standard with an commercially available protein assay in a 96-well plate, and shake for 1 min, incubate for indicated time and measure absorbance as indicated by the manufacturer.
NOTE: The high concentration of SDS and dithiothreitol (DTT) in the lysate is a problem for most available assays for protein concentration determination. - Mix equal amounts of clarified lysate and the Super-SILAC standard with 200 μl of urea in the filter unit and centrifuge at 14,000 x g for 30 min at 20 °C. Do not use more than 50 µl of clarified lysate and the Super-SILAC standard. Avoid temperatures below 15 °C, so that urea does not crystallize out.
- For protein concentration measurement on a plate reader, mix a standard bovine serum albumin (BSA) dilution solution series, the lysate and the appropriate Super-SILAC standard with an commercially available protein assay in a 96-well plate, and shake for 1 min, incubate for indicated time and measure absorbance as indicated by the manufacturer.
5. Sample Separation and Protein Digest
- Liquid tumors.
- Separate 30 - 100 µg total protein per lane on a 4 - 12% gradient SDS-PAGE Gel. Stain proteins with Coomassie Blue O/N. Remove excess Coomassie stain by two subsequent washes with water.
- Cut each lane from the gel and divide it into 23 equal-sized slices irrespective of the pattern of gel staining. Process the gel slices separately, each in a in 0.6 ml polypropylene vial.
- Wash the gel slices with water and methanol/water (50:50, v/v), reduce with 10 mM DTT by incubating for 30 min at 56 °C. Alkylate the gel slices with 55 mM iodoacetamide (IAA) by incubating at 60 min at RT in dark.
- Between sample-handling steps, wash slices with acetonitrile for 15 min and dry in a SpeedVac to remove excess solvent and improve uptake of reagent solution.
- Perform protease cleavage by rehydrating dried gel slices with the minimum amount of porcine trypsin solution (12.5 ng/µl in 0.025 M aqueous ammonium bicarbonate) for 16 hr at 37°C.
- Add 10 µl water to gel slice and incubate for 15 min at 37 °C. Add 80 µl acetonitrile and incubate for 15 min at 37 °C. Centrifuge at 15,800 x g, for 1 min. Collect supernatant and store in a separate 0.6 ml tube.
- Add 65 µl of 5% formic acid solution, vortex and incubate for 15 min at 37 °C. Add 65 µl acetonitrile and incubate for 15 min at 37 °C. Centrifuge at 15,800 x g for 1 min. Collect the supernatant and add it to the supernatant from the previous step. Evaporate the combined supernatant to dryness in a vacuum concentrator.
- Solid tumors.
- To remove SDS from tissue lysate use the following FASP protocol, also described as in reference15.
- After the first centrifugation described in step 5.2.3 add a further 200 μl of 8 M urea on the filter, and further centrifuge at 14,000 x g for 20 min at 20 °C. Discard the flow-through filtrate.
- Add 100 μl IAA and mix in a thermomixer at 600 rpm for 1 min. Incubate the filter for 20 min at 20 °C in the dark. Centrifuge the filter at 14,000 x g for 10 min at 20 °C.
- Add 100 μl of urea to the filter and centrifuge at 14,000 x g, for 15 min at 20 °C. Repeat this step one more time.
- Add 100 μl of NH4HCO3 to the filter and centrifuge at 14,000 x g for 10 min at 20 °C. Repeat this step twice.
- Add 40 μl NH4HCO3 + 1 µl (= 0.4 µg) trypsin and mix in thermomixer at 20 °C for 600 rpm, 1 min. Incubate the filter O/N in a wet chamber at 37 °C. Transfer the filter to new collection tubes.
- Centrifuge the filter at 14,000 x g for 10 min at 20 °C. Add 50 μl of NH4HCO3 and centrifuge the filter at 14,000 g for 10 min at 20°C. Store the resulting peptides at -20°C until mass spectrometric measurement.
- For peptide concentration measurement, dispense 50 µl of the resulting flow-through and a series of appropriate dilutions of neat tryptophan into a 96-well plate. Measure tryptophan fluorescence. Convert the resulting concentration of tryptophan to peptide concentration, as 0.1 μg of tryptophan corresponds to 9 μg protein.
6. Liquid Chromatography and Mass Spectrometric Analysis
- Redissolve peptides in 30 µl loading buffer for 5 min in a sonication bath. Spin down in a centrifuge at 15,800 x g for 1 min and pipette the clear solution into an MS autosampler vial.
- Inject 5 µl of sample per analysis using the autosampler of the nanoLC-MS/MS system. Concentrate and desalt peptides online on a reversed phase C18 pre-column (0.15 mm ID x 20 mm with 5 µm pore size C18 material) mounted in either a vented column setup or a precolumn switching setup.
- Separate peptides on a reversed phase C18 microcolumn (0.075 mm ID x 200 mm self-packed with 3 μm or smaller pore size C18 material in a self-pack nanospray column such as PicoFrit, using a 90 min gradient of 5>35% acetonitrile vs. 0.1% aqueous formic acid at 300 nl/min. Transfer eluent into a hybrid quadrupole/orbitrap mass spectrometer via a nanospray ion source.
- Analyze peptides using a Top15 data dependent acquisition method (MS m/z range 350 - 1600, resolution target 70.000 FWHM, AGC target 1 x 10⁶, max fill time 60 msec. MS/MS start mass 100, resolution target 17.500 FWHM, AGC target 2 x 10⁵, max fill time 60 msec. MS/MS threshold 3 x 10⁴, include charge states 2 - 5, Normalized Collision Energy NCE 25%, dynamic exclusion 15 sec).
7. Data Analysis
- For data analysis use the freely available MaxQuant16 software. A detailed protocol for bioinformatic data analysis is described in16,17. For analysis, combine raw data files from all slices from an SDS-PAGE lane into a single experiment17.
Results
Proteomic profiling of liquid and solid tumors from patients is a promising approach for the discovery of new diagnostic and predictive biomarkers. However, the sample preparation procedure and the mass spectrometric analysis are challenging, owing to the complexity of the samples and the need for accurate protein quantification in large sets of samples. The experimental procedure described above starts with the isolation of cells of interest, either by fluorescence-activated cell sorting or by laser-capture microdissection.
For this purpose, cells from patient-derived bone marrow aspirates or blood samples are stained with fluorescence-labeled antibodies against defined surface markers of interest before FACS-based sorting and cell lysis.
To enrich cellular subsets from tissue sections, these first have to be mounted on appropriate slides to allow for laser-capture microdissection. For this purpose mount the tissue sections on appropriate membrane slides and use a laser-capture microdissector according to manufacturer’s instructions. Selecting the areas and cells of interest requires appropriate knowledge about the histomorphology of healthy and neoplastic tissue. The extracted cells are then transferred into an appropriate collection tube. Initial experiments should be performed in order to define the amount of tissue necessary for extraction of sufficient amounts of protein (minimum 10 µg total protein) for every new tissue of interest. Each microdissected sample is treated with 60 µl of tissue lysis buffer. For efficient lysis, cells from tissue samples have to be sonicated for 3 min and after the addition of 15 µl of SDS samples are incubated in a thermomixer at 99 °C for 1 hr to remove formalin-induced protein crosslinks. Centrifugation will finally facilitate the collection of the cleared cellular lysate.
For every disease of interest (liquid and solid tumors) a suitable Super-SILAC quantification standard has to be established14. An appropriate standard should represent more than 90% of the proteins expressed in the samples of interest. For preparation of a quantification standard, cell lines related to the cancer type of interest should first be analyzed by mass spectrometry to determine their protein expression profiles and subsequently principal component analysis should be performed. 4 - 6 different cell lines with differential protein expression patterns should be chosen and SILAC-labeled with “heavy” arginine and lysine. Labeling efficiency should be checked by nanoLC-MS/MS and should be greater than 98%. Afterwards, cell lines should be lysed in the same way as the respective patient-derived sample and, subsequently, equimolar protein amounts of each sample and the SILAC spike-in standard should be mixed. A critical step for accurate protein quantification of clinical samples of interest is the accurate mixture of equimolar protein amounts of the patient-derived samples and the SILAC spike-in quantification standard. To determine the protein concentration of lysates derived from sorted cells, various protein quantification assays can be used. For cellular lysates from tissue-derived cells an assay is needed that can deal with high concentrations of SDS and DTT in the lysate. Protein concentrations of the patient-derived samples and the SILAC spike-in standard should be measured each time prior to combination with the respective clinical samples in order to ensure correct mixture, which is crucial in making even hundreds of samples comparable.
After the mixture of equal amounts of spike-in standard and lysate, samples obtained from liquid tumors are mixed with LDS, heated in a thermomixer at 72 °C for 10 min and subsequently subjected to 1D-PAGE and in-gel digestion of the separated proteins with trypsin. Samples obtained from tissue are freed from SDS and digested with trypsin by using the FASP approach as established by Wisniewski et al.15
The tryptic peptides obtained can be quantified by measuring tryptophan fluorescence, which is of special interest for tissue samples as the amount of peptides released from the filter differs between 15% and 75% compared to the protein amounts initially loaded onto the filter. For this purpose we measure the fluorescence of tryptophan. Comparison with an appropriate tryptophan dilution series allows for the quantification of peptides, as 1.1 µg of tryptophan corresponds to approximately 100 µg of peptide. If necessary, samples derived especially from FASP processing can be pre-purified on either commercial or home-made stage tips packed with reversed phase-C18 (RP-C18) material before loading onto the nanoLC/MS/MS system18.
Mass-spectrometric analysis is performed on a high-resolution, high-sensitivity mass-spectrometry system. In short, peptide samples are desalted and preconcentrated on an RP-C18 precolumn, and separated on an RP-C18 analytical column coupled directly to the mass spectrometer. To achieve sufficient depth of analysis, we employ either a combination of SDS-PAGE protein prefractionation with 40 min RP-C18 gradients (for liquid tumors) or single injections with long 2 - 3 hr RP-C18 gradients (for solid tumors processed by FASP). MS spectra are acquired at a resolution of 70,000 FWHM or better, to allow accurate quantification of SILAC pairs by integration of chromatographic peak profiles. For protein identification, a Top15 data-dependent acquisition method is used to generate a large number of peptide MS/MS spectra for peptide and protein identification.
From the resulting raw data, protein identification and quantification are achieved by database searching with MaxQuant software against a UniProt Knowledgebase Human Complete Proteome sequence database17. In MaxQuant software (current version 1.5.0.25) peptides are identified from the acquired MS/MS spectra by peptide fragment-matching against spectra derived in silico from the protein sequence database. At the same time, precursor ion isotopic profiles are extracted around their chromatographic retention times, and their integrated peak areas are used for relative quantification of the light:heavy peptide pairs generated by SILAC labeling. Peptide identities and relative intensities are then assigned to the corresponding protein properties. Perseus software (current version 1.5.0.15) is then used to perform further downstream statistical evaluation of the MaxQuant processing results, including sample-to-sample comparisons, PCA and hierarchical clustering.
Using the experimental setup described we have identified and quantified up to 8,000 proteins from as little as 30 µg of total protein derived from liquid tumors.
Up to 2,500 proteins from solid-tumor samples can be identified and quantified in a shotgun proteomic approach with an LC gradient of only 2 hr, allowing the analysis of hundreds of clinical samples in a relatively short time.

Figure 1. Experimental workflow. The main steps of cellular-subset enrichment, protein isolation, spike-in of the quantification standard and mass-spectrometric analysis are shown for liquid and solid tumors. Please click here to view a larger version of this figure.
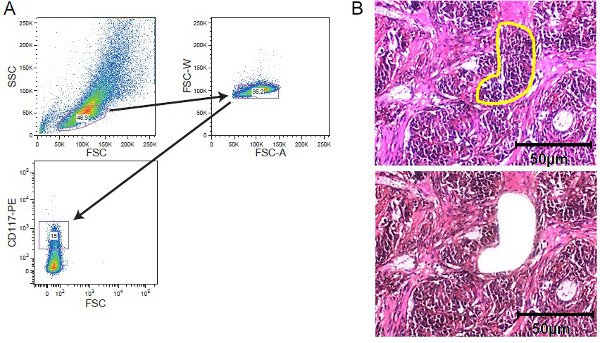
Figure 2. Cellular enrichment strategies. FACS sorting and LCM. (A) Exemplary gating strategy depicting gating on a CD117-stained leukemic cell population acquired by a cell sorter. (B) Laser capture microdissection of solid tumor tissue. Tissue sections of 5 - 10 µm thickness were mounted on film-covered membrane slides before staining. Region of interests was selected manually for laser capture microdissection. Shown are sections before microdissection with the region of interest marked yellow and after microdissection. A scale bar of 50 µm is included in the figure. Please click here to view a larger version of this figure.
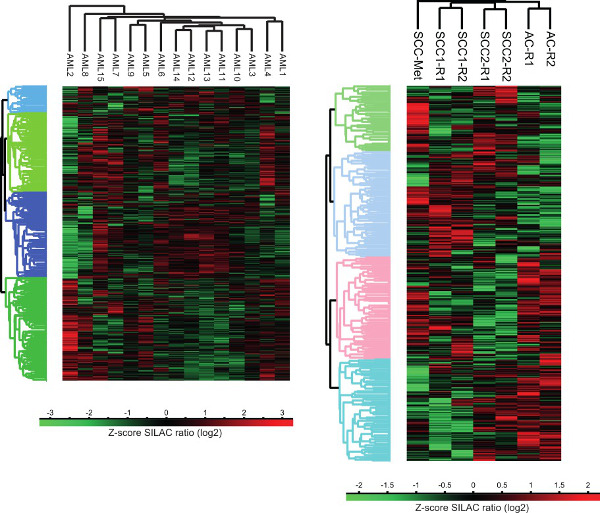
Figure 3. Cluster analysis of human cancer-cell proteomes. Unsupervised cluster analysis of protein expression profiles of liquid and solid tumors was performed using the computational platform Perseus. AC – Adenocarcinoma, SCC – Squamous cell carcinoma, SCC-Met – Squamous cell carcinoma metastases from head and neck cancer, R – technical replicate.
Discussion
Mass spectrometric profiling of patient-derived cancer-cell proteomes is needed for the discovery of new diagnostic/predictive biomarkers as well as to give a better understanding of cancer-cell biology, which might in turn lead to the identification of new potential drug targets. However, such mass spectrometric analyses are highly challenging, in particular because various pre-analytical issues have to be solved, if one is to obtain robust and biologically relevant results.
The experimental workflow described here allows for quantitative proteomic characterization of proteomes derived from cellular subpopulations of both liquid and solid tumors. The initial enrichment of tumor cells by either FACS-based cell-sortingor microdissection is needed to avoid contamination by cells of the tumor microenvironment. Furthermore, these techniques allow one to isolate cellular subpopulations of interest. Recent cell-biological studies have demonstrated that certain cellular subpopulations have tumor-initiating properties and are thus highly relevant for cancer pathogenesis19,20. As mass spectrometry has become more sensitive in recent years, quantitative proteomic analyses are feasible for the small amounts of protein that can be derived from a few thousand cells, making it possible to focus on functionally relevant cell populations.
The set-up presented here can be used to identify and validate novel diagnostic biomarkers in FFPE samples. Hence, it promises to bea useful tool for the improvement of clinical diagnostics, as to date there is still a lack of molecular biomarkers in adequate number and quality for many cancer types. Important examples of difficult differential diagnoses, for which biomarkers are lacking, are the discrimination between primary lung cancer from metastases in the lung, intrapancreatic cholangiocellular carcinoma and pancreatic adenocarcinoma, as well as differentiation of benign neurofibroma from highly malignant peripheral nerve-sheath tumors. Moreover, we and others have shown that quantitative elucidation of proteomic signatures can be useful in studying cancer cell biology in general, and for revealing predictive biomarkers of therapeutic response in cancer patients21.
Two current drawbacks of the method presented here are the requirement for extensive manual sample processing and the demand on nanoLC-MS/MS acquisition time. While the former can be addressed by moving sample preparation to e.g., 96-well formats and using robotic processing, the latter will require a change in mass spectrometric acquisition strategy. Once subsets of target proteins have been identified that can be associated with e.g., tumor classification, we envisage the design of targeted mass spectrometry methods that provide quantitative readouts for these subsets with a greatly reduced separation effort, and therefore with a correspondingly reduced acquisition time. If the required acquisition time required could be reduced from 24 - 36 hr (liquid tumors) or 3 hr (solid tumors) to e.g., 1 hr using targeted mass spectrometry and a simple one-dimensional separation of peptides, then the resulting gain in throughput could be used to increase significantly the numbers of biological and technical replicates examined, with corresponding improvements in the significance of quantification results. Targeted mass spectrometric approaches have already been demonstrated to be a suitable tool for the verification of cancer-associated protein biomarker-candidates22, and have been developed to a point where they show promise for validation or even as a potential tool for routine clinical use23,24.
Disclosures
The authors have no conflict of interest or other issues to disclose.
Acknowledgements
The authors thank Uwe Plessmann, Monika Raabe und Silvia Münch for technical support.
Materials
| Name | Company | Catalog Number | Comments |
|---|---|---|---|
| 660 nm Kit | Thermo scientific | 22662 | |
| Cell culture medium depleted of arginine and lysine | Thermo Scientific | 88421 | |
| Coomassie Brilliant Blue R-250 staining solution | Bio Rad | 161-0436 | |
| Dialyzed fetal calf serum (FCS) | PAA | A15-107 | |
| Diffuser caps for microdissection | MMI | 50202 | |
| FACS-sorter | BD | FACSAria III | |
| Ionic Detergent Compatibility Reagent | Thermo scientific | 22663 | |
| Laser-capture microdissector | MMI | cell cut plus | |
| LDS buffer | Life Technologies | NP0009 | |
| Membrane slides for microdissection | MMI | 50103 | |
| Microcon YM-30 | Millipore | MRCF0R030 | |
| NuPAGE 4-12% Bis-Tris Mini Gels | Life Technologies | NP0335PK2 | |
| Picofrit Self-Pack Columns | New Objective | PF360-75-15-N-5 | Mass Spectrometry Column/Emitter |
| Reducing agent | Life Technologies | NP0007 | |
| Reprosil-Pur LC/MS/MS Column stationary phase | Dr. Maisch | 120 C18-AQ, 3 µm | |
| Reprosil-Pur LC/MS/MS Precolumn stationary phase | Dr. Maisch | 120 C18-AQ, 5 µm | |
| SILAC-labeled arginine | Eurisotop | CLM-2265-H-0.1 | |
| SILAC-labeled lysine | Eurisotop | DLM-2640-0.25 | |
| Trypsin, NB Sequencing Grade | Serva | 3728301 | for in-gel digests |
| Trypsin, Sequencing Grade | Promega | V5111 | for in-solution digests |
| Buffer and solutions | |||
| Cell lysis buffer: 150 mM NaCl, 50 mM Tris/HCl pH 7.8, 5 mM NaF, 0.5% NP40, 0.1% laurylmaltoside, Roche complete protease inhibitor, 1 mM Na3VO4 | |||
| Tissue lysis buffer: 100 mM Tris/HCl pH 7.8, 0.1 M DTT | |||
| Urea: 8 M urea in 0.1 M Tris-HCl, pH 8.5 | for FASP-protocoll | ||
| IAA: 0.05 M iodoacetamide, 8 M urea, 0.1 M Tris-HCl, pH 8.5 | for FASP-protocoll | ||
| 0.05 M NH4HCO3 | |||
| 10 mM dithiothreitol (DTT) in 0.1 M ammonium bicarbonate | for in-gel digest | ||
| 55 mM iodoacetamide (IAA) in 0.1 mM ammonium bicarbonate | for in-gel digest | ||
| 5% aqueous formic acid. |
References
- Walther, T. C., Mann, M. Mass spectrometry-based proteomics in cell biology. J Cell Biol. 190 (4), 491-500 (2010).
- Lenz, C., Urlaub, H. Separation methodology to improve proteome coverage depth. Expert Rev Proteomics. 11 (4), 409-414 (2014).
- Olsen, J. V., Mann, M. Status of large-scale analysis of post-translational modifications by mass spectrometry. Mol Cell Proteomics. 12 (12), 3444-3452 (2013).
- Ong, S. E., et al. Stable isotope labeling by amino acids in cell culture, SILAC, as a simple and accurate approach to expression proteomics. Mol Cell Proteomics. 1 (5), 376-386 (2002).
- Jimenez, C. R., Verheul, H. M. Mass spectrometry-based proteomics: from cancer biology to protein biomarkers, drug targets, and clinical applications. Am Soc Clin Oncol Educ Book. , e504-e510 (2014).
- Tang, D. G. Understanding cancer stem cell heterogeneity and plasticity. Cell Res. 22 (3), 457-472 (2012).
- Evans, C., et al. An insight into iTRAQ: where do we stand now. Anal Bioanal Chem. 404 (4), 1011-1027 (2012).
- Ostasiewicz, P., Zielinska, D. F., Mann, M., Wisniewski, J. R. Proteome, phosphoproteome, and N-glycoproteome are quantitatively preserved in formalin-fixed paraffin-embedded tissue and analyzable by high-resolution mass spectrometry. J Proteome Res. 9 (7), 3688-3700 (2010).
- Malmström, J., Picotti, P., Aebersold, R. Perspectives of targeted mass spectrometry for protein biomarker verification. Curr Opin Chem Biol. 13 (5-6), 518-525 (2009).
- Gillet, L. C., et al. Targeted data extraction of the MS/MS spectra generated by data-independent acquisition: a new concept for consistent and accurate proteome analysis. Mol Cell Proteomics. 11 (6), (2012).
- Basu, S., Campbell, H. M., Dittel, B. N., Ray, A. Purification of specific cell population by fluorescence activated cell sorting (FACS). J Vis Exp. 41, (2010).
- Edwards, R. A. Laser capture microdissection of mammalian tissue. J Vis Exp. 8, 309(2007).
- Liu, N. Q., et al. Proteomics pipeline for biomarker discovery of laser capture microdissected breast cancer tissue. J Mammary Gland Biol Neoplasia. 17 (2), 155-164 (2012).
- Geiger, T., et al. Use of stable isotope labeling by amino acids in cell culture as a spike-in standard in quantitative proteomics. Nat Protoc. 6 (2), 147-157 (2011).
- Wisniewski, J. R. Proteomic sample preparation from formalin fixed and paraffin embedded tissue. J Vis Exp. (79), (2013).
- Cox, J., Mann, M. MaxQuant enables high peptide identification rates, individualized p.p.b.-range mass accuracies and proteome-wide protein quantification. Nat Biotechnol. 26 (12), 1367-1372 (2008).
- Cox, J., et al. A practical guide to the MaxQuant computational platform for SILAC-based quantitative proteomics. Nat Protoc. 4 (5), 698-705 (2009).
- Rappsilber, J., Mann, M., Ishihama, Y. Protocol for micro-purification, enrichment, pre-fractionation and storage of peptides for proteomics using StageTips. Nat Protoc. 2 (8), 1896-1906 (2007).
- Sarvi, S., et al. CD133+ cancer stem-like cells in small cell lung cancer are highly tumorigenic and chemoresistant but sensitive to a novel neuropeptide antagonist. Cancer Res. 74 (5), 1554-1565 (2014).
- Shlush, L. I., et al. Identification of pre-leukaemic haematopoietic stem cells in acute leukaemia. Nature. 506 (7488), 328-333 (2014).
- Schaab, C., et al. Global phosphoproteome analysis of human bone marrow reveals predictive phosphorylation markers for the treatment of acute myeloid leukemia with quizartinib. Leukemia. 28 (3), 716-719 (2014).
- Hüttenhain, R., et al. Reproducible quantification of cancer-associated proteins in body fluids using targeted proteomics. Sci Transl Med. 4 (142), 142ra94(2012).
- Burgess, M. W., et al. Simplified and efficient quantification of low-abundance proteins at very high multiplex via targeted mass spectrometry. Mol Cell Proteomics. 13 (4), 1137-1149 (2014).
- Boja, E. S., et al. Analytical Validation Considerations of Multiplex Mass Spectrometry-based Proteomic Platforms for Measuring Protein Biomarkers. J Proteome Res. , (2014).
Reprints and Permissions
