Using the Electroretinogram to Assess Function in the Rodent Retina and the Protective Effects of Remote Limb Ischemic Preconditioning
Summary
The electroretinogram (ERG) is an electrical potential generated by the retina in response to light. This paper describes how to use the ERG to assess retinal function, in dark-adapted rats, and how it can be can be used to assess a neuroprotective intervention, in the present case remote ischemic preconditioning.
Abstract
The ERG is the sum of all retinal activity. The ERG is usually recorded from the cornea, which acts as an antenna that collects and sums signals from the retina. The ERG is a sensitive measure of changes in retinal function that are pan-retinal, but is less effective for detecting damage confined to a small area of retina. In the present work we describe how to record the ‘flash’ ERG, which is the potential generated when the retina is exposed to a brief light flash. We describe methods of anaesthesia, mydriasis and corneal management during recording; how to keep the retina dark adapted; electrode materials and placement; the range and calibration of stimulus energy; recording parameters and the extraction of data. We also describe a method of inducing ischemia in one limb, and how to use the ERG to assess the effects of this remote-from-the-retina ischemia on retinal function after light damage. A two-flash protocol is described which allows isolation of the cone-driven component of the dark-adapted ERG, and thereby the separation of the rod and cone components. Because it can be recorded with techniques that are minimally invasive, the ERG has been widely used in studies of the physiology, pharmacology and toxicology of the retina. We describe one example of this usefulness, in which the ERG is used to assess the function of the light-damaged retina, with and without a neuroprotective intervention; preconditioning by remote ischemia.
Introduction
The ERG is an electrical potential generated by the retina in response to light, and recorded from the corneal surface of the eye. When conditions of recording are managed carefully, the ERG can be used in a variety of ways to assess retinal function. Here we described how to record the ‘flash ERG’, the potential generated when the retina is exposed to a brief, bright flash presented in a Ganzfeld background. The Ganzfeld disperses the light homogenously and the flash of light reaches the whole retina approximately uniformly. If the retina is dark adapted before recording, and the dark-adaptation is maintained as the animal is prepared for recording, the ERG obtained is generated by both rod and cone photoreceptors.
The dark-adapted flash ERG has a characteristic waveform, which has been analysed in two ways. First, early and late components of the ERG waveform have been distinguished, and related to the sequence of neuronal activation in the retina. The earliest component is a short-latency negative-going potential, the a-wave (Figure 1). This is followed by a positive-going potential, called the b-wave. The rising phase of the b-wave shows oscillations, which are considered a separate component (oscillatory potentials or OPs). The a-wave is considered to be generated by photoreceptors, the b-wave by cells of the inner nuclear layer, and the OPs by amacrine cells1.
Based on the stimulus strength, responses to very dim flashes termed the scotopic threshold response are possible. The scotopic threshold response is understood to be generated from the retinal ganglion cells2-4. Second, the flash ERG can be separated by light adaptation, or by a two flash protocol described below, into rod- and cone-driven components. Under photopic conditions, the a-wave is not detectable in rats, because the cone population is low, but OPs and a b-wave are clear5. In primates, whose retinas have higher cone populations, both rod- and cone- pathways generate a detectable a-wave6.
Two useful measures often extracted from the flash ERG are the amplitudes of the a- and b-waves, measured as in Figure 1, with typical flash responses shown in Figure 2. When the photoreceptor population is reduced, for example by exposure to damagingly bright light, all components of the ERG are reduced. Neuroprotective interventions, such as remote ischemic preconditioning (RIP), can be validated by the preservation of the amplitudes of the a- and b-waves (Figure 3). In summary, the analysis of the ERG enables comparisons between healthy, light damaged and neuroprotected retina.
Protocol
This protocol follows the animal care guidelines of University of Sydney.
1. Making Electrodes
- Construct the positive electrode (the one which will contact the cornea) from a short (5 cm) length of platinum wire 1-2 mm in diameter. Fashion it into a loop a few mm in diameter. Connect this loop to a conventional lead, long enough to reach the input stage of your amplifier (see Figure 4).
- Construct the negative electrode (which will go in the animal’s mouth) using an Ag/AgCl pellet 1-2 mm in diameter, also connected to a convention lead (see Figure 4).
- As a reference electrode (which will go into the animal’s rump), use a clean hypodermic needle (23 G), also connected to a lead of appropriate length (see Figure 4).
- Ideally, use three-lead cables provided by instrument manufacturers, to connect the three electrodes (positive → cornea, negative → mouth, reference → rump) to the amplifier.
2. Connection and Calibration of Light Stimulus and ERG Set-up
- Create (or locate) a small recording laboratory, which can be made dark. Equip with either or both of an over-the-bench light made red or a red head-lamp.
- Use a lux meter to confirm that red light illuminance reaching the rat’s eye during setup does not exceed 1 lux.
Note: A neutral density filter can be used to reduce lamp brightness and the source of lamp light must specifically emit red light. Dark adaption will be compromised if light sources emit lower (visible) wavelengths. - Seal off all stray light entering the recording laboratory (this often requires persistence with opaque tape) and prepare a neutral density filter (this can be purchased in sheets) large enough to fit over, and so dim, any computer screen you will have in the lab.
Note: Stray light and the light of a screen are sufficient to prejudice dark adaptation of the rat eye. - Connect the amplifier to data acquisition hardware. Connect positive, negative and reference leads to the amplifier. Make sure the computer and the LED Ganzfeld power supply unit are securely connected to a ground source.
Note: Some labs have specialised grounding points, connected to a building ground; a water pipe is an effective alternative. - Calibrate the LED light source with a research-quality radiometer. Fix the meter’s sensor in the position at which the animal’s eye will be located during an experiment.
- Program the Ganzfeld LEDs to run a full-field ERG protocol with step-wise increases in flash energy, flash duration, flash repetition and time between flashes, termed interstimuls interval (ISI), settings. For an example full-field protocol see Table 1.
Note: The full-field ERG flashes increase from repetitive dim flashes to bright flashes in a step wise fashion. The twin flash program follows on from the full-field protocol and enables isolation of rod and cone responses.
3. Day Prior to ERG Experimentation
- Dark adapt Sprague-Dawley rats for 12 hr before recording. It is convenient to do this in the recording laboratory, once stray light has been eliminated.
4. Day of ERG Experimentation
- Arrange for the animal to be gently heated while recording. We use a light metal platform built so that the animal’s head can rest at the correct point at the entry to the Ganzfeld. The platform has inbuilt tubing through which we pump water preheated to 40 °C in a water bath.
Note: Experience shows that this keeps the animal’s core temperature at 37 °C. - Weigh the rat under dark conditions. Record weight and make up correct ketamine (60 mg/kg) and xylazine (5 mg/kg) dose. Restrain the rat gently and inject anaesthetic intraperitoneally.
- Note time of injection. Once the animal is unconscious (usually within 5 min) check depth of anaesthesia by lightly pinching one foot pad, to see if a reflex response is present. It is best to wait until this reflex is absent or weak, before proceeding.
- Apply a single drop of atropine and another of proxmethacaine to cornea.
- Cut a 10 cm length of black thread. Make a loop with a simple knot and slip the loop over the equator of the eye. Tighten it slightly; the effect is to draw the eyeball slightly forward, with minimal pressure. This keeps the cornea clear from the eyelids.
- Apply carbomer eye drops to the cornea surface. Ensure carbomer remains on corneal surface and does not spill onto the eyelids or the face.
- Place absorbent bedding on top of heated platform.
- Position rat on the bedding, with the head in the recommended place in the opening of the Ganzfeld.
- Insert internal temperature probe into the rectum. Secure temperature probe in position by taping probe cord to the tail.
- Insert the reference electrode (the 23 G needle) subcutaneously into the rear leg, and connect to amplifier.
- Place the negative electrode (the Ag/AgCl pellet) securely in the mouth. To prevent this slipping out the mouth, affix the connecting lead to a stable surface.
- Position the positive electrode over the centre of the cornea. Using a micromanipulator, ensure that the electrode touches the cornea gently.
- Check body temperature is at 37.0 – 37.5 °C.
- Once the animal is properly positioned and electrodes are in place, drape the whole setup (Ganzfeld and animal) with an opaque material (to preserve dark adaptation). We use a soft black cloth.
- In the acquisition software set at a 2 KHz sampling rate with a collection time of 100-1000 msec with 5 msec of pre-collection sampling. Set the band pass filters to 1-1,000 Hz and ensure that sampling is triggered to sample the period of ~250 msec following a flash.
- Check the recording baseline. It should be free of extraneous noise, but show some amplifier noise and a respiratory oscillation.
- If the baseline shows extraneous noise, begin troubleshooting. Most problems are related to slippage in electrode position, or grounding. Use a faraday cage to ensure recordings are free of extraneous noise.
- Run a test flash, 0.4 log scot cd.s.m-2. An ERG waveform similar to Figure 2A should appear. In our laboratory typical responses for a 0.4 log scot cd.s.m-2 flash are (a-wave: -474 ± 39 µV and b-wave: 1,512 ± 160 µV, n = 11).
- Allow animal to dark re-adapt for 10 min. It is convenient to use these 10 min to recheck the baseline.
- Following confirmation of stable signal begin recording.
- At the end of the recording session, check that body temperature was maintained. Remove electrodes. Reapply carbomer polymer to corneas. Allow the animal to recover on a heat pad until it is fully mobile and active, before returning to animal housing.
5. Remote Ischemia
- Perform remote ischemia in either awake or anesthetised rodents.
- If the animal is anaesthetised, lay it on a heated platform (above) and slip the sphygmomanometer cuff over the upper part of the hind-limb, clear of the knee.
- If the animals are used to being handled, it is possible to perform this procedure without anaesthesia; this requires two people. One person restrains the animal gently and the second applies the sphygmomanometer cuff and operates the sphygmomanometer.
- For awake animals, use a piece of towel ~15 cm x 30-50 cm to gently wrap the animal, with one hindlimb free. Lay the animal on its back on (say) the left forearm, with its head tucked between the holder’s arm and torso, and place the cuff as just described.
- Deflate the cuff and ensure the air pressure valve is closed. Pump the cuff to 160 mmHg in anesthetised animals, and to 180 mmHg in awake animals. This exceeds systolic pressure (usually 140 mmHg and 160 mmHg respectively).
- Maintain these pressures as required, using the hand-held pump.
- After the planned time for ischemia (we use 2 periods of 5 min separated by 5 min reperfusion), deflate the cuff pressure by loosening the air pressure valve.
- Confirm the effect of remote ischemia with a skin temperature probe attached to the footpad. Skin temperature typically falls from 32-30 °C, over 5 min and recovers on reperfusion.
6. Light Damage
- Ensure that rats are in a dark-adapted overnight, before the light damage procedure.
- At the appropriate time following limb ischemia (in our experiments without delay), each animal is placed singly into a plexiglass boxes, with water and food in floor-based containers.
Note: Light-induced damage can only be undertaken in albino animals. - Switch on a pre-calibrated 1,000 lux white light at a standard time (usually 9 am) and maintain this condition for 24 hr.
7. ERG Data Extraction and Analysis
- Acquire averaged wave forms of the ERG. If required, correct for a non-zero baseline, by subtraction.
- Measure the amplitude of the a-wave (presented at mid- to high stimulus intensities), as the voltage difference between the baseline and the first (<30 msec latency) trough (Figure 1).
- Measure the b-wave amplitude as the voltage difference between the peak of the a-wave and the positive of the following wave, typically occurring at a latency of 80-100 msec (Figure 1).
- Isolate oscillatory potentials by using a Fourier transform to filter data from 60-235 Hz, with a 90 Hz transition band7. If required the isolated oscillatory potential signal can then be subtracted from the unfiltered waveform to confirm the identity of the a-wave trough.
- The implicit time (latency) of the a- and b-wave peaks can also be a useful measure (Figure 1). Use the twin flashes to isolate the rod response. Subtract the cone response (flash 2) from the mixed response (flash 1) to isolate the rod response (Figure 2).
- Normalize individual light intensity a-wave and b-wave amplitudes (post-treatment/post-treatment-baseline) or averaged for treatment groups. Intensity-response curves plot the group amplitudes and error against flash energy.
Representative Results
The protocol can be used to measure visual function of rodent retina in vivo. The a-wave, a measure of photoreceptor function, and the b-wave, a measure of inner retina function, are annotated in Figure 1.
The rod-dominated ERG signal increases with the increasing light stimulus, as shown in Figure 2A. The a-wave becomes apparent at ~0.4 log scot cd.s.m-2 and the amplitude of the a-wave increases until saturation at 2.5 log scot cd.s.m-2 (not shown). The twin flash paradigm has been used to separate mixed ERG signal into cone and rod isolate response, as in Figure 2B.
This ERG recording technique can be used to check neuroprotective interventions. Baseline recordings completed a week prior to light damage are seen in Figure 3A. Light damage reduced both a-wave and b-wave amplitudes, demonstrated in Figure 3B. Remote ischemic preconditioning was able to reduce the loss of ERG amplitude, as seen in Figure 3C. The remote ischemia technique depends on the correct application of the tourniquet above the “knee”. Incorrect application of the tourniquet does not prevent light damage to the retina, as seen in Figure 3D.
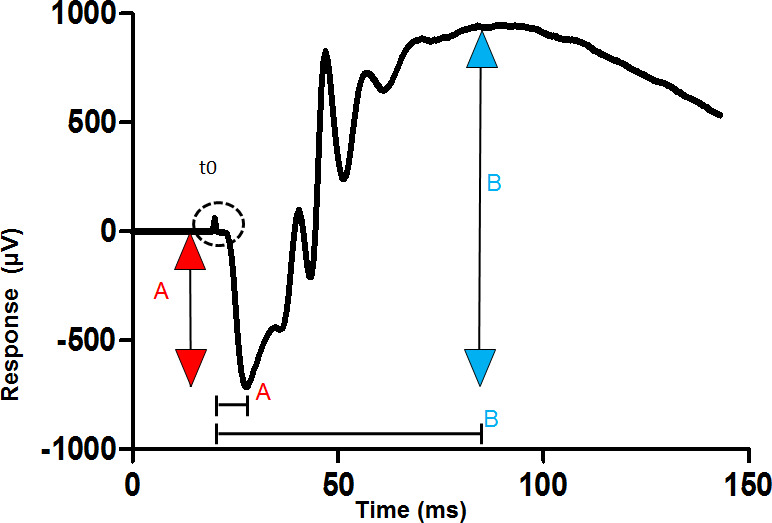
Figure 1: Measurement of the a-wave and b-waves from a dark-adapted ERG. The trace shown is recorded from the cornea of a dark-adapted eye to a bright flash of light given at the time shown t0. The amplitude of the a-wave is measured from the baseline to the first trough (red arrow). The amplitude of the b-wave is measured from the trough of the a-wave to the following positive peak (blue arrow). Implicit time (latency) is measured from the stimulus artefact (t0) to the point of interest on the trace, such as the trough of the a-wave (square bracket). Please click here to view a larger version of this figure.
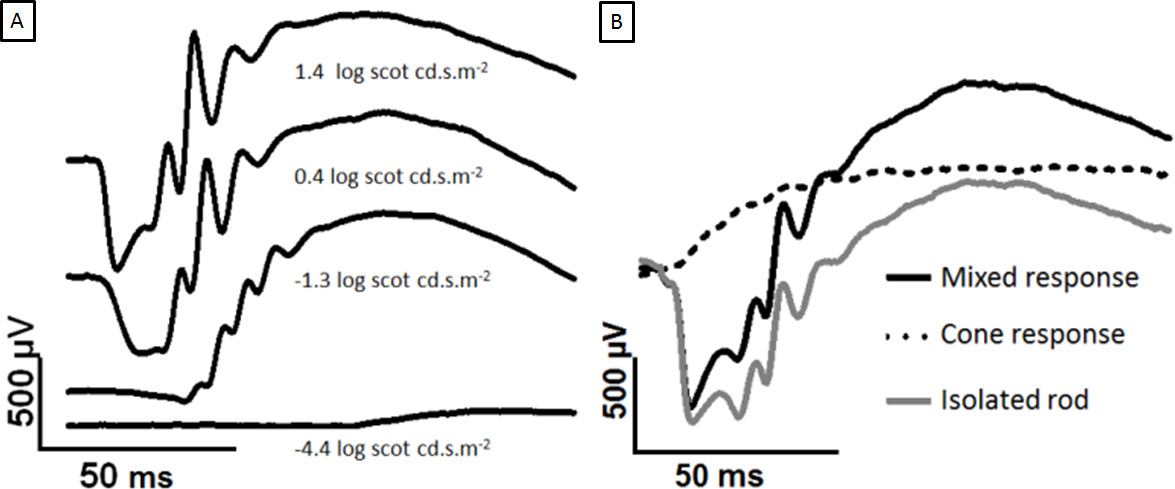
Figure 2: Development of dark-adapted ERG with increasing flash strength and separation of rod and cone responses. The traces shown are recorded from the cornea of a dark-adapted eye to increasing flashes of light. The a-wave appears at brighter intensities. (A) Comparing 1.4 to 0.4 log scot cd.s.m-2, the peak b-wave has saturated but the a-wave continues to grow. In (B), the twin flashes are overlaid. The two 2.0 log scot cd.s.m-2 flashes are separated by a 500 msec ISI. The first flash generates a mixed response (black), and the second flash generates a cone-only response (dotted line). Subtracting the cone response yields the isolated rod response (grey). Please click here to view a larger version of this figure.
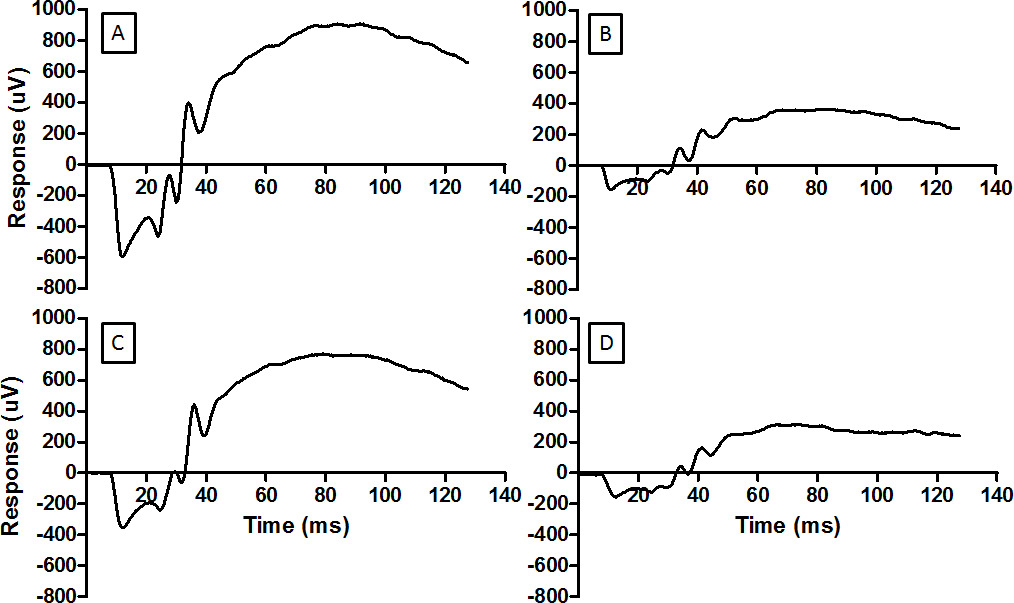
Figure 3: The ERG provides a measure of the function of retina. Representative waveforms are shown here for (A) normal retina, (B) retina damaged by light, (C) retina conditioned by RIP before being exposed to the damaging light, and (D) retina ineffectively conditioned by RIP and then exposed to damaging light. The same flash energy was used for each record (2.0 log cd.s.m-2). For the record in D the pressure cuff on the hind limb was incorrectly placed and ischemia was not established. Light damage reduces the amplitude of the ERG (B) and RIP mitigates the reduction. Please click here to view a larger version of this figure.
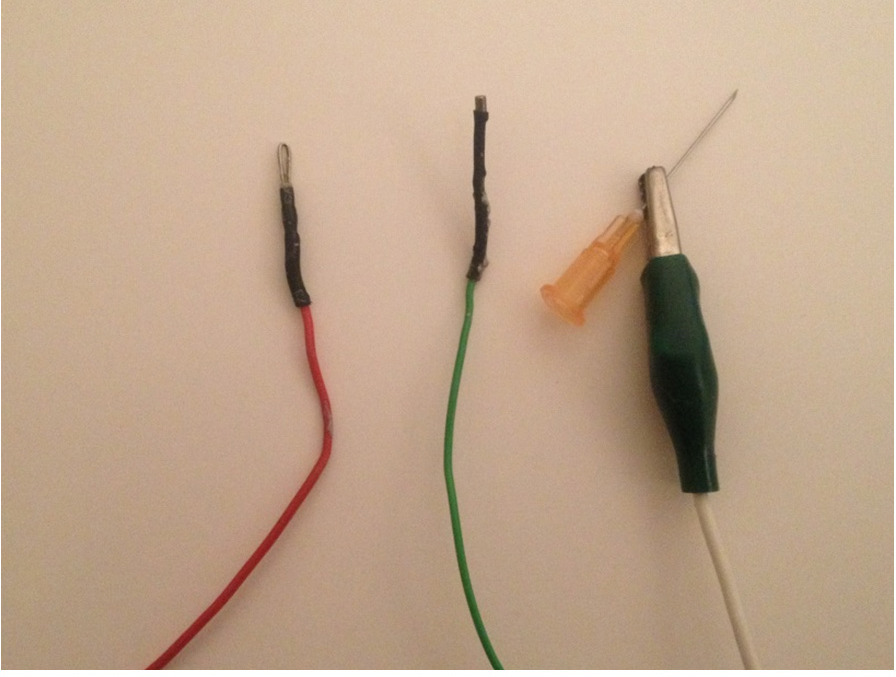
Figure 4: Close up ERG electrodes. The electrodes to be built are shown, left to right; the positive electrode to contact the cornea, the negative electrode to be placed in the mouth and the reference electrode which is made up of an alligator clip connected to a needle that is then inserted into the rump subcutaneously. Please click here to view a larger version of this figure.
Discussion
The dark-adapted flash ERG method described above is a reliable method for assessing retinal function in rats. Both the a-wave and b-wave were reduced by light damage. Remote ischemic preconditioning mitigated light damage-induced reductions in the a-wave and b-wave. This preservation of retinal function suggests that remote ischemic preconditioning has induced neuroprotection, resembling other forms of protective preconditioning such as hypoxia, ischemia and exercise8-10. The ERG signal recorded is determined by three sets of factors – the recording setup, parameters of the light stimulus, and the state of the animal.
Recording setup
The ERG is reduced in amplitude when electrodes are incorrectly placed or the preparation is incompletely grounded11. Correct grounding of nearby electrical equipment is important, to reduce noise in the recording; if significant noise persists a faraday cage should be used. The positive electrode should be securely positioned at the centre of the cornea with confirmation of the position checked before starting the ERG full-field protocol and at completion. It is important that this electrode contacts only the cornea; contact with the eyelid or even whiskers can reduce signal amplitude. A loose cotton thread has been used in this protocol to prevent the eyelids from touching the positive electrode. Some investigators have developed contact lenses with the positive electrode embedded to ensure reliable contact and the prevention of eyelid touching12.
The light stimulus set up
The stimulator we have used provides broad-spectrum white light, from LED sources. Other light sources are suitable as light stimuli such as xenon strobe lighting and halogen lighting, see Weymouth and Vingrys for comparisons between light stimuli11. The advantage of LED light, however, is that the duration of each flash and its energy are easily programmable and rapidly reset over a wide range of light intensities. We have developed a set of flashes of graded energy, which in the dark-adapted rodent range from threshold (producing a just-detectable response) to saturating (producing a maximal response).
By trial and error, we have established interstimulus intervals (ISIs) which ensure that the amplitude of response to a flash is independent of a preceding flash of the same intensity. The brighter the flash, the longer the ISI required for this independence.
Also by trial and error we have established a minimum number of responses required at each energy to provide a clean signal. Averaging more responses will always provide a cleaner signal. We use the minima so that the energy series can be completed quickly (in our protocol 11 min); rapid completion reduces variation due to changes in anesthetic state and allows time for other variables to be studied, if needed.
State of the animal
Several parameters of the animal’s physiology are important to optimise and standardise the ERG recordings obtained.
Temperature
The a-wave signal is generated from the light-induced activation of a G protein-coupled phototransduction cascade in the outer segment; the dynamics of this cascade are, like all enzymatic reactions, temperature-dependent13,14. Rodents under anaesthesia are prone to hypothermia and require external heating to maintain a core temperature of 37.5 °C throughout the recording. If body temperature falls more than 1-2 °C, the a-wave and b-wave amplitudes decrease and their latencies increase15.
Anesthesia
Stable ERG recordings require the animal to be motionless. Neuromuscular blockers and anaesthetic agents are used in ERG experimentation to achieve an unconscious and motionless state. There have only been five reports of awake ERG recordings in rats16-20. In these studies, electrodes were surgically pre-implanted into the skull and two of these studies tested the effect of anaesthesia on the ERG17,20.
The most common anesthetic used for ERG recordings has been a combination of ketamine and xylazine (in our experiments 60 mg/kg of ketamine and 5 mg/kg of xylazine is used). This affects the ERG less than gaseous anaesthesia such isoflurane and halothane, and has proved relatively non-toxic, with high recovery rates17,21,22. This approach keeps the animal immobile for ~40 min; a half dose can be used to extend recording conditions for a similar period. The study by Chang directly compared the ERG with and without anesthesia and showed that ketamine-xylazine does measurably perturb the amplitude and latencies of a- and b-waves17. Most researchers standardise anesthetic conditions and then test experimental parameters; some effect of anaesthetics cannot be entirely discounted.
Ocular environment
The physiology of the eye requires maintenance, to optimise and standardise ERG recording. The pupils should be a standard size; this is achieved with a mydriatic, applied as eye drops, to achieve maximal dilation. In rodents, atropine or phenylephrine is used23. The hydration of the cornea is maintained by application of a carbomer polymer prior to recordings; this also stabilises electrical conductance between the positive electrode and cornea. If the cornea becomes dehydrated, corneal scarring and cataract formation may occur24. Cataract formation is more common in mice25, and various methods of maintaining corneal hydration have been employed in mouse ERG recordings, including a constant flow of aqueous fluid or custom-made contact style electrodes that trap hydration at the corneal surface12.
Adaptive state of retina
This is a major variable. The protocol provided above is designed to ensure that the retina is dark-adapted, to its most sensitive state. Ideally, pigmented rats required 3 hr of dark housing to be fully dark-adapted whilst non-pigmented animals, such as Sprague Dawley rats, require a minimum of 5 hr26. It is standard practise for scotopic ERG recordings to adapt animals overnight for 12 hr. Partial or full adaptation to light can be easily and quickly achieved by turning on a standard intensity background light in the Ganzfeld stimulator. After light adaptation, however, full dark adaptation takes hours to achieve; hence the suggestion of extreme caution to ensure that the eyes are not exposed accidentally to light before recording.
The ERG recording technique is limited by the above determining factors (i.e., ERG & stimulus set-up) and the proficiency of the researcher at ERG testing. Inexperienced researchers are likely to have variable ERG recordings. Variance can be reduced by creating large enough sample sizes to compare outcomes, such as reductions or gains in visual function. Alternatively, ERG recordings can be normalised between baseline recordings and post-treatment recordings. The normalised data can then be grouped and analysed. When presenting ERG data, it is standard practise to show group data and representative waveforms.
When all of the above are carefully controlled, the amplitude of the ERG is a measure of the functional state of the retina. The ERG is consistently reduced in amplitude by depletion of the photoreceptor layer caused by light damage or genetically induced degeneration27,28. Conversely, the protective effect of an intervention such as RIP can be detected in the amplitude of the ERG29. The ERG has also been used in demonstrating the protective effects of ischemic preconditioning, hypoxic preconditioning, exercise, and dietary saffron on the retina8-10,30.
Growing knowledge of the dynamics of the phototransduction cascade of rhodopsin, and of the synaptic connections of the retina, has encouraged the development of models of ERG generation, and sophisticated ERG waveform analysis is possible though kinetic modelling based on known physiological events of phototransduction in photoreceptors, and our understanding of inner retinal circuitry31. For example, the a-wave kinetic models are based on the biochemical steps that occur during phototransduction and fitting the model enables comparisons of model parameters such as peak responses, timing delays and sensitivity14.
The disadvantage of modelling is that it relies on assumptions about retinal circuitry, and can only be as informative as the assumptions allow. In light of this disadvantage, the a-wave kinetic model has been recently criticised for oversimplifying a-wave dynamics32. In photoreceptor degeneration studies, ERG waveform analysis is typically not performed for a different reason. Photoreceptor degeneration is often severe, resulting in dramatic losses in visual function and consequently, further analysis of a-wave and b-wave parameters is not warranted8,9,27,30. Regardless, ERG modelling of the a-wave and b-wave has been adopted as standard practise in many rodent studies and detailed information on ERG modelling, for a-wave, b-wave and OPs can be found in studies by Hood, and review articles by Weymouth and Vingrys, Frishman, and Wachtmeister11,32-34.
In summary, the dark-adapted ERG method presented can record measurable differences between retinal degeneration with and without neuroprotective interventions such as remote ischemic preconditioning. The elements essential to reliable ERG recordings have been described. The ERG measurements of photoreceptor and inner retina function are useful for researchers studying degenerations of the retina, and the effects of various genetic, biopharmaceutical and pharmacological interventions on visual function.
Disclosures
The authors have nothing to disclose.
Acknowledgements
The authors are grateful for the assistance of Mrs. Sharon Spana in rodent monitoring, handling and experimentation. PhD funding support has been provided by University of Sydney and Australian Research Centre for Excellence in Vision.
Materials
| PC computer | |||
| Powerlab, 4 channel acquistion hardware | AD Instruments | PL 35044 | Acquistion of ERG |
| Animal Bio Amp | AD Instruments | FE 136 | Amplifier for ERG |
| Lab chart | AD Instruments | Signal collection software | |
| Ganzfield | Photometric solutions | FS-250A | Light stimulus |
| Ganzfield operating system | Photometric solutions | ||
| Research Radiometer | International light technologies | ILT-1700 | calibrate light series |
| Lux meter | LX-1010B | check red light illumanation | |
| Excel | microsoft | ||
| Lead wires | AD Instruments | Connect postive, negative ground electrodes to amplifier | |
| Lead wires -aligator | AD Instruments | ground ganzfield and acquistion hardware to computer | |
| Platinum wire 95% | A&E metals | postive electrode | |
| Mouth electrode Ag/AgCl Pellet | SDR | E205 | negative electode |
| 26 gauge needle | BD | ground electode | |
| Water pump | |||
| Water bath | |||
| Tubing | |||
| Homeothermic blanket system with flexible probe | Harvard Appartus | 507222F | |
| Atropine 1% w/v | Bausch & Lomb | topical mydriasis | |
| Proxmethycaine 0.5% w/v | Bausch & Lomb | topical anaesthetic | |
| Visco tears eye drops | Novartis | carbomer polymer | |
| Thread | retract eye lid | ||
| Tweezers | |||
| Reusable adhesive | Blu tac | Dim red headlamp. Affix electrodes | |
| Absorbent bedding | |||
| Ketamil – ketamine 100 mg/ml – 50 ml | Troy Laboratories Pty Ltd | dissociative | |
| Xylium – Xylazine 100 mg/ml – 50 ml | Troy Laboratories Pty Ltd | muscle relaxant | |
| Scale |
References
- Arden, G. B., Heckenlively, J. . Principles and practice of clinical electrophysiology of vision. , 139-183 (2006).
- Bui, B. V., Fortune, B. Ganglion cell contributions to the rat full-field electroretinogram. Journal of Physiology-London. 555 (1), 153-173 (2004).
- Fortune, B., et al. Selective ganglion cell functional loss in rats with experimental glaucoma. Investigative Ophthalmology & Visual Science. 45 (6), 1854-1862 (2004).
- Alarcon-Martinez, L., et al. Short and long term axotomy-induced ERG changes in albino and pigmented rats. Molecular Vision. 15 (254-255), 2373-2383 (2009).
- Lyubarsky, A. L., et al. Functionally rodless mice: transgenic models for the investigation of cone function in retinal disease and therapy. Vision Research. 42 (4), 401-415 (2002).
- Bush, R. A., Sieving, P. A. . A PROXIMAL RETINAL COMPONENT IN THE PRIMATE PHOTOPIC ERG A-WAVE. Investigative Ophthalmology & Visual Science. 35 (2), 635-645 (1994).
- Liu, K., et al. Development of the electroretinographic oscillatory potentials in normal and ROP rats. Investigative Ophthalmology & Visual Science. 47 (12), 5447-5452 (2006).
- Casson, R. J., Wood, J. P. M., Melena, J., Chidlow, G., Osborne, N. N. The effect of ischemic preconditioning on light-induced photoreceptor injury. Investigative Ophthalmology & Visual Science. 44 (3), 1348-1354 (2003).
- Lawson, E. C., et al. Aerobic Exercise Protects Retinal Function and Structure from Light-Induced Retinal Degeneration. Journal of Neuroscience. 34 (7), 2406-2412 (2014).
- Grimm, C., et al. HIF-1-induced erythropoietin in the hypoxic retina protects against light-induced retinal degeneration. Nature Medicine. 8 (7), 718-724 (2002).
- Weymouth, A. E., Vingrys, A. J. Rodent electroretinography: Methods for extraction and interpretation of rod and cone responses. Progress in Retinal and Eye Research. 27 (1), 1-44 (2008).
- Bayer, A. U., Cook, P., Brodie, S. E., Maag, K. P., Mittag, T. Evaluation of different recording parameters to establish a standard for flash electroretinography in rodents. Vision Research. 41 (17), 2173-2185 (2001).
- Pugh, E. N., Lamb, T. D. AMPLIFICATION AND KINETICS OF THE ACTIVATION STEPS IN PHOTOTRANSDUCTION. Biochimica Et Biophysica Acta. 1141 (2-3), 111-149 (1993).
- Breton, M. E., Schueller, A. W., Lamb, T. D., Pugh, E. N. ANALYSIS OF ERG A-WAVE AMPLIFICATION AND KINETICS IN TERMS OF THE G-PROTEIN CASCADE OF PHOTOTRANSDUCTION. Investigative Ophthalmology & Visual Science. 35 (1), 295-309 (1994).
- Mizota, A., Adachi-Usami, E. Effect of body temperature on electroretinogram of mice. Investigative Ophthalmology & Visual Science. 43 (12), 3754-3757 (2002).
- Szabo-Salfay, O., et al. The electroretinogram and visual evoked potential of freely moving rats. Brain Research Bulletin. 56 (1), 7-14 (2001).
- Charng, J., et al. Conscious Wireless Electroretinogram and Visual Evoked Potentials in Rats. Plos One. 8 (9), (2013).
- Galambos, R., Juhasz, G., Kekesi, A. K., Nyitrai, G., Szilagyi, N. NATURAL SLEEP MODIFIES THE RAT ELECTRORETINOGRAM. Proceedings of the National Academy of Sciences of the United States of America. 91 (11), 5153-5157 (1994).
- Galambos, R., Szabo-Salfay, O., Szatmar, E., Szilagyi, N., Juhasz, G. Sleep modifies retinal ganglion cell responses in the normal rat. Proceedings of the National Academy of Sciences of the United States of America. 98 (4), 2083-2088 (2001).
- Guarino, I., Loizzo, S., Lopez, L., Fadda, A., Loizzo, A. A chronic implant to record electroretinogram, visual evoked potentials and oscillatory potentials in awake, freely moving rats for pharmacological studies. Neural Plasticity. 11 (3-4), 241-250 (2004).
- Huang, J. C., Salt, T. E., Voaden, M. J., Marshall, J. NON-COMPETITIVE NMDA-RECEPTOR ANTAGONISTS AND ANOXIC DEGENERATION OF THE ERG B-WAVE IN-VITRO. Eye (London). 5 (4), 476-480 (1991).
- Sasovetz, D. . KETAMINE HYDROCHLORIDE – EFFECTIVE GENERAL ANESTHETIC FOR USE IN ELECTRORETINOGRAPHY. Annals of Ophthalmology. 10 (11), 1510-1514 (1978).
- Mojumder, D. K., Wensel, T. G. Topical Mydriatics Affect Light-Evoked Retinal Responses in Anesthetized Mice). Investigative Ophthalmology & Visual Science. 51 (1), 567-576 (2010).
- Fraunfel, F. t., Burns, R. P. ACUTE REVERSIBLE LENS OPACITY – CAUSED BY DRUGS, COLD, ANOXIA, ASPHYXIA, STRESS, DEATH AND DEHYDRATION. Experimental Eye Research. 10 (1), 19 (1970).
- Calderone, L., Grimes, P., Shalev, M. ACUTE REVERSIBLE CATARACT INDUCED BY XYLAZINE AND BY KETAMINE-XYLAZINE ANESTHESIA IN RATS AND MICE. Experimental Eye Research. 42 (4), 331-337 (1986).
- Behn, D., et al. Dark adaptation is faster in pigmented than albino rats. Documenta Ophthalmologica. 106 (2), 153-159 (2003).
- Sugawara, T., Sieving, P. A., Bush, R. A. Quantitative relationship of the scotopic and photopic ERG to photoreceptor cell loss in light damaged rats. Experimental Eye Research. 70 (5), 693-705 (2000).
- Machida, S., et al. P23H rhodopsin transgenic rat: Correlation of retinal function with histopathology. Investigative Ophthalmology & Visual Science. 41 (10), 3200-3209 (2000).
- Brandli, A., Stone, J. Remote Ischemia Influences the Responsiveness of the Retina. Observations in the Rat. Investigative Ophthalmology & Visual Science. 55 (4), 2088-2096 (2014).
- Maccarone, R., Di Marco, S., Bisti, S. Saffron supplement maintains morphology and function after exposure to damaging light in mammalian retina. Investigative Ophthalmology & Visual Science. 49 (3), 1254-1261 (2008).
- Hood, D. C., Birch, D. G. Assessing abnormal rod photoreceptor activity with the a-wave of the electroretinogram: Applications and methods. Documenta Ophthalmologica. 92 (4), 253-267 (1996).
- Robson, J. G., Frishman, L. J. The rod-driven a-wave of the dark-adapted mammalian electroretinogram. Progress in Retinal and Eye Research. 39, 1-22 (2014).
- Hood, D. C., Birch, D. G. A COMPUTATIONAL MODEL OF THE AMPLITUDE AND IMPLICIT TIME OF THE B-WAVE OF THE HUMAN ERG. Visual Neuroscience. 8 (2), 107-126 (1992).
- Wachtmeister, L. Oscillatory potentials in the retina: what do they reveal. Progress in Retinal and Eye Research. 17 (4), 485-521 (1998).
