Robust detection reagents are of increasing necessity for developing new malaria diagnostic tools. An iridium(III) probe was designed that emits long-lasting luminescent signal in the presence of a histidine-rich malarial protein biomarker. Detection of the protein either in solution or immobilized on a magnetic particle affords flexibility in application.
Method Article
Iridium(III) Luminescent Probe for Detection of the Malarial Protein Biomarker Histidine Rich Protein-II
In This Article
Summary
Abstract
This work outlines the synthesis of a non-emissive, cyclometalated Ir(III) complex, Ir(ppy)2(H2O)2+ (Ir1), which elicits a rapid, long-lived phosphorescent signal when coordinated to a histidine-containing protein immobilized on the surface of a magnetic particle. Synthesis of Ir1, in high yields,is complete O/N and involves splitting of the parent cyclometalated Ir(III) chloro-bridged dimer into two equivalents of the solvated complex. To confirm specificity, several amino acids were probed for coordination activity when added to the synthesized probe, and only histidine elicited a signal response. Using BNT-II, a branched peptide mimic of the malarial biomarker Histidine Rich Protein II (pfHRP-II), the iridium probe was validated as a tool for HRP-II detection. Quenching effects were noted in the BNT-II/Ir1 titration when compared to L-Histidine/Ir1, but these were attributed to steric hindrance and triplet state quenching. Biolayer interferometry was used to determine real-time kinetics of interaction of Ir1 with BNT-II. Once the system was optimized, the limit of detection of rcHRP-II using the probe was found to be 12.8 nM in solution. When this protein was immobilized on the surface of a 50 µm magnetic agarose particle, the limit of detection was 14.5 nM. The robust signal response of this inorganic probe, as well as its flexibility of use in solution or immobilized on a surface, can lend itself toward a variety of applications, from diagnostic use to imaging.
Introduction
Colorimetric and fluorescent labeling is an important method for the detection and tracking of biochemical molecules and processes1,2. The most common fluorescent markers are low molecular weight organic dyes3,4, but these molecules do not always have ideal optical properties. Fluorescent dyes are prone to photobleaching, often have small Stokes shifts, and may have overlapping excitation and emission spectra. Colorimetric labeling is often achieved by the use of enzymatic labels, which have an amplified signal useful in immunoassay quantification5,6. These enzymes also have their drawbacks, including photosensitivity, reaction conditions, and short substrate shelf life. These properties tend to require immunoassays and protein labeling methods to be done under well-controlled conditions using costly reagents.
Emissive transition-metal complexes have been explored as an alternative labeling approach for biochemical detection. In particular, cyclometalated Ir(III) has been studied in the context of organic light emitting diodes (OLEDs)7-9 oxygen sensing10, catalysis11, and protein/cell staining12-14. High photostability and quantum efficiency make this class of probes a good candidate for biomolecule detection15,16. It was previously found that cyclometalated Ir(III) complexes, of the form [Ir(C^N)2(solv)2]+, irreversibly bind histidine and elicit a blue-green signal response12,17. These complexes are non-emissive in the solvento state, but when histidine displaces the solvent molecules and binds to the metal center, they release an intense phosphorescent signal after long-wave UV irradiation. This signal only occurs after ligand substitution, and is the result of a triplet state electron relaxing to the ground state through the activation of metal ligand charge transfer (3MLCT) and ligand centered transfer (3LC) pathways8,15. These complexes can potentially be used as detection probes for histidine-rich proteins.
Histidine-rich proteins and their regulation levels are important in many diseases, including liver cirrhosis, cancer, and thrombic disorders.18Plasmodium falciparum Histidine Rich Protein II (pfHRP-II) in particular is a well-validated biomarker for malaria parasite infection. This protein is 67 kDa and contains 34% histidine, mostly within characteristic AHHAHHAAD repeating motifs19. These histidine repeats can bind free metal ions19 and heme complexes20 in host blood. pfHRP-II is commonly detected in low-resource settings using immunochromatographic rapid diagnostic tests (RDTs), but these tests are often inaccurate due to sample conditions, low biomarker concentration, poor manufacturing standards, and antibody degradation21.
Metal-based phosphorescent probes such as the cyclometalated Ir(III) complexes described above are attractive options for the detection of pfHRP-II due to their selective binding of histidine and their stabile and efficient emission properties. In this paper, the use of [Ir(ppy)2(H2O)2]+ (Ir1) to detect BNT-II, a branched peptide mimic of pfHRP-II is explored22. Kinetics of this interaction were monitored in real-time using biolayer interferometry techniques. The assay was also adapted to an on-bead ELISA-type format, where nanomolar limits of detection were achieved. This assay holds advantages over traditional ELISAs because it can be performed in under 2 hr with antibody-free reagents, instead of the 4-5 hr and biological reagents required with typical ELISAs.
Protocol
1. Synthesis of Iridium(III) Complex
- Weigh out 53.6 mg (50 µmol) of [Ir(ppy)2-Cl]2 and dissolve in 5 ml of methylene chloride. Add this solution to a 50 ml Erlenmeyer flask equipped with a stir bar.
- Weigh out 26.2 mg (100 µmol) of AgOTf and dissolve in 5 ml of methanol.
- Add the dissolved AgOTf to the [Ir(ppy)2-Cl]2 solution and stir for 1 hr.
Note: A cream colored slurry should result. - After 1 hr, filter the slurry through silica gel into a 25 x 95 mm dram vial and evaporate off remaining solvent using a rotary evaporator (5-10 min).
- Once most of the solvent is removed, check that an oily yellow residue remains in the vial. To this residue, add 1 ml of methanol to re-dissolve the product and lyophilize 1-2 days to yield the yellow solid product.
- Characterize the Ir(ppy)2(H2O)2+ product ( Ir1) by H1NMR (in CDCl3), ESI and UV-Vis as described previously.23
2. Interactions of Ir1 with Various Amino Acids
- Prepare a 2 mM solution of Ir1 in methanol (MW 537.10 g/mol). Vortex to ensure complete dissolution of the solid.
- Prepare 100 µM solutions of the following amino acids and biomolecules in HEPES buffered saline (HBS, 100 mM HEPES, 137 mM NaCl, pH 7.4) Ala, Asp, Cys, His, Ile, Lys, Ser, Try, Val.
- Pipette 100 µl of each amino acid into a black 96-well plate. Add 100 µl of HBS to the plate to serve as a blank.
- Add 2.5 µl of the 2 mM Ir1 solution to each sample and shake the plate on a plate shaker for 10 min.
- After 10 min, acquire the emission spectra of the samples using a 96-well plate reader (365 ex/400-700 em).
- Place the plate in the instrument and open the plate reader software to set up a new experiment.
- Set the new experiment to read a fluorescence scan with an excitation wavelength of 365 nm and a slit width of 9 nm with the optics at the top position.
- Read the emission from 300-700 nm with a step size of 5 nm.
- Export the data for data analysis.
- Transfer the samples to a clear 96-well plate and image the emission using a UV Transilluminator.
3. Titration of Ir1 with BNT-II
- Prepare a 1 mM stock solution of BNT-II (MW 8233.6 g/mol) in HBS as well as a 2 mM solution of Ir1 in methanol.
- From the stock solution, prepare 1 ml of 100 µM BNT-II in HBS. Vortex the microcentrifuge tube to ensure the sample is mixed.
- Serially dilute the 100 µM BNT-II by half in HBS to a final concentration of 1.56 µM BNT-II.
- Add 100 µl of each dilution, in triplicate, with HBS serving as a blank, to the wells of a 96 well plate. To each sample, add 2.5 µl of 2 mM Ir1.
- Shake the plate for 10 min on a plate shaker.
- After shaking, read the emission intensity at 510 nm (excitation at 365 nm) using a 96-well plate reader.
- Place the plate in the instrument and open the plate reader software to set up a new experiment.
- Set the new experiment to read a fluorescence endpoint with an excitation wavelength of 365 nm and emission wavelength of 510 nm. Set the slit width for both wavelengths to 9nm, with the optics at the top position.
- Read the plate and export the data for analysis.
- Transfer the samples to a clear 96-well plate and image the titration using a UV transilluminator.
4. Real-time Kinetic Analysis of the Ir1/BNT-II System Using Biolayer Interferometry
- Add 200 µl of kinetic buffer (KB; 1x phosphate buffered saline with 0.02% Tween-20) to 8 wells in the first column of a black 96-well plate and insert the plate into the plastic sensor holder. Carefully transfer 8 Ni(II)NTA biosensors to the first column in the plastic holder such that the tips are suspended in the wells of buffer. Place the plastic holder in the left side of the interferometry instrument.
- Prepare a 2 ml of a 0.5 µM solution of BNT-II in KB.
- Prepare 500 µl of a 10 µM solution of Ir1 in KB, and serially dilute by half down to 0.156 µM in KB.
- To a new black 96 well plate, pipette 200 µl of KB to all 8 wells in column A and C.
- In the same plate, pipette 200 µl of the 0.5µM BNT-II solution to the wells in column B.
- Pipette 200 µl of each dilution of Ir1 into column D, starting with KB as the blank in well D1. Add the dilutions so that the wells increase in Ir1 concentration down the column.
- Place this plate in the instrument to the right of the plate containing the pre-wetting sensors.
- In the biolayer interferometry software, set up a basic kinetic experiment by defining the plate, assay, and sensor tips.
- To define the plate, select a column on the screen, right click, and choose the appropriate definition for the wells. Select “Buffer” for columns A and C, “Load” for column B, and “Sample” for column D.
- Define the assay in the next tab by adding the following steps (Click “Add”): Equilibration (Custom), 60 sec; Loading, 120 sec; Baseline, 60 sec; Association, 120 sec; and Dissociation, 300 sec. Select the Equilibration step and double-click on column A. Repeat for Loading (column B), Baseline (column C), Association (column D), and Dissociation (column C). Select the Ni(II)NTA sensors.
- Move to the next tab and confirm that the sensors are in column A on the plastic sensor holder.
- Confirm the experiment is outlined correctly, insert a filename, ensure that “delay experiment” is checked, and press “Go.”
Note: Due to the automated nature of the instrument, once the kinetic experiment is outlined, the steps will occur as programmed.
- Once the kinetic run is complete, process the data in the provided processing software.
- Double-click on the folder with the filename of interest in the bottom portion of the panel on the left. Then, double-click the corresponding folder under “Kinetics” in the top portion of the panel. Move to the Processing tab.
- Check the Subtraction box on the left to open the sensor selection screen. Right click on well A4 and change the well type to Reference Well.
- Check the box next to Align Y axis, and ensure the selected step is Baseline. Specify the time range to be the last five sec of the baseline (approximately 55-60 sec).
- Check the box for Inter-step Correction and select Align to Dissociation. Ensure that the Savitzky-Golay Filtering box is checked and press “Process Data!”
- Move to the Analysis tab. Ensure that “Association and Dissociation” is the selection for steps to analyze and that the Model is 1:1. Select a Local, Full fit and press “Fit Curves!”
- Highlight all curves in the table and right click to set all curves to one color. Next, select a Global (Full) fit, grouped by color and Rmax Unlinked by Sensor. Press “Fit Curves!” to obtain global kinetics data.
5. On-bead Detection of BNT-II and rcHRP-II with Ir1
- Prepare 1 ml each of a 1 µM solution of BNT-II and rcHRP-II in HBS with Tween (HBST; HBS with 0.025% Tween 20).
- Serially dilute each protein by half in HBST to a final concentration of 15.6 nM.
- Pipette 100 µl of each dilution, in triplicate, into a white 96-well plate, with the dilutions in order from lowest to highest concentration down a column.
- Pipette 10 µl of 50 µm Ni(II)NTA magnetic agarose particles into each dilution well.
- Vortex the microcentrifuge tube containing the magnetic particles after each pipetting to ensure the particles stay suspended.
- Place the plate on a plate shaker for 15 min to incubate the samples with the particles.
- After this incubation period, place the plate on a 96-well plate magnet and wait 30 sec for the particles to pull out of solution.
- Using a multichannel pipette, pull off the original sample and discard as waste. Remove the plate from the magnet.
- Add 200 µl of HBST to each well using the multichannel pipette. Pump the buffer up and down several times to wash the magnetic particles.
- Place the plate back onto the magnet and wait 30 sec for the particles to pull out of solution.
- Using the multichannel pipette, pull off the 200 µl of buffer and discard as waste. Remove the plate from the magnet.
- Repeat steps 5.8 through 5.10 two times to complete three washings of the particles.
- Add 100 µl of HBST to each well containing magnetic particles followed by 2.5 µl of 2 mM Ir1.
- Incubate the particles with Ir1 on a plate shaker for 1 hr.
- After 1 hr, read the emission intensity at 510 nm (excitation at 365 nm) using a 96-well plate reader.
- Place the plate in the instrument and open the plate reader software to set up a new experiment.
- Set the new experiment to read a fluorescence endpoint with an excitation wavelength of 365 nm and emission wavelength of 510 nm. Set the slit width for both wavelengths to 9 nm, with the optics at the top position.
- Read the plate and export the data for analysis.
- Transfer the samples to a clear 96-well plate and image the titration using a UV Transilluminator.
Results
As shown in Figure 1, synthesis of the Ir1 solvento-complex involved splitting of the chloride bridge in the parent dimer by precipitation of the chloride in the form of insoluble AgCl and association of water molecules to the metal center. The formation of Ir1 was confirmed by H1NMR and ESI. Additionally, UV-visible bands characteristic of metal ligand charge transfer and π-π* transitions were assigned to the spectrum, further validating the formation of Ir1. This solvated complex exhibits no emissive character when excited at 365 nm.
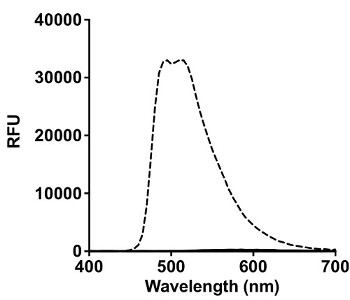
Figure 1: Synthesis and Characterization of Ir1. Chloride bridge splitting reaction of Dichlorotetrakis(2-(2-pyridinyl)phenyl)diiridium(III) to create the aquo complex Ir(ppy)2(H2O)2+ (Ir1). Upon addition of L-His to the aquo complex in aqueous buffer, luminescent signal is switched on.
Once the complex was synthesized and characterized, the amino acid selectivity was analyzed, as previously described using a similar iridium analog17. Figure 2A shows that only histidine elicited a signal response at 510 nm, when excited at 365 nm.
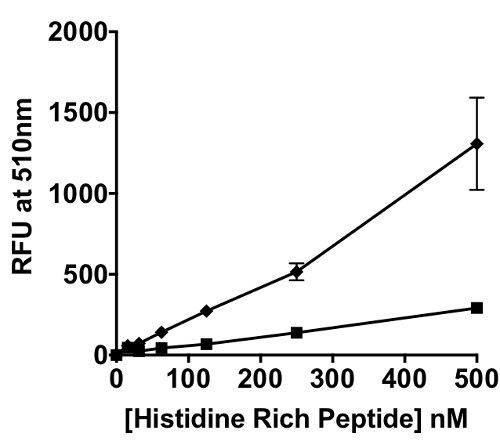
Figure 2: Amino Acid Selectivity and Titration of Ir1 with Histidine Rich Peptides. (A) Interaction of 200 µM of various amino acids (Cys, Ser, Asp, Glu, Phe, Lys, Arg, Tyr, Trp, His) with 50 µM Ir1 in HBS. Spectral scans were taken from 400-700 nm at an excitation wavelength of 365 nm in a black 96 well plate. Signal in relative fluorescence units (RFU) from all amino acids besides histidine (dashed black trace) was negligible. (B) Nanomolar concentrations of BNT-II (▪) and rcHRP-II (♦) were titrated with Ir1 in HBS. The histidine rich peptides were incubated with the probe for 15 min in solution before reading the emission at 510 nm after excitation with 365 nm light. Limit of detection was calculated as the value of x when y = 3σblank.
This “on-switch” of the phosphorescence of the iridium probe occurs because the singlet excited state (1MLCT/1LC) of the Ir(III) bioconjugate undergoes intersystem crossing to the triplet excited state (3MLCT), when histidine is coordinated to the metal center. This probe was applied to BNT-II a peptide mimic of the malarial biomarker Plasmodium falciparum Histidine Rich Protein II (pfHRP-II). In a titration of BNT-II with Ir1, a concentration dependent signal response was observed (Figure 2B). Recombinant HRP-II (rcHRP-II) also exhibited a similar response in solution. The limits of detection of BNT-II and rcHRP-II in solution were 54.8 nM and 12.8 nM, respectively. Using biolayer interferometry techniques, the KD of Ir1 binding to BNT-II immobilized on a Ni(II)NTA surface was found to be 2.05 µM (Figure 3).
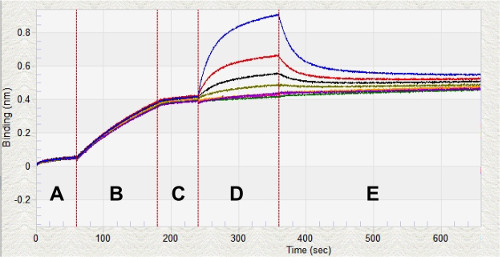
Figure 3: Real-time Kinetic Analysis of Ir1 with BNT-II. Biolayer interferometry for kinetic analysis of various concentrations of Ir1 binding to BNT-II on the surface of a Ni(II)NTA glass sensor. After equilibrating the sensors in KB (Region A), the sensors are loaded with 0.5 µM BNT-II (Region B). Once the peptide is loaded on the sensors, a baseline is established (Region C) prior to measuring the association of Ir1 to the BNT-II (Region D). After a period of association, the sensors are placed back into KB to measure dissociation (Region E). The whole kinetic analysis process takes less than 30 min.
When transitioning from a solution-based assay to a magnetic particle platform, the added complexity of the particle in the system had to be taken into account. It was known from previous work, that these particles efficiently bind the malaria biomarker pfHRP-II.24 Black fluorescent plates worked well for the solution assay describe above, but white plates were better suited for the on-particle detection platform, as seen in Figure 4A. In a white plate, the light is reflected back into the sample, thus allowing for better absorbance by the Ir1 bound to the surface of the particle. In the on-particle assay, the limit of detection of rcHRP-II was determined to be 14.5 nM (Figure 4B). The limit of detection for rcHRP-II in-solution and on-bead were statistically the same based on an unpaired t-test (p = 0.731).
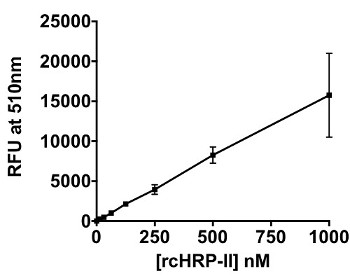
Figure 4: On-bead Detection of BNT-II and HRP-II. (A) Difference between the signal detected from Ir1 bound to BNT-II on the surface of 50 µm Ni(II)NTA magnetic agarose particles in a black 96-well plate (solid line) versus a white 96-well plate (dashed line). The particles were excited with 365 nm light, and emission was measured at 510 nm. (B) Titration of rcHRP-II immobilized on the magnetic particles and detected using Ir1. Limit of detection was calculated as the value of x when y = 3σblank.
Figure 5: Schematic Representation of the On-bead Detection of rcHRP-II with Ir1. General scheme of HRP-II binding to the surface of Ni(II)NTA particles and labeled with Ir1. The particles are incubated with a histidine rich peptide for 15 min. After this incubation period, the particles are washed with HBST using a magnet, in order to pull the particles out of solution. Finally, the peptide bound particles are incubated with Ir1 for 1 hr prior to reading the emission at 510 nm after excitation with 365 nm light.
Discussion
As microparticle-based diagnostic tools come to the forefront of modern diagnostic technology, detection of target biomolecules directly on the surface of the particle is a major advantage. Traditional molecular detection methods, such as ELISA and PCR, are advantageous, in that they can achieve very low limits of detection25. However, these assays require extensive reagents and lengthy protocols. This assay was designed to mimic ELISA-type sandwich interactions without the time and reagent requirements (Figure 5). Additionally, the cost of the Ir1 probe per sample was estimated to be around a penny, whereas the cost of antibodies for a typical ELISA is $0.20-0.30 per sample.
Since the methods described above rely on a cyclometalated iridium probe for detection of the malarial biomarker, this probe would not be susceptible to failure modes common to other detection methods (i.e. fluorophore quenching and antibody/enzyme degradation). Histidine is unique in its metal binding properties. The outlined work takes advantage of this phenomenon by replacing the antibodies in a typical ELISA sandwich with metal containing complexes. Ni(II)NTA captures rcHRP-II on the surface of the particle and Ir1 signals the presence of the protein. The most critical step in the assay is allowing the magnetic particles to mix with the sample and the probe. In a 96-well plate ELISA, the biomolecules and reagents reach equilibrium with the two-dimensional surface of the bottom of the well. Magnetic particles have the tendency to settle out of solution due to their dense iron-oxide core, which would reduce the available binding sites. Thus, the particles must be mixed during the assay time to ensure maximal binding.
When designing a reagent for disease diagnostics, one must keep in mind the form of patient sample as well as the physiological concentration of the biomarker. For malaria, the concentration of pfHRP-II in a patient’s blood can vary from low picomolar to high nanomolar. While this assay is clinically relevant for higher levels of infection, the limit of detection needs to be improved in order to detect asymptomatic patients with low picomolar circulating pfHRP-II. In the methods outlined above, the “switch-on” signal generated by Ir1 occurs in the presence of histidine. While the malarial biomarker is rich in histidine, other serum proteins, such as human serum albumin and histidine rich glycoprotein, would elicit a signal response with the probe. This would in turn lead to false positive diagnoses. This makes the capture of the protein on the surface of the particle a beneficial step, in that the protein of interest can be rapidly extracted from a patient sample. Additionally, designing a bifunctional probe, that couples a histidine rich peptide to a robust molecular recognition element (i.e. aptamer), could add another layer of specificity to the assay. The peptide would be loaded with iridium before coupling to the aptamer. In such a design, the stable Ir1 probe can still be utilized while achieving target specificity with the aptamer. This would allow for application of the probe to detect native HRP-II in a complex matrix (i.e. plasma or whole blood) and reduce non-specific binding effects. In order to further enhance the signal of rapid diagnostic tests, the assay could be incorporated into an electrochemiluminescent (ECL) system, where pfHRP-II can be detected on the RDTs as a electrochemical readout26. This next generation iridium probe would greatly enhance our on-bead ELISA assay for the detection of disease biomarkers.
Disclosures
The authors have nothing to disclose.
Acknowledgements
Support for this work was provided by the Bill and Melinda Gates Foundation Grand Challenges in Global Health: Develop Technologies That Allow Assessment of Multiple Conditions and Pathogens at Point-of-Care. K.M.D. was supported by an NSF Graduate Research Fellowship (2012095464).
Materials
| Name | Company | Catalog Number | Comments |
|---|---|---|---|
| Dicholortetrakis(2-(2-pyridinyl)phenyl)diiridium(III) | Sigma-Aldrich | 658383 | |
| silver trifluoromethanesulfonate | Sigma-Aldrich | 176435 | |
| Silica gel | Sigma-Aldrich | 6858 | |
| L-Amino acids | Fisher Scientific | varies | |
| HEPES | Sigma-Aldrich | H3375 | |
| BNT-II peptide | Synthesized in house | N/A | |
| recombinant HRPII | Immunology Consultants Laboratory inc. | AGPF-55 | |
| Costar black polypropylene 96-well plate | Fisher Scientific | 07-200-567 | |
| Costar white polypropylene 96-well plate | Fisher Scientific | 07-200-589 | |
| Grenier black polypropylene 96-well plate | VWR | 89089-582 | |
| Ni(II)NTA magnetic agarose particles | Qiagen | 36111 | |
| Ni(II)NTA biolayer interferometry sensors | ForteBio | 18-5101 | |
| Octet Red96 Biolayer Interferometry Instrumet | ForteBio | ||
| Biotek Synergy H4 Microplate Reader | Biotek | ||
| Fisher Biotech Transilluminator | Fisher Scientific | FBDLT-88 |
References
- Gubala, V., Harris, L. F., Ricco, A. J., Tan, M. X., Williams, D. E. Point of Care Diagnostics: Status and Future. Analytical Chemistry. 84, 487-515 (2011).
- Kuzmenko, A., et al. Single molecule tracking fluorescence microscopy in mitochondria reveals highly dynamic but confined movement of Tom40. Scientific Reports. 1, (2011).
- Sassolas, A., Leca-Bouvier, B. D., Blum, L. J. DNA Biosensors and Microarrays. Chemical Reviews. 108, 109-139 (2007).
- Miyawaki, A., Sawano, A., Kogure, T. Review: Lighting up cells: labelling proteins with fluorophores. Nature Cell Biology. 5, S1-S7 (2003).
- Liu, M., et al. Highly sensitive protein detection using enzyme-labeled gold nanoparticle probes. Analyst. 135, 327-331 (2010).
- Almeida, M., Carabineiro, S. C. The role of nanogold in human tropical diseases: research, detection and therapy. Gold Bulletin. 46, 65-79 (2013).
- Holder, E., Langeveld, B. M. W., Schubert, U. S. New Trends in the Use of Transition Metal–Ligand Complexes for Applications in Electroluminescent Devices. Advanced Materials. 17, 1109-1121 (2005).
- Wagenknecht, P. S., Ford, P. C. Metal centered ligand field excited states: Their roles in the design and performance of transition metal based photochemical molecular devices. Coordination Chemistry Reviews. 255, 591-616 (2011).
- Lamansky, S., et al. Highly Phosphorescent Bis-Cyclometalated Iridium Complexes: Synthesis, Photophysical Characterization, and Use in Organic Light Emitting Diodes. Journal of the American Chemical Society. 123, 4304-4312 (2001).
- Ho, M. -L., et al. Synthesis, structure and oxygen-sensing properties of Iridium(iii)-containing coordination polymers with different cations. Dalton Transactions. 41, 2592-2600 (2012).
- McDaniel, N. D., Coughlin, F. J., Tinker, L. L., Bernhard, S. Cyclometalated Iridium(III) Aquo Complexes: Efficient and Tunable Catalysts for the Homogeneous Oxidation of Water. Journal of the American Chemical Society. 130, 210-217 (2007).
- Ma, D. -L., et al. A Highly Selective Luminescent Switch-On Probe for Histidine/Histidine-Rich Proteins and Its Application in Protein Staining. Angewandte Chemie International Edition. 47, 3735-3739 (2008).
- Ma, D. -L., He, H. -Z., Leung, K. -H., Chan, D. S. -H., Leung, C. -H. Bioactive Luminescent Transition-Metal Complexes for Biomedical Applications. Angewandte Chemie International Edition. 52, 7666-7682 (2013).
- Leung, C. -H., et al. A Metal-Based Inhibitor of Tumor Necrosis Factor-α. Angewandte Chemie International Edition. 51, 9010-9014 (2012).
- You, Y., Nam, W. Photofunctional triplet excited states of cyclometalated Ir(iii) complexes: beyond electroluminescence. Chemical Society Reviews. 41 (21), 7061-7084 (2012).
- Zhao, Q., et al. Cationic Iridium(III) Complexes with Tunable Emission Color as Phosphorescent Dyes for Live Cell Imaging. Organometallics. 29, 1085-1091 (2010).
- Li, C., et al. A Nonemissive Iridium(III) Complex That Specifically Lights-Up the Nuclei of Living Cells. Journal of the American Chemical Society. 133, 11231-11239 (2011).
- Jones, A. L., Hulett, M. D., Parish, C. R. Histidine-rich glycoprotein: A novel adaptor protein in plasma that modulates the immune, vascular and coagulation systems. Immunology, & Cell Biology. 83, 106-118 (2005).
- Panton, L. J., et al. Purification and partial characterization of an unusual protein of Plasmodium falciparum: histidine-rich protein II. Molecular and Biochemical Parasitology. 35, 149-160 (1989).
- Schneider, E. L., Marletta, M. A. Heme Binding to the Histidine-Rich Protein II from Plasmodium falciparum. Biochemistry. 44, 979-986 (2004).
- Mabey, D., Peeling, R. W., Ustianowski, A., Perkins, M. D. Tropical infectious diseases: Diagnostics for the Developing World. Nature Reviews Microbiology. 2, 231-240 (2004).
- Ziegler, J., Chang, R. T., Wright, D. W. Multiple-Antigenic Peptides of Histidine-Rich Protein II of Plasmodium falciparum: Dendrimeric Biomineralization Templates. Journal of the American Chemical Society. 121, 2395-2400 (1999).
- Schmid, B., Garces, F. O., Watts, R. J. Synthesis and characterizations of cyclometalated iridium(III) solvento complexes. Inorganic Chemistry. 33, 9-14 (1994).
- Davis, K. M., Swartz, J. D., Haselton, F. R., Wright, D. W. Low-Resource Method for Extracting the Malarial Biomarker Histidine-Rich Protein II To Enhance Diagnostic Test Performance. Analytical Chemistry. 84, 6136-6142 (2012).
- Giljohann, D. A., Mirkin, C. A. Drivers of biodiagnostic development. Nature. 462, 461-464 (2009).
- Li, M. -J., et al. High electrochemiluminescence of a new water-soluble iridium(iii) complex for determination of antibiotics. Analyst. 136, 205-210 (2011).
Reprints and Permissions
