Size exclusion chromatography hyphenated with inductively coupled plasma - mass spectrometry (ICP-MS) is a powerful tool to measure changes in the abundance of metalloproteins directly from biological samples. Here we describe a set of metalloprotein standards used to estimate molecular mass and the amount of metal associated with unknown proteins.
Method Article
Standards for Quantitative Metalloproteomic Analysis Using Size Exclusion ICP-MS
In This Article
Summary
Abstract
Metals are essential for protein function as cofactors to catalyze chemical reactions. Disruption of metal homeostasis is implicated in a number of diseases including Alzheimer's and Parkinson's disease, but the exact role these metals play is yet to be fully elucidated. Identification of metalloproteins encounters many challenges and difficulties. Here we report an approach that allows metalloproteins in complex samples to be quantified. This is achieved using size exclusion chromatography coupled with inductively coupled plasma - mass spectrometry (SEC-ICP-MS). Using six known metalloproteins, the size exclusion column can be calibrated and the respective trace elements (iron, copper, zinc, cobalt, iodine) can be used for quantification. SEC-ICP-MS traces of human brain and plasma are presented. The use of these metalloprotein standards provides the means to quantitatively compare metalloprotein abundances between biological samples. This technique is poised to help shed light on the role of metalloproteins in neurodegenerative disease as well as other diseases where imbalances in trace elements are implicated.
Introduction
Essential metals play a vital role in normal biological functions, including secondary messenger pathways, metabolism pathways and organelle functions. 30% of all proteins are thought to be metalloproteins1 and 50% of all enzymes2. Metalloenzymes use these trace metals as cofactors to catalyze chemical reactions, stabilize protein structure, and for regulatory roles such as secondary messengers. Some of the most studied trace elements in regards to neurodegeneration are copper, iron and zinc3. They are thought to be involved in many disease pathways where by dyshomeostasis can have adverse affects. For example the metal status of superoxide dismutase (SOD) directly impacts the life span and phenotype of the transgenic mice models of familial type of amyotrophic lateral sclerosis (ALS)4. In Alzheimer's disease, metalloproteomics techniques have been used to discover a decrease in the metal status of transferrin in plasma5. These studies highlight the important role metalloproteins can play in disease.
The study of metalloproteins directly from biological tissues is a developing field. Although some metalloenzymes have been characterized, the majority still remain uncharacterized or unknown6. One of the major challenges in measuring metalloproteins is the requirement to maintain the native state of the protein7. Classical bottom-up proteomic techniques rely on the digestion of the proteins into peptides. This process disrupts the non-covalent interaction of metals and their proteins. Thus, no information about the metal status of a protein is gained.
One way to overcome this issue is by using size exclusion chromatography paired with inductively coupled plasma - mass spectrometry8,9 (SEC-ICP-MS). This generates information about the protein's approximate size as well as any metals that are associated with it10. Further, size exclusion is a gentle chromatographic technique that can preserve the native state of an enzyme or protein-protein complex. One advantage of using inductively coupled plasma - mass spectrometry (ICP-MS) is the quantitative nature of the technology. Using a set of metalloproteins standards it is possible to provide absolute quantitation of metalloproteins from biological samples9,11. This is achieved by generating a standard curve by injecting known metalloproteins over a range of metal concentrations.
This protocol shows an example of how this can be achieved for a variety of metalloprotein standards. In this paper we aim to create standard curves for metals that are largely investigated in biological fields including iron (Fe), copper (Cu), zinc (Zn), iodine (I), and cobalt (Co).
Protocol
1. Preparation of Buffers and Samples
- Prepare 500 ml of buffer, 200 mM ammonium nitrate pH 7.6 - 7.8 (pH adjusted with ammonium hydroxide (NH4OH)) with cesium (Cs) and antinomy (Sb) added to a final concentration of 10 ppb. Use cesium and antinomy as internal standards to monitor for any drift in the response of ICP-MS. Filter buffer prior to use through a 0.22 μm filter.
- Prepare sample depending on the type of sample: liquid, tissue or cell culture.
- For samples that require homogenization (e.g., tissue or cells), ensure that they do not contain detergent. Use Tris buffers for sample preparation. Alternatively, use phosphate buffers but they can negatively affect the metalloproteome over time or with freeze thaw cycles12.
- Homogenize tissue or cell culture samples by manual dounce or sonication for 5 min using Tris buffered saline (50 mM Tris pH 8.0, 150 mM sodium chloride (NaCl) + ethylenediaminetetraacetic acid (EDTA) free protease inhibitors).
- Clarify homogenates by centrifugation at 16,000 x g for 5 min. Collect the resulting supernatant. Keep samples at 4 °C.
Note: All samples must be centrifuged prior to loading into the high performance liquid chromatography (HPLC) vials to prevent particulates from blocking the size exclusion chromatography (SEC) column.
- Normalize the total amount of protein loaded on the column across the samples. Determine protein concentrations at 280 nm using a micro volume UV spectrophotometer13. Load between 20 and 150 µg protein. Use typical injection volumes ranging from 2 - 80 µl depending on the sample concentration.
- Clean the sample arm of the micro volume UV spectrophotometer with distilled water before sample loading. The sample arm is where the protein samples are loaded.
- Blank the instrument against 2 µl of the sample buffer. Then, load 2 µl of each sample onto the arm and measure the absorbance at 280 nm.
- Determine the concentrations. For crude protein samples, use an extinction coefficient of 1 Abs = 1 mg/ml. To determine the concentration of protein in the samples, use the Beer-Lambert Law, A = ε x l x c, where A is the absorbance, ε is the extinction coefficient, l is the path length in centimeters and c is the concentration.
2. Bulk Analysis of Metalloprotein Standards Using Inductively Coupled Plasma - Mass Spectrometry
- Warm-up and tune the instrument using manufacturer's protocols.
- Once instrument is warmed up and tuned, perform bulk ICP-MS.
Note: Stock solutions of purified metalloproteins generally need to be diluted before measurement. The metal concentration of the standard can be estimated from the known protein:metal stochiometries and the estimated protein concentration. This information can be used to determine the dilution that will be appropriate to fall within the range of the standard curve generated.- Dilute metalloprotein standards, thyroglobulin, ferritin, ceruloplasmin, Cu/Zn SOD and Vitamin B12, to ensure they fall within the range of 0 - 500 µg/L, using 1% nitric acid. To achieve standards within this range, do not use dilutions exceeding 1 in 20. Perform serial dilutions in water to dilute the stocks prior to this if required.
- Set up the order of injections. First, analyze the seven calibration levels, concentrations ranging from 0 - 500 µg/L, followed by the metalloprotein standards. The seven calibration levels are 0, 1, 5, 10, 50, 100 and 500 µg/L.
- Select elements of interest. Here, use Fe, Cu, Zn, Co and I, as they are the elements that the protein standards are bound to. Select the elements in the acquisition method by opening the element selector tab and adding the elements and their respective isotope masses that are to be analysed.
- Perform sample analysis with the instrument and the instrument software automatically creates the calibration curves for each of the elements being analyzed. The calibration curves are created by the software by plotting the counts/sec of the metal detected against the amount of metal that the standard is meant to contain, in µg/L. Use the calibration curves to determine the concentration of metal in the unknown samples.
Note: Using the calibration curve, the software determines the concentration of metal in each of the metalloprotein standards. - From the bulk analysis results, generate metalloprotein standards that include the three most abundant trace elements in mammalian tissues using a mixture of Cu, Zn superoxide dismutase (SOD) diluted to 200 µg/L of copper and zinc and ferritin (FTN) at a final concentration of 2,000 µg/L of iron.
3. HPLC System Setup and Size Exclusion Chromatography Column Equilibration
Note: This section should be performed in parallel to the previous, since they both required about 1 - 1.5 hr to complete.
- Purge HPLC pumps with buffer made in step 1.1 and purge the pumps for 5 min at a flow rate of 5 ml/min.
- Once the system is purged, set the flow rate at 0.1 ml/min and connect the size exclusion column (4.6 x 300 mm, 3 µm, 150 Å).
Note: A wet connection between the tubing and the column avoids any air bubbles being trapped during connection of the column. - Connect the opposite end of the column to the UV detector set to measure absorbance at 280 nm using PEEK tubing.
- Gradually increase the flow rate of the column in increments of 0.05 - 0.1 ml/min until a final flow rate of 0.4 ml/min is reached. While this is occurring, check the tubing connections to the column for any leaks. Monitor the pressure of the system to ensure it does not exceed the column requirements by observing the pressure trace on the chromatogram in the software.
- Leave the column to equilibrate at the required flow rate over 5 - 10 column volumes. After it is equilibrated, connect the instruments to allow sample analysis to occur.
- Set up the HPLC method up to pump buffer A over the column at 0.4 ml/min for 15 min.
4. Setting Up and Running Size Exclusion - Inductively Coupled Plasma - Mass Spectrometry
Note: Operating procedures may vary between instruments and models. Contact the instrument technical specialist to learn more about how to configure the ICP-MS being used.
- Place the ICP - MS into standby mode before changing the hardware setting.
- Once in standby mode, turn off the communication for the auto sampler and change the sample introduction to "other".
Note: Depending on the software and hardware configuration selecting "HPLC" as a sample introduction source can be used. Contact the instrument technical specialist to learn if this option is available.
- Once in standby mode, turn off the communication for the auto sampler and change the sample introduction to "other".
- Use PEEK tubing (ID 0.13 mm) to connect the out flow from the UV detector directly to the nebulizer on the ICP-MS.
- Power back up the ICP - MS and allow the instrument to warm up for 10 - 20 min.
- After the plasma has ignited, connect the remote cable from the ICP - MS to the back of the HPLC autosampler. Do this once the plasma has ignited; otherwise the HPLC system will automatically shut down since the ICP - MS is not on.
- Change the ICP-MS method to collect data for LC-ICP-MS.
- Alter the acquisition method from spectrum to time resolve acquisition (TRA).
- Select the elements to be analyzed, Fe, Cu, Zn, Co, I as well as any other elements of interest, and set integration times (typically between 0.05 - 0.3 sec). After the elements of interest are chosen, adjust the acquisition time to match the run time for the chromatography (e.g., 900 sec for a 15 min chromatography run).
- Manually tune the ICP - MS for sensitivity and collision cell helium (He) gas flow rates with the chromatography buffer flowing using Cs and Sb included in the buffer. The He flow rates are typically ~1 ml/min less than those used for bulk analysis. Once the metal ion counts have stabilized and relative standard deviation (RSD) values are below 5%, the system is ready to use.
- Make sample run lists in both the HPLC and ICP-MS software programs. The sample run list contains the order in which each of the samples is to be injected as well as the name by which the data will be saved. Check that the total number of samples in the list match between the two programs.
- Start the sample batch for the ICP-MS before the HPLC, as the injection of the sample by the HPLC will trigger the ICP - MS to start collecting data. If this is not done in the correct order it will result in missing data.
- Generate calibration curve points by injecting varying volumes of the SOD and FTN mixed standard from 200 µg/L to 6,000 µg/L injected on column for Cu & Zn and 2,000 µg/L up to 60,000 µg/L for Fe. Injection volumes range from 1 to 30 µl.
Note: These concentration ranges encompass the concentrations of Fe, Cu and Zn typically observed in complex homogenates. For samples that contain only purified proteins the maximum range of the curve should be adjusted accordingly. As the amount of metal associated with the protein may require a smaller or larger range since there is less contamination in the sample from other factors. - Analyze each of the unknown samples tissue, plasma or cell culture.
5. Data Analysis, Manipulation and Visualization
- Store the data in the comma separated value (csv) file format and load into processing programs as required.
- In order to control for instrument drift, divide the counts per second for each element by the counts per second for either Cs or Sb.
- Generate calibration curves for each of the elements.
- Determine the area under the metal peak that corresponds to the metalloprotein that it is bound to for each of the injections by performing peak integration in the preferred data analysis software.
- Plot the area under the metal peak against the total amount of the metal that was injected onto the column in each run, 200 - 6,000 µg/L for Cu and Zn and 2,000 - 60,000 µg/L for Fe. Perform linear regression analysis according to the software protocol.
- Use the slope results from the linear regression analysis as a factor to convert counts per second to pg/sec. Divide each of the counts per second data points across the chromatogram by the gradient of the line value.
- Graph the data in pg/sec against the chromatogram time. Determine the area under the peaks of interest. The area under the peak represents the total amount of metal that the protein is bound to, in pg.
- Generate a calibration based on the molecular weight of the known metalloproteins and the time at which they elute. Use this to estimate the size of the protein peaks in complex samples.
Results
The use of metalloprotein standards allows for the calibration of the size exclusion column. Figure 1A shows the elution profile for the standards thyroglobulin, ferritin, ceruloplasmin, Cu/Zn SOD and Vitamin B12 based on the metal that they are bound to (Fe, Co, Cu, Zn and I). Figure 1B shows the calibration curve for the size exclusion column based on the molecular weight of protein standards and their elution time, presented in the format of elution volume (Ve) divided by the void volume of the column (Vo). The proteins used to generate this standard curve are concanavalin A, conalbumin, ceruloplasmin, ferritin, SOD and thyroglobulin.
Figure 2A shows the elution of ferritin over a range of 2,000 - 60,000 pg of Fe injected on column and Figure 2D is the regression analysis performed using peak area. Figures 2B and 2C are the elution profiles for Cu/Zn SOD for Cu and Zn and 2E and 2F are the regression analyses generated using peak areas. The results of the regression analysis are used to convert the raw data in counts/sec to pg/sec so the amount of metal associated with the protein can be determined quantitatively. The conversion is done by dividing the counts/sec by the slope of the linear regression (e.g., 334.6 (counts/sec) x (sec/pg) of copper).
As stated, this technique can be used to identify metalloproteins in complex biological samples. Human brain and plasma have been subjected to this technique and Figures 3 and 4, respectively, show the results obtained. Human brain separated by SEC-ICP-MS is shown in Figures 3A-3C, each of which represent a different metal of interest (Cu, Zn or Fe). Figures 4A-4C show the traces obtained when human plasma is subjected to this technique. The complexity and abundance of the sample will impact the number of peaks that are seen. As expected plasma is dominated by a few metalloproteins including ceruloplasmin and transferrin.
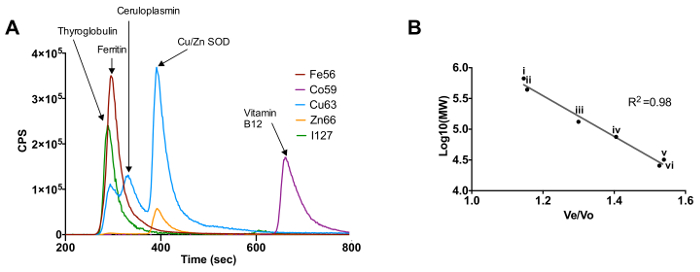
Figure 1. Calibration of Size Exclusion Chromatography - Inductively Coupled Plasma - Mass Spectrometry Using Known Metalloproteins. (A) Elution profile for the metalloprotein standards based on their respective metals. (B) Molecular weight calibration curve for protein standards thyroglobulin (i), ferritin (ii), ceruloplasmin (iii), conalbumin (iv), Cu/Zn SOD (v) and concanavalin A (vi). Please click here to view a larger version of this figure.
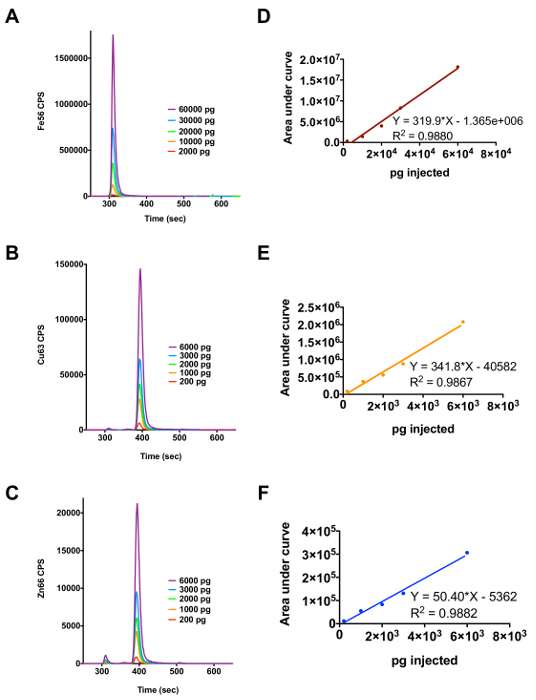
Figure 2. Use of Ferritin and Cu/Zn SOD as Metalloprotein Standards to Determine the Amount of Cu, Fe or Zn Associated with Metalloproteins in a Complex Biological Sample. (A) Elution profile for ferritin over the injection range 2,000 - 60,000 µg/L of iron. (B) and (C) Elution profile for Cu/Zn SOD over the injection range of 200 - 6,000 µg/L of copper and zinc, respectively. (D), (E) and (F) show the regression analysis results for the metals iron, copper and zinc, respectively. Please click here to view a larger version of this figure.
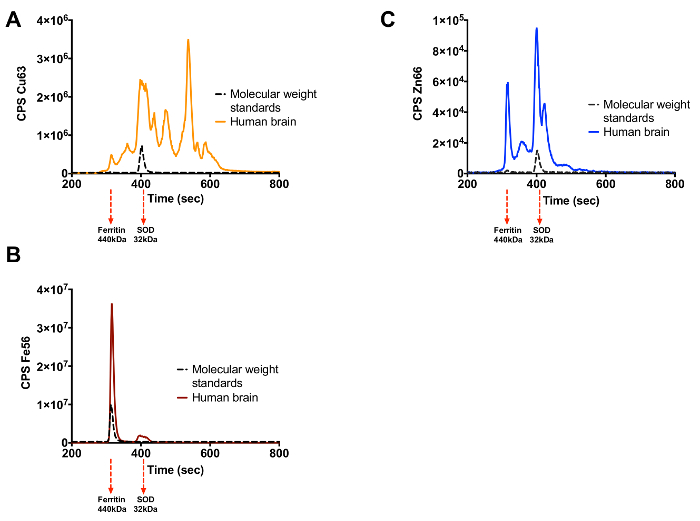
Figure 3. Cu, Fe and Zn Metalloproteome of Human Brain. (A) Copper trace (B) Iron trace (C) Zinc trace. Elution of the protein standards for each metal is shown by the black trace with their molecular weight indicated under the graph. Please click here to view a larger version of this figure.
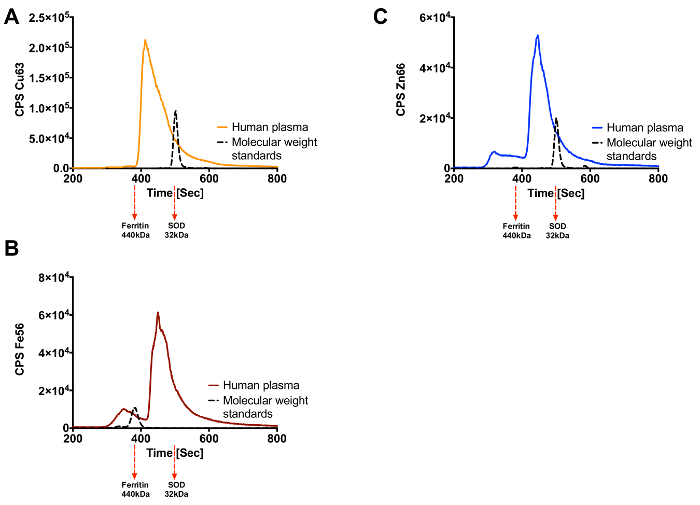
Figure 4. Cu, Fe and Zn Metalloproteome for Human Plasma. (A) Copper trace (B) Iron trace (C) Zinc trace. Elution of the protein standards for each metal is shown by the black trace with their molecular weight indicated under the graph. Please click here to view a larger version of this figure.
Discussion
Ensuring the native state of the protein means special attention to the buffers used and storage of the sample are needed. Not all chromatography techniques or sample preparation techniques can be employed. It is important that the buffers used throughout sample preparation and chromatography are devoid of metal chelators and use buffers that mimic physiological pH and salt concentrations. Other conditions to avoid include heating the sample or addition of protein denaturants (e.g., urea). It is critical to minimize the number of freeze thaw cycles. The ability of the chosen buffer to bind divalent metals is also important and is a reason that Tris or ammonium nitrate buffers are chosen over phosphate based buffers.
The low resolution and peak capacity of the size exclusion chromatography relative to other forms of chromatography is a major limitation of this technique. However, the gentle nature of size exclusion chromatography is important to maintain the native state of the protein and thus preserve the relatively weak metal-protein bonds. The requirement to maintain the native state of the proteins requires special attention to the treatment of the samples including limiting the number of freeze thaw cycles, avoiding metal chelators (e.g., EDTA) or chaotropic salts and detergents.
This low resolution of this technique impacts the ability to quantify the amount of metal associated with a specific protein if it is in a complex sample as the peaks seen will contain more then one protein. Therefore, the amount of metal determined using the peak integration would be an indication of the total amount of metal associated with all of the proteins eluting at this time point and not just one specific protein. In order to overcome this limitation the protein of interest would have to be further purified under native conditions. This would allow for the quantification of the metal associated with this protein to be reported with a higher degree of certainity. Another potential limitation of this technique would be the loss of protein due to non reversible binding to the column. In order to determine if this is happening a recovery experiment should be carried out whereby the amount of protein eluting off the column is analysed to determine if this matches the amount injected. The same can be done by measuring the metal content of the elution material and the starting material by bulk ICP-MS. Column recovery can differ depending on the conditions used, but it has been shown that complete recovery of proteins from a size exclusion column is possible9. Thus it is important to check whether or not there is any loss under the operating conditions being used.
Modifications to the protocol can be related to the metalloprotein standards that are used as well as the elements analyzed. The type of metalloprotein standard used will differ depending on the elements that are of interest. For elements such as Cu, Fe and Zn proteins, SOD and ferritin are employed. Any other metalloprotein that have known stoichometries can also be used and a few examples have been shown here.
One major complication that can arise from using this technique is the build up of salt crystals in the torch of the ICP-MS. To prevent the build-up of salt crystals, the torch is washed with distilled water after every 500 - 1,000 ml of buffer that has been passed through the system or when it is determined by visual inspection that the torch should be washed. Another problem that can arise is a more rapid decline in the cleanliness of the sample and extraction cones. These need to be cleaned regularly following manufacturer's protocols.
The initial sample preparation is the most critical step in the protocol. If there are any changes to the protein - metal complex the information generated will not be valid. This is one of the major limitations of the technique; in addition the use of the low resolution, size exclusion column yields a limited detailed view of the true complexity of metalloproteins in biology.
The technique described here allows the expansion of knowledge of the metalloproteome of an organism. Bulk analysis only gives a crude indication of changes to the amount of metal within a sample. Besides the general considerations that need to be taken into account, this technique provides a tool that can be used to quantitate the amount of metal associated with proteins as well as identifying metalloproteins that differ by comparing the traces obtained. The use of this technique can be employed to identify differences between disease states. The identified metalloproteins can then be further investigated to help determine the role they play in disease processes. The application of hyphenated ICP-MS has a growing future to determine the role of drugs that have a heteroatom such as platinum, iodine or copper as the ICP-MS can be used to identify the proteins that the drug binds.
Disclosures
The authors have nothing to disclose
Acknowledgements
We would like to acknowledge support from Victorian Government's Operational Infrastructure Support Program, the Australian Research Council Linkage Projects Scheme (with Agilent Technologies), the Australian National Health and Medical Research Council, the Victorian brain bank, Cooperative Research Centre for Mental Health and the Neuroproteomics facility.
Materials
| Name | Company | Catalog Number | Comments |
|---|---|---|---|
| Agilent 1290 Infinity Binary Pump | Agilent | G4220A | |
| Agilent 1290 Infinity Autosampler | Agilent | G4226A | |
| Agilent 1200 Series Autosampler Thermostat | Agilent | G1330B | |
| Agilent 1290 Infinity Thermostatted Column Compartment | Agilent | G1316C | |
| Agilent 1290 Infinity Variable Wavelength Detector | Agilent | G1314E | |
| Agilent 7700 ICP-MS | Agilent | G3282A | |
| Ammonium hydroxide trace metal basis | Sigma | 338818 | |
| Ammonium nitrate | Sigma | 256064 | Make fresh 200mM solution on day of experiment |
| Antinomy | Choice analytical | 10002-3 | |
| Ceruloplasmin | Sigma | ||
| Cesium | Choice analytical | 100011-1 | |
| Complete, EDTA free protease inhibitors | Roche | 11873580001 | |
| Conalbumin | Sigma | C7786 | |
| Concanavalin A from Canavalia ensiformis (Jack bean) | Sigma | L7647 | |
| Cu, Zn Superoxide dismutase | Sigma | S9697 | |
| Ferritin | Sigma | F4503 | |
| ICP-MS multielemental calibration standards | AccuStandard | Made up to required concentrations in 1% nitric acid | |
| Microvolume UV spectrophotometer | Thermo Scientific | ||
| 65% Nitric acid | Millipore | 100441 | Diluted to 1% for use |
| Peek tubing | Agilent | 5042-6461 | |
| Size exclusion column BioSEC-3 PLC. column, 4.6 x 300 mm, 3 μm, 150 Å | Agilent | 5190-2508 | |
| Sodium Chloride | Chem Supply | SA046 | |
| Tris Hydrochloride | ICN Biomedicals inc. | 103130 | |
| Thyroglobulin | Sigma | T9145 | |
| Vitamin B12 | Sigma | V2876 |
References
- Holm, R. H., Kennepohl, P., Solomon, E. I. Structural and Functional Aspects of Metal Sites in Biology. Chem Rev. 96, 2239-2314 (1996).
- Andreini, C., Bertini, I., Cavallaro, G., Holliday, G., Thornton, J. Metal ions in biological catalysis: from enzyme databases to general principles. J Biol Inorg Chem. 13, 1205-1218 (2008).
- Roberts, B. R., Ryan, T. M., Bush, A. I., Masters, C. L., Duce, J. A. The role of metallobiology and amyloid-beta peptides in Alzheimer's disease. J Neurosci. 120 (Suppl 1), 149-166 (2012).
- Roberts, B. R., et al. Oral Treatment with CuII (atsm) Increases Mutant SOD1 In Vivo but Protects Motor Neurons and Improves the Phenotype of a Transgenic Mouse Model of Amyotrophic Lateral Sclerosis. J Neurosci. 34, 8021-8031 (2014).
- Hare, D. J., et al. Decreased plasma iron in Alzheimer's disease is due to transferrin desaturation. ACS CHEM NEUROSCI. , (2015).
- Cvetkovic, A., et al. Microbial metalloproteomes are largely uncharacterized. Nature. 466, 779-782 (2010).
- Barnett, J., Scanlan, D., Blindauer, C. Protein fractionation and detection for metalloproteomics: challenges and approaches. Anal Bioanal Chem. 402, 3311-3322 (2012).
- Fernandez Sanchez, L., Szpunar, J. Speciation analysis for iodine in milk by size-exclusion chromatography with inductively coupled plasma mass spectrometric detection(SEC-ICP MS). J. Anal. At. Spectrom. 14, 1697-1702 (1999).
- Manley, S., Byrns, S., Lyon, A., Brown, P., Gailer, J. Simultaneous Cu-, Fe-, and Zn-specific detection of metalloproteins contained in rabbit plasma by size-exclusion chromatography-inductively coupled plasma atomic emission spectroscopy. J Biol Inorg Chem. 14, 61-74 (2009).
- Richarz, A. N., Brätter, P. Speciation analysis of trace elements in the brains of individuals with Alzheimer's disease with special emphasis on metallothioneins. Anal Bioanal Chem. 372, 412-417 (2002).
- Hare, D. J., et al. Profiling the iron, copper and zinc content in primary neuron and astrocyte cultures by rapid online quantitative size exclusion chromatography-inductively coupled plasma-mass spectrometry. Metallomics. 5, 1656-1662 (2013).
- Balkhi, S. E., et al. Human Plasma Copper Proteins Speciation by Size Exclusion Chromatography Coupled to Inductively Coupled Plasma Mass Spectrometry. Solutions for Columns Calibration by Sulfur Detection. Anal Chem. 82, 6904-6910 (2010).
- Desjardins, P., Hansen, J. B., Allen, M. Microvolume Protein Concentration Determination using the NanoDrop 2000c Spectrophotometer. J Vis Exp. , e1610(2009).
Reprints and Permissions
