Hematopoietic stem and progenitor cells (HSPC) derive from specialized (hemogenic) endothelial cells during development, yet little is known about the process by which some endothelial cells specify to become blood forming. We demonstrate a flow-cytometry based method allowing simultaneous isolation of hemogenic endothelial cells and HSPC from murine embryonic tissues.
Method Article
Isolation of Murine Embryonic Hemogenic Endothelial Cells
* These authors contributed equally
In This Article
Summary
Abstract
The specification of hemogenic endothelial cells from embryonic vascular endothelium occurs during brief developmental periods within distinct tissues, and is necessary for the emergence of definitive HSPC from the murine extra embryonic yolk sac, placenta, umbilical vessels, and the embryonic aorta-gonad-mesonephros (AGM) region. The transient nature and small size of this cell population renders its reproducible isolation for careful quantification and experimental applications technically difficult. We have established a fluorescence-activated cell sorting (FACS)-based protocol for simultaneous isolation of hemogenic endothelial cells and HSPC during their peak generation times in the yolk sac and AGM. We demonstrate methods for dissection of yolk sac and AGM tissues from mouse embryos, and we present optimized tissue digestion and antibody conjugation conditions for maximal cell survival prior to identification and retrieval via FACS. Representative FACS analysis plots are shown that identify the hemogenic endothelial cell and HSPC phenotypes, and describe a methylcellulose-based assay for evaluating their blood forming potential on a clonal level.
Introduction
A functional circulatory system requires the parallel development of blood vessels and blood cells. At the earliest stages of blood development (primitive hematopoiesis), the origin of erythroblasts remains vigorously debated1. In contrast, at later stages of blood cell development (definitive hematopoiesis), it has become increasingly clear that multi-lineage HSPC arise from specialized vascular endothelial cells that acquire blood forming potential (hemogenic endothelial cells) within the yolk sac, placenta, and AGM2-5, as well as in the vitelline and umbilical vessels, the embryonic endocardium6, and head vasculature7. The specification of hemogenic endothelial cells within these distinct tissues occurs at specific stages of development; for example, within the yolk sac at ~E8.25 and within the AGM at ~E108-12. Nonetheless, even during these specific developmental windows, the population of hemogenic endothelial cells represents a small fraction of all endothelial cells (1 - 3% of yolk sac and AGM endothelial cells)11,12. The process of hemogenic endothelial cell "specification" is critical for murine, as well as human, hematopoiesis. Hematopoietic cells have been shown to bud from the endothelium of yolk sac vessels and the aorta in human embryos13, and several labs have demonstrated that blood cell production from human pluripotent stem cells requires an endothelial cell intermediate14-16. Thus, defining the phenotype of murine hemogenic endothelial cells and understanding the molecular events that lead to their development in this animal model should facilitate pursuit of in vitro technologies for generation of hemogenic endothelial cells from human pluripotent stem cells. In turn, the eventual development of an approach for large-scale generation of differentiated blood cell types from multi-lineage HSPC — themselves derived from human pluripotent stem cells via a physiologically relevant hemogenic endothelial cell intermediate — would have incredible therapeutic potential for hematologic, oncologic and regenerative medicine. Towards this goal, we have defined the phenotype of hemogenic endothelial cells, on a clonal level, within the murine yolk sac11 and AGM12, two major sites of definitive HSPC production during embryogenesis. Like HSPC within adult bone marrow17, embryonic hemogenic endothelial cells and HSPC exhibit Hoechst dye efflux properties and therefore appear within the "side population" (SP) of cells on a FACS plot5,11,12 (as shown in Figure 3). In addition, we have also shown that hemogenic endothelial cells express markers of both endothelial and stem cells (Flk1 and cKit, respectively), but do not express the hematopoietic lineage marker, CD455,11,12. Thus, hemogenic endothelial cells can be identified and isolated by FACS as Flk1+/cKit+/CD45- SP cells, and we have shown that these cells give rise to HSPC contained within the Flk1-/cKit+/CD45+ SP fraction of yolk sac and AGM cells5,11,12. Hemogenic endothelial cells and HSPC can be identified and isolated from yolk sac or AGM tissues harvested from either freshly euthanized embryos, or from embryos cultured for up to 48 hours in ex vivo embryo culture (as depicted in Figure 1). Ex vivo culture permits selective pre-treatment of individual embryos with pharmacological agents, and also allows for transient expression of desired transgenes (i.e., by lentiviral transduction). FACS identification of hemogenic endothelial cells and HSPC by the method described herein can be used as a quantitative measure of definitive hematopoietic development in genetically manipulated mouse models; the cells can also be retrieved for subsequent experimental applications, including blood-forming assays, expression analysis, and transplantation.
Animal Subjects: Uses and Ethical Considerations
A growing body of literature has established the important contribution of hemogenic endothelial cells to HSPC formation during the definitive hematopoiesis stage of embryonic development. Yet, the physiological conditions and signals that promote specification of a subpopulation of endothelial cells towards a hemogenic fate remain poorly understood, and therefore cannot yet be mimicked in an in vitro setting. Indeed, the techniques described in this paper are currently in use by our lab and other groups to improve the field's understanding of hematovascular development, such that an approach for ex vivo hemogenic endothelial cell specification and HSPC production might one day be developed. Until such time, however, the field remains dependent upon primary tissues from wild-type (and genetically modified) mouse embryos to obtain specified hemogenic endothelial cells and HSPC for further study. Hemogenic endothelial cells and HSPC can be reliably identified and isolated from either E8.5 (10 - 12 somite pairs) yolk sac or E10.5 (35 - 40 somite pairs) AGM11,12. Due to the relative scarcity of hemogenic endothelial cells (typically representing 1 - 3% of total endothelial cells11,12 within these tissues) the pooling of tissues from multiple (~8 - 10) littermates into a single sample is strongly recommended in order to obtain sufficient cells for subsequent experimentation. Verification that hemogenic endothelial cells and HSPC have been successfully identified and isolated can be accomplished by culture of retrieved cells under conditions that induce hematopoietic differentiation. Under these conditions, hemogenic endothelial cells and HSPC will exhibit multi-lineage hematopoietic differentiation, resulting in the appearance of colonies containing erythroid progenitors (BFU-E), granulocyte and macrophage progenitors (CFU-GM), and granulocyte, erythrocyte, macrophage, megakaryocyte progenitor colonies (CFU-GEMM).
Protocol
Ethics Statement: The protocol outlined below has been reviewed by, and is in compliance with the guidelines of, Yale University's Institutional Animal Care and Use Committee.
1. Whole Embryo Ex Vivo Culture for Yolk Sac Studies (Optional)
- Euthanize pregnant dams at E7.0 - E7.5, and remove uterine horns under sterile conditions, as described in greater detail below (steps 2.4 - 2.7).
- Separate whole embryos (with yolk sac intact12) from surrounding decidua, and suspend in 50 ml whole rat serum in 50 ml polystyrene tubes.
- Gas embryo bottles for 3 min with 5% CO2 immediately as previously described12,18. Repeat this step at 24 hr if culturing embryos for 24 - 48 hr.
- Incubate in rolling 37 °C culture for up to 48 hr.
Note: Embryos can be treated ex vivo with pharmacological agents (i.e., Notch inhibitor DAPT12) or soluble proteins (i.e., fibronectin19) through pre-incubation of embryos for up to 2 hr in culture medium containing such factors, or through addition of those factors to the rolling culture medium for the entire length of the ex vivo culture period. Gene expression can be manipulated in embryos by pre-incubation of embryos with optimally titered lentivirus for 2 hr12. Yolk sac vascular and hematopoietic development can be monitored in real time using transgenic reporter mice and optical imaging techniques.
2. Dissection of Yolk Sac (YS) or Aorta-gonad-mesonephros (AGM) from Mouse Embryos
- Sterilize lab bench by spraying and wiping down all surfaces with 70% ethanol to reduce contamination in subsequent cell cultures. Place an absorbent underpad on lab bench surface.
- Sterilize surgical instruments with 70% ethanol. Recommended surgical instruments are two #5 straight forceps, and one 8.5 cm straight scissors.
- If working with embryos from ex vivo culture, carefully remove whole embryos from 50 ml Falcon tubes and proceed immediately to step 2.8. Otherwise, skip this step and proceed to step 2.4.
- Euthanize pregnant dam at appropriate embryonic age (E8.5 if harvesting YS; E10.5 if harvesting AGM).
Note: The described technique employs a dual-method euthanasia approach — lethal dosage of a volatile anesthetic followed by mechanical cervical dislocation — to minimize animal pain and distress, and to ensure minimally invasive and humane termination of animal subjects. This combined technique for small rodent euthanasia is recommended by the American Veterinary Medical Association when performed by a trained and proficient investigator (AVMA Guidelines for the Euthanasia of Animals: 2013 Edition).- Anesthetize mouse using a lethal dose of isoflurane (>5% in O2) for 3 - 5 min. (CAUTION: Isoflurane is a toxic inhalant; use under a chemical fume hood with appropriate respiratory personal protective equipment.)
- Following exposure of mice to isoflurane, check at least three signs of anesthetic level — loss of righting reflex, loss of toe pinch reflex, and reduction of respiratory rate — to ensure subjects have achieved a deep anesthetic plane prior to proceeding with mechanical euthanasia.
- Cervically dislocate dam to rapidly induce death.
- Place euthanized dam supine on underpad and liberally spray lower abdomen with 70% ethanol.
- Make a vertical incision along the midline of the lower abdominal wall. Make additional ~1 inch horizontal incisions extending right and left from the midpoint of the vertical incision, and dissect away the abdominal wall to fully expose right and left uterine horns each containing multiple gestating embryos.
- Using forceps, hold one of the two uterine horns and use scissors to separate it from the mesometrium. Place dissected uterus on ice in sterile Hank's Balanced Salt Solution (HBSS) in a 60 mm polystyrene tissue culture plate. Repeat for other uterine horn.
- Under a standard light dissecting microscope, use forceps to pull away muscular layer of uterine sac to reveal the underlying gestational sac and decidua. Isolate YS (Figure 2A) by gently removing the sac from the enclosed embryo. Remove YS tissue from embryo proper at the embryonic origin of vitelline vessels.
- To isolate the AGM, remove the YS and transect the embryo below the level of the heart and forelimbs and discard the thorax and head region. Next, transect the embryo just below the level of the hindlimbs and remove and discard the tail tissue. Remove the hindlimbs and excess ventral tissue from the remaining section, which contains the AGM (Figure 2B).
- Pool YS or AGM tissues from multiple embryos and store on ice in HBSS+ (HBSS supplemented with 10% (v/v) fetal bovine serum and 100 U/ml Penicillin, 100 μg/ml Streptomycin, and 0.3 mg/ml L-glutamine) in a clean 1.5 ml tube.
3. Digestion of Primary Tissue into a Single Cell Suspension
- Centrifuge tube containing harvested YS or AGM tissues for 5 min at 2,000 x g at 4 °C.
- Remove supernatant and resuspend tissue in 1 ml of either 0.05% (for YS) or 0.2% (for AGM) collagenase type II diluted in HBSS+. Incubate for 30 min in water bath at 37 °C, inverting tube every 5 min to mix.
- Gently mechanically dissociate tissue by passing sample 10 times through a P1000 pipette. If having difficulty aspirating partially digested tissue, pipette tip bore may be widened by cutting off ~5 mm of tip with a pair of scissors.
- Centrifuge sample for 5 min at 2,000 x g at 4 °C. Remove supernatant and resuspend in 1 ml ice-cold HBSS+.
- Pass sample through a 70 μm cell strainer.
- Count cells using a manual or automated hemocytometer.
- Centrifuge sample for 5 min at 2,000 x g at 4 °C. Resuspend sample in DMEM+ (4.5 g/L glucose Dulbecco's Modified Eagle Medium supplemented with 10% (v/v) fetal bovine serum and 100 U/ml Penicillin, 100 μg/ml Streptomycin, and 0.3 mg/ml L-glutamine) pre-warmed to 37 °C such that cells are at a final concentration of 1 x 10⁶ cells/ml.
4. Treatment of Cells with Nucleic Acid Dye and Labeling with Fluorescently Conjugated Antibodies
- Aliquot at least 100 μl of sample (1 x 10⁵ cells) into fresh 1.5 ml tubes for antibody incubation.
- Include the following sample and necessary control tubes: Unstained; cKit-APC only; CD45-FITC only; CD31-PE only; Flk1-PECy7 only; Hoechst 33342 only; Hoechst 33342 only + Verapamil; Sample (receives all colors, will not receive Verapamil). Use a minimum of 1 x 10⁵ cells in 100 μl for control tubes.
Note: A larger volume of cells may be added to the Sample tube at the same concentration to maximize yield of sorted Hemogenic EC and HSPC. - Add Verapamil diluted in 95% ethanol (see Discussion for rationale) to the “Hoechst 33342 only + Verapamil” control tube to a final concentration of 50 μM. Incubate all tubes for 5 min at 37 °C. (CAUTION: Verapamil is a potent calcium-channel blocking agent and is extremely toxic. Handle with gloves).
- Add Hoechst 33342 to the “Hoechst 33342 only” control, to the Hoechst 33342 + Verapamil only control, and to the “Sample” tube to a final concentration of 5 μg/ml. Incubate all tubes for 1 hr at 37 °C, protected from light. Gently mix by inverting every 15 min. (CAUTION: Hoechst 33342 is a toxic nuclear dye and should be handled with gloves).
- Centrifuge all samples for 5 min at 2,000 x g at 4 °C. Remove supernatant and resuspend cell pellets at a concentration of 1 x 10⁵ cells/ml in cold HBSS+.
- Add fluorescently conjugated antibodies to appropriate antibody-only control tubes, and to the “Sample” tube to a final concentration of 2 μg/ml. Incubate on ice for 30 min, protected from light.
- Centrifuge all tubes for 5 min at 2,000 x g at 4 °C. Remove supernatant and resuspend cell pellet in 500 μl ice-cold HBSS. Strain samples through mesh filter cap of 5 ml round bottom polystyrene FACS tube and store on ice, protected from light, for immediate FACS.
5. Identification and Isolation of Hemogenic Endothelial Cells and HSPC by FACS
Note: This protocol was optimized using a BD FACSAria 5-laser system equipped with a 100 mw 355 nm UV laser, a 200 mw 405 nm Violet laser, a 200 mw 488 nm Blue laser, a 200 mw 532 nm Green laser, and a 150 mw 637 nm Red laser. Cells were sorted in sterile PBS as sheath fluid and under aseptic conditions, and through a 100 μm nozzle with flow rate set to a sample pressure of 1 such that a maximum of 1,500 - 2,000 events are acquired per second to minimize cell stress.
- Under these settings described above, use “Unstained” and single color control tubes to optimize FACS cell sorter laser intensities and perform multi-color spectral compensation control according to manufacturer’s instructions. Use forward and side scatter to perform live cell and doublet discrimination from total events (see manufacturer’s instructions for more details).
Note: This protocol typically results in ~70 - 80% viable cells. If problems are encountered with low cell viability, ensure that tissues are initially dissected quickly in ice cold media, and that all steps except those specifying otherwise are carried out on ice, with gentle pipetting to minimize shearing and cell death (see Discussion for greater detail on preserving cell viability). - Use a differential linear-scale plot of Hoechst Red vs. Hoechst Blue fluorescence to identify side population (SP) events (Figure 3A). Use “Hoechst 33342 only + Verapamil” control as a negative control to verify that gates are properly drawn for the sample. SP will appear as a shoulder to the left of the non-SP cells, and will be decreased in the Verapamil-treated control. The non-SP population will be used to identify non-hemogenic EC (Figure 3B).
- Create additional differential fluorescence plots (log-scale axes) and draw daughter gates of the SP to identify hemogenic endothelial cells (Figure 3C-E).
Note: Hemogenic endothelial cells are profiled as Flk1+/cKit+/CD45- SP cells (Figure 3D), and HSPC are Flk1-/cKit+/CD45+ SP cells (Figure 3E). Hemogenic endothelial cells can be analyzed in parallel with non-hemogenic endothelial cells, which are identified in this approach as CD31+/CD45- non-SP cells (Figure 3B). - Retrieve hemogenic endothelial cell or HSPC fraction onto methylcellulose containing plates for hematopoietic culture (see below), or into other buffers for subsequent processing and analysis.
6. Hematopoietic Differentiation in Culture
- Add 0.5 ml (135 μl/cm2) methylcellulose-based hematopoietic culture media to desired number of wells of a 24-well tissue culture plate at room temperature. Add 0.5 ml sterile water into unused wells to minimize evaporation. Prepare fresh and keep at room temperature until use.
- Sort 1 - 10 cells for clonal analysis, or up to 1,000 hemogenic endothelial cells (Flk1+/cKit+/CD45- SP cells) or HSPC (Flk1-/cKit+/CD45+ SP cells) for bulk expansion and differentiation directly into each well of the plate containing methylcellulose. Colony formation is detected in approximately 10 - 20%.
- In a sterile tissue culture hood, use a P1000 tip with the tip trimmed to widen its bore, to gently resuspend each well of the seeded methylcellulose media 2 - 3 times, taking care to avoid creation of bubbles. This ensures suspension of the sorted cells into the semisolid methylcellulose for optimal growth.
- Incubate plate at 37 °C with 5% CO2 for up to 2 weeks.
- Monitor single cell cultures for formation of differentiated hematopoietic cell colonies over time (Figure 4). Score wells for number and type of differentiated hematopoietic colonies at days 1, 3, 7, and 14 by method(s) outlined below in step 6.7.
- Score plates on day 1 to confirm confluency and continued viability of the sorted cells.
- By day 3, check for early formation of adherent hemogenic endothelial cell colonies with “cobblestone” morphology (see Goldie et al.11 and Marcelo et al.12 for representation of day 3 morphology).
- By days 5 - 7, check for formation of rounded HSPC clusters in wells containing sorted hemogenic EC. HSPC should be observed adjacent to flattened hemogenic EC displaying a “cobblestone” endothelial cell morphology.
Note: Hemogenic endothelial cells should form hematopoietic colonies (determined by hematopoietic colony number), and should demonstrate multi-lineage differentiation capacity (determined by observation of multiple colony types from a single cell). We have previously observed that ~20% of hemogenic EC or HSPC retrieved by FACS survive to form differentiating and proliferating hematopoietic colonies in methylcellulose11.
- To assess colony formation by phase microscopy:
- Visualize and count colonies at low magnification under a phase light microscope, and identify BFU-E, CFU-GM, and CFU-GEMM colonies by colony morphology, as described by Goldie et al.11.
- To assess colony formation by cell morphology:
- Aspirate individual colonies from methylcellulose surface into a P1000 tip with the end trimmed to widen bore. This facilitates aspiration of the viscous methylcellulose medium and ensures successful retrieval of the colony.
- Resuspend picked colonies into 200 ml HBSS and spin onto a glass slide using a cytocentrifuge at 28 x g for 5 min.
- Fix slides in 100% methanol for 5 min (CAUTION: Methanol is toxic and should only be used in a chemical hood with appropriate ventilation and personal protective equipment).
- Submerge slides in 0.04% Giemsa stain for 20 min (CAUTION: Giemsa stain contains methanol. Use in a chemical hood with appropriate ventilation and personal protective equipment).
- Rinse slides in deionized water.
- Mount slides with coverslips, and image at high magnification under a standard light microscope, comparing cell morphology to that classically observed in hematopoietic cells from adult bone marrow that are cultured in methylcellulose media. For examples, please see manufacturer’s instructions.
- To assess colony formation by cell expression of hematopoietic lineage markers by FACS:
- Add 2 ml of HBSS to each well of a 24-well plate containing colonies cultured on 0.5 ml methylcellulose (i.e., dilute commercially-available stock methylcellulose 1:4). Pipette up and down to mix, and transfer to fresh tube(s).
- Centrifuge sample at 2,000 x g for 5 min at 4 °C using a standard table-top microcentrifuge.
- Remove supernatant and resuspend cell pellet(s) in 1 ml HBSS+, pooling samples if so desired.
- Centrifuge sample at 2,000 x g for 5 min at 4 °C.
- Remove supernatant and resuspend cell pellet(s) in 400 μl HBSS+.
- Aliquot sample into four 1.5 ml tubes as follows: Unstained; B220-FITC only; GR-1-FITC only; Ter119-FITC only.
- Add fluorescently-conjugated antibody to appropriate tube to a final concentration of 2 μg/ml. Incubate at 37 °C for 15 min.
- Centrifuge sample at 2,000 x g for 5 min at 4 °C. Remove supernatant and resuspend cell pellet in ice-cold 0.5 ml HBSS.
- Analyze each sample by FACS for expression of each hematopoietic lineage marker: B220 marks B-cells 20; GR-1 marks myeloid cells 21; Ter119 marks erythroid cells 22.
Note: Additional antibodies targeting other hematopoietic lineage markers may be incorporated into this approach, if so desired.
Results
Successful labeling of hemogenic endothelial cells and HSPC from embryonic YS or AGM will yield FACS scatter plots similar to the representative plots presented in Figure 3. Following standard live cell and doublet discrimination by forward and side scatter (not shown), side population (SP) events are visualized in a linear Hoechst Red vs. Hoechst Blue differential plot in the absence of Verapamil as a "shoulder" left-shifted from the majority of (non-SP) events (Figure 3A). When the SP gate is properly drawn, SP cells will represent approximately 1 - 3% of total viable YS cells and 3 - 5% of total viable AGM events. Verapamil treatment should result in >50% inhibition of SP events regardless of tissue source (Figure 3A, top panels). We have previously determined that other populations that appear outside of the SP shoulder but are also blocked by verapamil are Ter119-positive erythroblasts, and are therefore excluded from our SP population5.
Compared to the SP, non-SP cells are identified as the dense cluster of cells adjacent to the SP "shoulder" (Figure 3A). This population contains non-Hemogenic EC which can be distinguished using a CD31-PE vs. CD45-FITC daughter plot (Figure 3B), as CD31+/CD45- events. Non-Hemogenic EC are typically 2 - 5% of non-SP cells from AGM (Figure 3B) or yolk sac (not shown), and high numbers of these cells can be sorted back with relative ease.
For identification of HSPC and Hemogenic EC, daughter gates are drawn from the SP fraction, identifying CD45+ and CD45- cells, where CD45+ cells are typically <20% of total events in both AGM (Figure 3C) or YS (not shown). Hemogenic EC are subsequently identified from CD45- cells in a differential cKit-APC vs. Flk1-PECy7 daughter plot as double-positive events, and typically represent 1 - 3% of CD45- events when isolated from either AGM (Figure 3D) or YS (not shown). HSPC are identified from the CD45+ fraction in a separate cKit-APC vs. Flk1-PECy7 daughter plot as Flk1-/cKit+ cells, and also typically represent approximately 25 - 30% of the small population of CD45+ cells when obtained from either YS (not shown) or AGM (Figure 3E). Thus, both Hemogenic EC and HSPC are exceptionally rare (~0.01% of total cell events), and it is typical for this protocol to return a few hundred of each cell type even when tissue from multiple embryos are pooled. Gates in daughter plots should be established with reference to negative control groups. In order to distinguish between specific and non-specific antibody staining, gates should be initially drawn in reference to both Unstained controls (Figure 3C), as well as samples that have been treated with fluorescently-conjugated isotype-matched (IgG2A or IgG2B) control antibodies (not shown). This latter control has demonstrated that non-specific staining is minimal by this protocol, therefore while we recommend that isotype-matched control antibodies (e.g., IgG2A-PE or IgG2B-FITC) be initially used to optimize FACS sorter settings and determine gate boundaries, we also find that unstained controls are sufficient to verify gate boundaries and experimental quality during routine FACS sorting. If gates are properly drawn, minimal positive scatter should be observed in single- or double-positive gates when recording from unstained or isotype-matched controls.
Hemogenic endothelial cells from the AGM and HSPC undergo hematopoietic differentiation over 14 days of culture in methylcellulose (Figure 4A). The relative proportion of colony types typically observed in these cultures is dependent upon tissue source. Hemogenic endothelial cells isolated from yolk sac tissues at E8.5-E9.5 give rise to BFU-E, CFU-GM, and few CFU-GEMM5, whereas hemogenic endothelial cells isolated from the E10.5 AGM give rise to predominantly CFU-GEMM12, although other lineages are still observed, as shown in Figure 4B (top left panel). HSPC isolated from E10.5 AGM also give rise predominantly to CFU-GEMM upon culture in methylcellulose (Figure 4B, top middle panel), although these cells will also differentiate into other hematopoietic colony types as well. Non-hemogenic endothelial cells (CD31+/CD45- non-SP) have also been plated (Figure 4B, top right panel). These cells demonstrate no growth in hematopoietic culture after 14 days.
Assays of hematopoietic capacity of individual surface marker expressing cell types, including cells with and without expression of hematopoietic and endothelial markers CD31, Flk1, c-Kit, VE-cad, CD41, and CD45 within the SP fraction of the AGM at E10.5 have been performed and demonstrate that multi-lineage colony forming activity in the E10.5 AGM is restricted to CD31+, VE-cadherin+, c-Kit+, CD41+ and CD45+ SP cells12. Interestingly, colony forming activity was noted in both Flk-1+ and Flk-1- SP cells, but only Flk1+c-Kit+CD45- SP cells gave rise to multi-lineage colonies via an endothelial monolayer intermediate characterized by both "cobblestone" endothelial cell morphology (Figure 4B, bottom left panel) and by Dil-AcLDL uptake12. Furthermore, expression of c-Kit is necessary for hematopoietic activity of AGM SP cells12.
While it has been shown that some myeloid progenitors have similar morphologic characteristics when compared to hemogenic endothelial cells, myeloid progenitor cells express CD45 and cannot generate multi-lineage colonies in vitro. HSPC also generate multi-lineage colonies, but although these cells CD45, they lack Flk-1 expression12,23 and give rise to rounded cell clusters without an underlying endothelial monolayer (Figure 4B, bottom right panel). Therefore, the population we define as hemogenic endothelium (or, Flk-1+/c-Kit+/CD45-SP cells) represent endothelial cells with blood forming potential and robust hematoendothelial gene expression, including GATA-1/2, Lmo2, SCL/Tal-1, Runx-1, c-Kit, CD34, CD41, and CD4511 that are distinct from hematopoietic stem and progenitor cells, as well as their non-hemogenic endothelial cell counterparts.
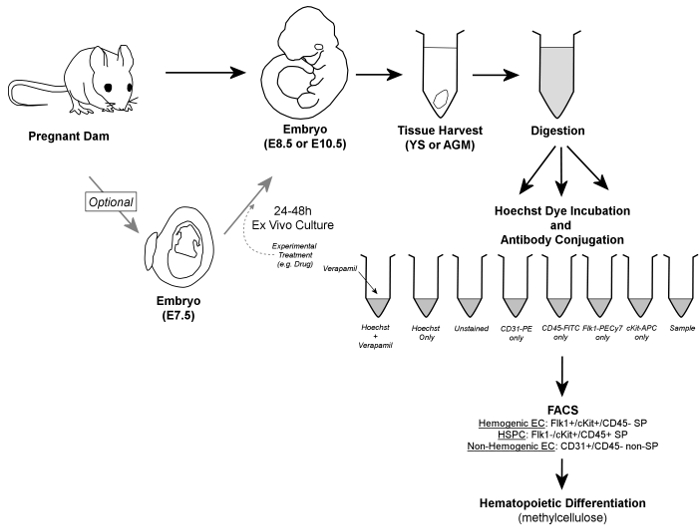
Figure 1. Overall Workflow. In brief, embryos are removed from pregnant dams, and YS or AGM tissues are harvested. Embryos may optionally be cultured for 24 - 48 hr ex vivo prior to tissue harvest. Harvested YS or AGM tissues are digested to a single cell suspension, aliquoted into control and sample tubes, and incubated in the presence of Hoechst dye and/or fluorescently-conjugated antibodies. Verapamil, a calcium channel inhibitor, is also used to generate a negative control essential for verification of accurate gating of the SP fraction. Hemogenic endothelial cells are identified by FACS as Flk1+/cKit+/CD45- SP cells, while HSPC are contained within the Flk1-/cKit+/CD45+ SP fraction of cells; both cell types are sorted onto methylcellulose for confirmation of hemogenic potential. Additionally, non-hemogenic endothelial cells can be discriminated (and retrieved, if so desired) as CD31+/CD45- non-SP cells. Please click here to view a larger version of this figure.
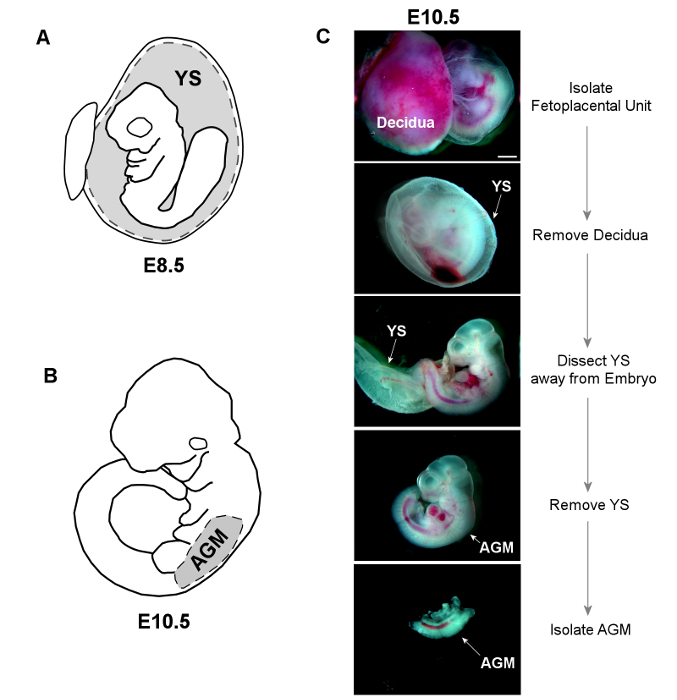
Figure 2. Dissection of YS and AGM Tissues. A) The YS is dissected away from E8.5 embryos, and placed whole into sterile HBSS+ for subsequent digestion. B) The trunk of E10.5 embryos is isolated by making horizontal cuts below both the forelimb and hindlimb buds. The AGM is then separated from the limb buds and ventral tissue using forceps. C) Bright-field images show dissection of both YS and AGM from an E10.5 embryo (scale = 1 mm). Please click here to view a larger version of this figure.
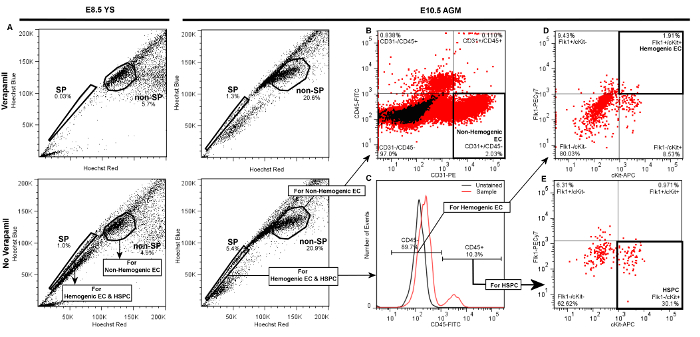
Figure 3. Representative Plots Demonstrating Gate Hierarchy for Discrimination of Hemogenic Endothelial Cells (Flk1+/cKit+/CD45- SP cells), HSPC (Flk1-/cKit+/CD45+ SP cells), and Non-hemogenic Endothelial Cells (CD31+/CD45- non-SP) by FACS from E8.5 YS or E10.5 AGM. Following live cell and doublet discrimination of cells from either YS (left panels) or AGM (right panels) by forward and side scatter (not shown), A) the side population (SP) gate is drawn and verified by a significant decrease of the SP fraction in the Verapamil-treated negative control. The non-SP population is identified as the dense cluster of cells adjacent to the SP. In each of the presented plots 20,000 events are displayed. B) Non-hemogenic endothelial cells are identified as CD31+/CD45- cells within the non-SP fraction, and represent 2 - 5% of non-SP cells whether obtained from AGM (shown) or YS (not shown). To discriminate Hemogenic EC or HSPC, C) daughter gates are drawn from the SP fraction to identify CD45+ and CD45- cells. D) For identification of hemogenic endothelial cells from either AGM (shown) or YS (not shown), additional daughter gates are drawn from the CD45- fraction to distinguish cKit+ (vs. cKit-) and Flk1+ (vs. Flk1-) cells. Hemogenic EC from either YS or AGM are typically ~1 - 3% of CD45- events. E) HSPC are identified from the CD45+ fraction as cKit+ and Flk1-, and typically represent 20 - 30% of CD45+ cells whether sorted from AGM (shown) or YS (not shown). Please click here to view a larger version of this figure.

Figure 4. Visualization of Hematopoietic Differentiation following Culture of Hemogenic Endothelial Cells and HSPC on Methylcellulose. A) Colonies form from sorted individual cells within 7 days of plating onto methylcellulose. Multi-lineage hematopoietic potential can be confirmed by observation of multiple hematopoietic colony types, identified by assessment of distinct colony morphologies11. B) Phase microscopic imaging of sorted hemogenic EC and HSPC from AGM (or YS, not shown) show multi-lineage hematopoietic colony formation after 7 days of culture in methylcellulose culture medium. Non-hemogenic EC from AGM (or YS, not shown) do not demonstrate growth under these conditions. At higher magnification, adherent cells with classical "cobblestone" endothelial cell morphology (white arrow) can be seen giving rise to clusters of hematopoietic cells in cultures of hemogenic EC; no such endothelial cells are observed in cultures of sorted HSPC (scale = 100 μm). Please click here to view a larger version of this figure.
Discussion
There remain many unanswered questions in the field of hematovascular development — a field that is still in its infancy due to the technical difficulties inherent in studying transient and small cell populations that emerge only during specific developmental windows. The techniques outlined above ameliorate many of these difficulties by allowing for isolation of even single cells from the hemogenic endothelial cell and HSPC populations in embryonic tissues at critical developmental time points using reagents and equipment that are typically available in most labs. Our protocol also allows for parallel isolation of non-hemogenic endothelial cell fractions from the YS and AGM, which can be used for independent analyses, or as controls for the hemogenic endothelial cell fraction in subsequent analyses.
A key point in the isolation of the hemogenic endothelial cells using this multicolor FACS-based method is appropriate spectral compensation and accurate drawing of single-color gates. As such, it is strongly recommended that unstained and single-color controls be included in all experimental runs, and that they - along with samples treated with isotype-matched control antibodies - be used to initially establish proper spectral compensation and drawing of gates. However, non-specific staining is minimal by this protocol, thus unstained and single-color controls are sufficient for routine verification of gates once FACS sorter settings have been optimized.
Inaccurately drawn SP gates are a particular concern with the approach described in this report. Previous studies have shown that multipotent stem cells exhibit preferential efflux of Hoechst red17, forming the physiological basis for their appearance in the SP by FACS. We have shown that hemogenic endothelial cells and HSPC are similarly found within the SP cell fraction5,11. Drugs such as the calcium channel inhibitor Verapamil block this Hoechst dye efflux behavior in SP cells via blockage of a variety of transmembrane multidrug resistance transporters. In hematopoietic stem and progenitor cells, this occurs primarily via the ABCG2/BCRP1 transporter24. Typically verapamil induces >50% blockage of the SP, however, the overall degree of Hoechst efflux and its subsequent blockage by Verapamil seen has been shown to be affected by developmental timing, presumably due to changing expression of multiple multidrug resistant transporter types with differential Hoechst efflux ability, and sensitivity to Verapamil5. Thus, it is strongly recommended that Verapamil-treated Hoechst-stained negative control be standardly included to ensure proper SP gating: if an SP gate is properly drawn, a notable reduction in the number of SP cells should be detected in samples stained with Hoechst in the presence of Verapamil.
We have previously shown that sorted SP cells from the E9.5 murine yolk sac have a ~80 - 90 fold greater ability to generate HSPC in methylcellulose-based hematopoietic culture when compared to a matched number of E9.5 unfractionated, non-Hoechst stained whole YS tissue cells5. Further characterization of the SP has shown that in the murine yolk sac during early hematopoietic and vascular development at E8.0, there is appreciable expression of VE-cadherin and Flk-1, but low expression of stem (c-Kit) and hematopoietic markers (CD45). Thus, at this developmental timepoint, primordial (non-hemogenic) EC, defined as Flk-1+/CD31+/CD45- non SP cells predominate. This expression profile shifts as endothelial marker expression decreases and CD45 and c-Kit expression increases, concomitant with an increasing ability to generate HSPC in vitro between E9.5 and E11.55. This suggests hematopoietic activity of YS tissue is contained within the SP, becoming most apparent between E9.5 and E11.5, and occurring through a timed loss of endothelial characteristics and gradual acquisition of hematopoietic capacity. As such, expression of the multidrug resistance transporters that give rise to the SP phenotype are an important phenotypic marker of hemogenic endothelium5; in fact, non-SP cells from the AGM do not exhibit blood-forming potential12. Thus, successful isolation of the SP via Hoechst staining in both the YS and AGM ensures that cells will be sorted from the hematopoietic stem cell compartment of a given tissue, and subsequent antibody staining of cells within this fraction will allow discrimination of the hemogenic (Flk-1+/ c-Kit+/CD45-) versus HSPC (Flk1-/c-kit+/CD45+) populations5,11,12. Furthermore, it has been previously noted that CD41+ cells within the SP of yolk sac and AGM tissues are capable of multi-lineage colony formation in methylcellulose based culture11,12. We define hemogenic endothelial cells as Flk1+ c-Kit+ CD45- SP cells by using CD45 as a designated marker of hematopoietic lineage rather than CD41 given our finding that expression of Flk1 and CD45 is virtually mutually exclusive5,11. This allows a pure isolation of cells within the SP that have both endothelial (Flk-1) and stem characteristics(c-Kit) necessary for endothelial to hematopoietic transition but which have not yet undergone this change, as determined by absence of CD45 in these cells. It would be useful to consider sub-fractionation of the HSPC population, defined as Flk-1-/c-Kit+/CD45+/SP cells, into Csf1r+ (tissue macrophage) and Csf1r- (HSC) fraction as recently reported by Gomez and colleagues25, as this would provide greater resolution of the true HSPC versus tissue macrophage progenitor populations, but this should not affect the integrity of the hemogenic endothelial cell fraction whose isolation we have outlined since Csf1r is a marker of macrophage progenitors26.
Hemogenic endothelial cells are a rare subpopulation in both YS and AGM (comprising 1 - 3% of endothelial cells), and therefore a major challenge in their study is insufficient cell yield for subsequent applications. This protocol usually results in 70-80% of cells remaining viable by the time of sorting, and a typical hemogenic endothelial cell sort from pooled tissues obtained from multiple embryos may yield only a few hundred cells even under optimal conditions with only 10-20% of retrieved cells embedded into methylcellulose producing colonies. To maximize sorted cell number, it is strongly recommended that investigators take steps to ensure tissue and cell viability throughout every step of the procedure: tissues should be rapidly dissected and pooled, and samples should be kept on ice whenever possible. Samples should be prepared fresh immediately prior to FACS sorting, and sorted into collection tubes containing high serum content, or directly into methylcellulose culture as described above. If viability problems persist, collection tubes may also be pre-coated with serum to further enhance sorted cell survival. If hemogenic endothelial cell yield remains low, adult bone marrow or commercially-available fluorophore-conjugated beads may be used for spectral compensation in lieu of the embryonic tissue-derived single color controls described herein. If sorted cells are intended for culture, hemogenic endothelial cells and HSPC should be sorted directly into tissue culture wells. If sorted cells are intended for DNA or RNA-related gene expression analysis, hemogenic and non-hemogenic endothelial cells and HSPC may be sorted directly into collection tubes containing sample lysis buffer to minimize cell loss.
The outlined technique permits successful (and simultaneous) isolation of hemogenic and non-hemogenic endothelial cells, as well as HSPC and mature blood cell fractions from the same embryonic tissues. This approach enables further study of the molecular underpinnings of the critical transitions that occur as endothelial cells generate blood. Insights gained from these developmental studies can then be used to optimize the generation of human hemogenic endothelial cells and HSPC progeny from pluripotent, and potentially autologous, stem cells for the treatment of prevalent hematopoietic disorders.
Disclosures
This work was supported byNIH grants HL128064, HL096360, EB017103, and CT Innovations grant 15-RMB-YALE-04, to KKH, and NICHD/NIH T32HD007094.
Acknowledgements
The authors declare that they have no competing financial interests.
Materials
| Name | Company | Catalog Number | Comments |
|---|---|---|---|
| DAPT (N-[N-(3,5-Difluorophenacetyl)-L-alanyl]-S-phenylglycine t-butyl ester) | Sigma | D5942 | TOXIC irritant: Wear eye protection, mask, and gloves when handling. |
| Absorbent bench underpad | Covidien | 7134 | |
| #5 Straight Forceps | Fine Science Tools | 11251-20 | |
| 8.5 cm straight scissors | Fine Science Tools | 14090-09 | |
| Isoflurane (Isothesia) | Henry Schein | 50033 | TOXIC inhalant: Use in fume hood. |
| 100x Penicillin Streptomycin Glutamine (10,000 U/ml Penicillin, 10,000 mg/ml Streptomycin, 29.2 mg/ml L-glutamine) | Invitrogen | 10378016 | |
| Type II Collagenase | Worthington | LS004174 | |
| Falcon 70 μM nylon cell strainer | Corning | CLS431751 | |
| Anti-Mouse CD45-FITC | eBioscience | 11-0451-81 | |
| Anti-Mouse CD31 - PE | eBioscience | 12-0311-81 | |
| Anti-Mouse Flk-1 PE-Cy7 | BD Pharmingen | 561259 | |
| Hoechst 33342 (bisBenzimide H 33342 trihydrochloride) | Sigma | 14533 | TOXIC: irritant. Wear eye protection and gloves when handling. Prepare stock solution of 25 mg/ml in distilled H2O, store aliquots at -20 °C until ready for use. |
| Verapamil Hydrochloride | Sigma | 1711202 | TOXIC: irritant. Wear eye protection, mask, and gloves when handling. Prepare stock solution of 5 mM (100x) in 95% ethanol. Store at -20 °C until ready for use |
| Falcon 5 ml Round Bottom Polystyrene Test Tube, with Cell Strainer Snap Cap | Corning | 352235 | |
| MethoCult GF M3434 | Stem Cell Technologies | 3434 | Thaw and aliquot per manufacturer's instructions |
| Modified Giemsa Stain | Sigma | GS500 | TOXIC: Contains Methanol - use in fume hood and wear gloves with handling. Dilute in distilled water to 0.02% solution. |
| Cytospin Centrifuge | Thermo Scientific | A78300003 | |
| Clipped Funnel Starter Kit | Thermo Scientific | 3120110 | Includes cytofunnels, filter paper, cytoslides, and cytoclips for use with Cytospin centrifuge |
| Anti-Mouse B-220 - FITC | BD Pharmingen | 553088 | |
| Anti-Mouse Gr-1-FITC | eBioscience | 11-5931-85 | |
| Anti-Mouse Ter-119-FITC | eBioscience | 11-5921-85 | |
| Gibco Fetal Bovine Serum | Thermo Scientific | 10437-077 | |
| Dulbecco's Modified Eagle Medium (4.5 g/L) | Life Technologies | 11965-092 | |
| Hank's Buffered Salt Solution | Life Technologies | 14175-095 | |
| Fibronectin-coated 24-well tissue culture plate | EMD Millipore | PIFB24P05 | |
| IgG2A-PE | BD Pharmingen | 553930 | |
| IgG2B-FITC | BD Pharmingen | 556923 |
References
- Hirschi, K. K. Hemogenic endothelium during development and beyond. Blood. 119 (21), 4823-4827 (2012).
- Boisset, J. C., et al. et al. In vivo imaging of haematopoietic cells emerging from the mouse aortic endothelium. Nature. 464 (7285), 116-120 (2010).
- Bertrand, J. Y., et al. Haematopoietic stem cells derive directly from aortic endothelium during development. Nature. 464 (7285), 108-111 (2010).
- Kissa, K., Herbomel, P. Blood stem cells emerge from aortic endothelium by a novel type of cell transition. Nature. 464 (7285), 112-115 (2010).
- Nadin, B. M., Goodell, M. A., Hirschi, K. K. Phenotype and hematopoietic potential of side population cells throughout embryonic development. Blood. 102 (7), 2436-2443 (2003).
- Nakano, H., et al. Haemogenic endocardium contributes to transient definitive haematopoiesis. Nat Commun. 4, 1564(2013).
- Li, Z., et al. Mouse embryonic head as a site for hematopoietic stem cell development. Cell Stem Cell. 11 (5), 663-675 (2012).
- Medvinsky, A., Dzierzak, E. Definitive hematopoiesis is autonomously initiated by the AGM region. Cell. 86 (6), 897-906 (1996).
- Palis, J., Robertson, S., Kennedy, M., Wall, C., Keller, G. Development of erythroid and myeloid progenitors in the yolk sac and embryo proper of the mouse. Development. 126 (22), 5073-5084 (1999).
- de Bruijn, M. F., Speck, N. A., Peeters, M. C., Dzierzak, E. Definitive hematopoietic stem cells first develop within the major arterial regions of the mouse embryo. Embo J. 19 (11), 2465-2474 (2000).
- Goldie, L. C., Lucitti, J. L., Dickinson, M. E., Hirschi, K. K. Cell signaling directing the formation and function of hemogenic endothelium during murine embryogenesis. Blood. 112 (8), 3194-3204 (2008).
- Marcelo, K. L., et al. Hemogenic endothelial cell specification requires c-Kit, Notch signaling, and p27-mediated cell-cycle control. Dev Cell. 27 (5), 504-515 (2013).
- Tavian, M., et al. Aorta-associated CD34+ hematopoietic cells in the early human embryo. Blood. 87 (1), 67-72 (1996).
- Wang, L., et al. Endothelial and hematopoietic cell fate of human embryonic stem cells originates from primitive endothelium with hemangioblastic properties. Immunity. 21 (1), 31-41 (2004).
- Kelly, M. A., Hirschi, K. K. Signaling Hierarchy Regulating Human Endothelial Cell Development. Arterioscler Thromb Vasc Biol. 29 (5), 718-724 (2009).
- Kennedy, M., et al. T lymphocyte potential marks the emergence of definitive hematopoietic progenitors in human pluripotent stem cell differentiation cultures. Cell Rep. 2 (6), 1722-1735 (2012).
- Goodell, M. A., Brose, K., Paradis, G., Conner, A. S., Mulligan, R. C. Isolation and functional properties of murine hematopoietic stem cells that are replicating in vivo. J Exp Med. 183 (4), 1797-1806 (1996).
- Takahashi, M., Osumi, N. The method of rodent whole embryo culture using the rotator-type bottle culture system. J Vis Exp. (42), (2010).
- Bohnsack, B. L., Lai, L., Dolle, P., Hirschi, K. K. Signaling hierarchy downstream of retinoic acid that independently regulates vascular remodeling and endothelial cell proliferation. Genes Dev. 18 (11), 1345-1358 (2004).
- Coffman, R. L., Weissman, I. L. B220: a B cell-specific member of the T200 glycoprotein family. Nature. 289 (5799), 681-683 (1981).
- Fleming, T. J., Fleming, M. L., Malek, T. R. Selective expression of Ly-6G on myeloid lineage cells in mouse bone marrow. RB6-8C5 mAb to granulocyte-differentiation antigen (Gr-1) detects members of the Ly-6 family. J Immunol. 151 (5), 2399-2408 (1993).
- Kina, T., et al. The monoclonal antibody TER-119 recognizes a molecule associated with glycophorin A and specifically marks the late stages of murine erythroid lineage. British Journal of Haematology. 109 (2), 280-287 (2000).
- Jackson, K. A., et al. Regeneration of ischemic cardiac muscle and vascular endothelium by adult stem cells. J Clin Invest. 107 (11), 1395-1402 (2001).
- Scharenberg, C. W., Harkey, M. A., Torok-Storb, B. The ABCG2 transporter is an efficient Hoechst 33342 efflux pump and is preferentially expressed by immature human hematopoietic progenitors. Blood. 99 (2), 507-512 (2002).
- Gomez Perdiguero,, E,, et al. Tissue-resident macrophages originate from yolk-sac-derived erythro-myeloid progenitors. Nature. 518 (7540), 547-551 (2015).
- Murray, P. J., Wynn, T. A. Protective and pathogenic functions of macrophage subsets. Nat Rev Immunol. 11 (11), 723-737 (2011).
Reprints and Permissions
