

Summary
The comparison and optimization of two plant organellar DNA enrichment methods are presented: traditional differential centrifugation and fractionation of the total gDNA based on methylation status. We assess the resulting DNA quantity and quality, demonstrate performance in short-read next-generation sequencing, and discuss the potential for use in long-read single-molecule sequencing.
Abstract
Plant organellar genomes contain large, repetitive elements that may undergo pairing or recombination to form complex structures and/or sub-genomic fragments. Organellar genomes also exist in admixtures within a given cell or tissue type (heteroplasmy), and an abundance of subtypes may change throughout development or when under stress (sub-stoichiometric shifting). Next-generation sequencing (NGS) technologies are required to obtain deeper understanding of organellar genome structure and function. Traditional sequencing studies use several methods to obtain organellar DNA: (1) If a large amount of starting tissue is used, it is homogenized and subjected to differential centrifugation and/or gradient purification. (2) If a smaller amount of tissue is used (i.e., if seeds, material, or space is limited), the same process is performed as in (1), followed by whole-genome amplification to obtain sufficient DNA. (3) Bioinformatics analysis can be used to sequence the total genomic DNA and to parse out organellar reads. All these methods have inherent challenges and tradeoffs. In (1), it may be difficult to obtain such a large amount of starting tissue; in (2), whole-genome amplification could introduce a sequencing bias; and in (3), homology between nuclear and organellar genomes could interfere with assembly and analysis. In plants with large nuclear genomes, it is advantageous to enrich for organellar DNA to reduce sequencing costs and sequence complexity for bioinformatics analyses. Here, we compare a traditional differential centrifugation method with a fourth method, an adapted CpG-methyl pulldown approach, to separate the total genomic DNA into nuclear and organellar fractions. Both methods yield sufficient DNA for NGS, DNA that is highly enriched for organellar sequences, albeit at different ratios in mitochondria and chloroplasts. We present the optimization of these methods for wheat leaf tissue and discuss major advantages and disadvantages of each approach in the context of sample input, protocol ease, and downstream application.
Introduction
Genome sequencing is a powerful tool to dissect the underlying genetic basis of important plant traits. Most genome-sequencing studies focus on the nuclear genome content, as the majority of genes are located in the nucleus. However, organellar genomes, including the mitochondria (across eukaryotes) and plastids (in plants; the specialized form, the chloroplast, works in photosynthesis) contribute significant genetic information essential to organismal development, stress response, and overall fitness1. Organellar genomes are typically included in total DNA extractions intended for nuclear genome sequencing, although methods to reduce organelle numbers prior to DNA extraction are also employed2. Many studies have used sequencing results from total gDNA extractions to assemble organellar genomes3,4,5,6,7. However, when the target of the study is to focus on organellar genomes, using the total gDNA increases the sequencing costs because many reads are "lost" to the nuclear DNA sequences, particularly in plants with large nuclear genomes. Moreover, due to the duplication and transfer of organellar sequences into the nuclear genome and between organelles, resolving the correct mapping position of sequencing reads to the proper genome is bioinformatically challenging2,8. The purification of organellar genomes from the nuclear genome is one strategy to reduce these problems. Further bioinformatics strategies may be used to separate reads that map to regions of homology between the mitochondria and chloroplasts.
While the organellar genomes from many plant species have been sequenced, little is known about the breadth of organellar genome diversity available in wild populations or in cultivated breeding pools. Organellar genomes are also known to be dynamic molecules that undergo significant structural rearrangement due to recombination between repeat sequences9. Moreover, multiple copies of the organellar genome are contained within each organelle, and multiple organelles are contained within each cell. Not all copies of these genomes are identical, which is known as heteroplasmy. In contrast to the canonical picture of "master circles," there is now growing evidence for a more complex picture of organellar genome structures, including sub-genomic circles, linear chromosomes, linear concatamers, and branched structures10. The assembly of plant organellar genomes is further complicated by their relatively large sizes and substantial inverted and direct repeats.
Traditional protocols for organellar isolation, DNA purification, and subsequent genome sequencing are often cumbersome and require large volumes of tissue input, with several grams to upwards of hundreds of grams of young leaf tissue necessary as a starting point11,12,13,14,15,16,17. This makes organellar genome sequencing inaccessible when tissue is limited. In some situations, seed amounts are limited, such as when it is necessary to sequence on a generational basis or in male sterile lines that have to be maintained via crossing. In these situations, organellar DNA can be purified and then subjected to whole-genome amplification. However, whole-genome amplification can introduce significant sequencing bias, which is a particular problem when assessing structural variation, sub-genomic structures, and heteroplasmy levels18. Recent advances in library preparation for short-read sequencing technologies have overcome low-input barriers to avoid whole-genome amplification. For example, the Illumina Nextera XT library preparation kit allows for as little as 1 ng of DNA to be used as input19. However, standard library preparations for long-read sequencing applications, such as PacBio or Oxford Nanopore sequencing technologies, still require a relatively high amount of input DNA, which can pose a challenge for organellar genome sequencing. Recently, new user-made, long-read sequencing protocols have been developed to reduce the input amounts and to help facilitate genome sequencing in samples where obtaining microgram-quantities of DNA is difficult20,21. However, obtaining high-molecular weight, pure organellar fractions to feed into these library preparations remains a challenge.
We sought to compare and optimize organellar DNA enrichment and isolation methods suitable for NGS without the need of whole-genome amplification. Specifically, our goal was to determine best practices to enrich for high-molecular weight organellar DNA from limited starting materials, such as a subsample of a leaf. This work presents a comparative analysis of methods to enrich for organellar DNA: (1) a modified, traditional differential centrifugation protocol versus (2) a DNA fractionation protocol based on the use of a commercially available DNA CpG-methyl-binding domain protein pulldown approach22 applied to plant tissue23. We recommend best practices for the isolation of organellar DNA from wheat leaf tissue, which may be readily extended to other plants and tissue types.
Subscription Required. Please recommend JoVE to your librarian.
Protocol
1. Generation of Plant Materials for Organellar Isolation and DNA Extraction
- Standard growth of wheat seedlings
- Plant seeds in vermiculite in small, square pots with 4 - 6 seeds per corner. Transfer to a greenhouse or growth chamber with a 16 h light cycle, 23 ºC day/18 ºC night.
- Water the plants each day. Fertilize the plants with ¼ teaspoon of granular 20-20-20 N-P-K fertilizer upon germination and at 7 days post-germination.
- Alternative etiolation of wheat seedlings
- Follow step 1.1, but place the pots in a dark growth chamber, 23 °C for 16 h/18 ºC for 8 h. Alternatively, cover the plants in the greenhouse (e.g., with a storage container; however, proper ventilation must be maintained).
- Growth and tissue collection
- Grow the plants for 12 - 14 days. For most wheat genotypes, 75 - 100 seedlings yield around 10 - 12 g of tissue, which is sufficient for two organellar extractions using the differential centrifugation method (section 2); only one plant is necessary if utilizing the DNA CpG-methylation-based pulldown approach to fractionate organellar from nuclear DNA (section 3).
- If utilizing the differential centrifugation approach, collect tissue fresh and proceed immediately to processing the samples, as described in section 2.
- If utilizing the CpG-methyl pulldown approach, harvest 20 mg sections of young leaf tissue into microcentrifuge tubes (use either standard-grown or etiolated tissue, see the Representative Results). Snap-freeze on liquid nitrogen and freeze at -80 ºC until use. Proceed to the pulldown fractionation of DNA, as described in section 3.
2. Method #1: DNA Extraction Using Differential Centrifugation (DC)
NOTE: The differential centrifugation protocol was modified from two publications that optimized conditions to isolate both organelles but enrich for mitochondria17,24. The resulting protocol is less time-intensive and uses fewer toxic chemicals than the previous methods. Specifically, we made modifications to the buffers and wash steps, including the addition of polyvinylpyrrolidone (PVP) to the STE extraction buffer and the elimination of the final wash step in NETF buffer, which contains sodium fluoride (NaF).
Caution: The preparation and use of STE buffer should be performed under a chemical fume hood with proper personal protection equipment, as this buffer contains 2-mercaptoethanol (BME).
- Things to do before starting
- Ensure that all equipment is extremely clean, and autoclave any equipment that can be autoclaved (e.g., grinding cylinders, high-speed centrifuge tubes, etc.).
NOTE: Filter-tips are recommended for all steps requiring pipetting to avoid cross-contamination. - See the list of required equipment and reagents and prepare the required buffers and working stocks for Method #1 (Table 1). Chill the cryogenic grinding blocks to -20 ºC and the rotors and buffers to 4 ºC, set the microcentrifuge to 4 ºC, and turn on a 37 ºC water bath.
- Ensure that all equipment is extremely clean, and autoclave any equipment that can be autoclaved (e.g., grinding cylinders, high-speed centrifuge tubes, etc.).
- Isolation of organelles
- Harvest 5 g of fresh tissue and rinse it in cold, sterile water in a chilled beaker on ice.
NOTE: Always keep the samples on ice during all operations and transportations to and from the centrifuges, fume hoods, etc. Alternatively, work in a cold room if there is access to sufficient space and equipment to carry out the protocol. - Using scissors, cut leaf tissue into ~1-cm pieces directly into a 50 mL tube containing two ceramic grinding cylinders.
NOTE: Clean or change the scissors between samples to avoid cross-contamination. - If there is no tissue homogenizer, use a mortar and pestle and follow to replace steps 2.2.4 - 2.2.9.
- Cut the leaf tissue into a pre-chilled mortar on ice. Grind the samples for 2 - 3 min in 15 mL of STE (in the fume hood).
- Pour off the buffer (leave the tissue in the mortar) through a funnel containing one layer of pre-wet, sterile filtration cloth (~22- to 25-µm pore size; see the main protocol for details) into another 50-mL tube. Add an additional 10 mL of STE to the mortar and pestle and homogenize again.
- Pour the homogenized tissue and buffer into the same funnel. Rinse the mortar and pestle with 10 mL of STE and pour it into the funnel. Squeeze and wring out the filtration cloth into the funnel to recover as much liquid as possible.
NOTE: Change gloves between samples to avoid cross-contamination. Continue with the protocol at step 2.2.10.
- Add 20 mL of STE (in the fume hood) to each 50 mL tube.
- Place the samples into pre-chilled cryogenic grinding blocks in a tissue grinding apparatus and grind the samples for 2 x 30 s at 1,750 rpm. Rotate the sample positions and place the samples on ice for ~1 min between grinds.
NOTE: A mortar and pestle, blender, or other tissue grinding/homogenizing device may be used in this step. However, each method will affect the resulting DNA quality to different degrees, and therefore DNA length and quality should be assessed before continuing with downstream applications. - Insert a funnel into a clean 50-mL tube placed in ice. Place one layer of filtration cloth into the funnel and pre-wet it with 5 mL of STE. Do not discard the flow-through.
- Pour the homogenized tissue into the funnel. Rinse the grinding tube with 15 mL of STE, recap and invert the tube to rinse the walls and lid, and pour into the funnel.
- Carefully remove the ceramic stones and then squeeze and wring out the filtration cloth into the funnel.
NOTE: Change gloves between samples to avoid cross-contamination. - Wrap the tube caps with parafilm to avoid spillage. Centrifuge at 2,000 x g for 10 min at 4 ºC.
- Carefully aspirate the supernatant using a serological pipette (avoid disturbing the pellet) and place it in a 50 mL high-speed centrifuge tube (if the tubes do not have tight sealing gaskets, wrap the tube caps with parafilm to avoid spillage). Discard the pellets.
- Balance the tubes to within 0.1 g using STE and centrifuge the resulting supernatant for 20 min at 18,000 x g and 4 ºC. To balance the tubes, place a small beaker of ice on the balance, tare the scale, and weigh the samples on ice to keep them cold. Alternatively, use a balance and a fume hood in a cold room.
- Discard the supernatant. Add 1 mL of ST to the pellet and re-suspend gently using a soft paintbrush. Add 24 mL of ST (final volume of 25 mL) and mix/swirl (i.e., press the paintbrush on the side of the tube to remove all liquid).
- Balance the tubes to within 0.1 g using ST. Centrifuge for 20 min at 18,000 x g and 4 ºC. Meanwhile, prepare DNaseI solution (see Table 1 for stock and working solution recipes). For each sample, make one 200 µL aliquot in a 1.5 mL tube.
- Discard the supernatant, blot the tube, and re-suspend the pellet (still in a high-speed centrifuge tube) in 300 µL of ST using a soft paintbrush. Place the paintbrush in the previously prepared 1.5 mL tube containing 200 µL of DNaseI solution and swirl the paintbrush to remove any residual pellet stuck in the brush. Pipette the DNaseI solution back into the high-speed centrifuge tube and gently swirl to mix.
- Incubate at 37 °C for 30 min in a water bath (wrap parafilm around top of the tube to prevent condensation leaking into the cap). Gently mix by swirling 2 times during incubation.
- Gently pipette the pellet mixture out of the tube using a pipette tip with a wide orifice and place it in a 1.5 mL low-bind tube. Add 500 µL of 400 mM EDTA, pH 8.0, to the high-speed centrifuge tube and gently pipette to get all of the residual pellet out of the tube. Transfer the EDTA to the same 1.5-mL, low-bind tube as the pellet mixture and gently mix by inversion.
- Centrifuge at 18,000 x g for 20 min at 4 ºC. Discard the supernatant, blot the tube, and use at once for DNA isolation. If necessary, freeze pellets at -20 ºC, but this may result in a yield reduction, as residual DNaseI may degrade the sample DNA if it is not immediately processed.
- Harvest 5 g of fresh tissue and rinse it in cold, sterile water in a chilled beaker on ice.
- DNA extraction from isolated organelles using a commercial column-based approach
NOTE: See the kit handbook for the full protocol25, and see below for modifications. Proceeding directly from organellar isolation to DNA extraction is preferred. Repeated freezing and thawing will reduce DNA fragment sizes and lead to DNA degradation by residual DNaseI. Limit vortexing or vigorous pipetting, as this can shear the DNA. The use of low-bind microcentrifuge tubes is recommended to maximize DNA recovery.- DNA extraction procedure
NOTE: Read the detailed commercial protocol25 before starting to ensure that the buffers are properly made/stored and that the spin-column procedures are understood.- Add 180 µL of Buffer ATL directly into the tube with the pellet (thawed if previously frozen and equilibrated to room temperature on the benchtop).
- Proceed with step 3 in the protocol for "DNA Purifications from Tissues" in the kit handbook, with the following modifications: a 30-min lysis in step 3, include the optional RNase A digestion, and elute in 3 x 200 µL of AE (each into a separate tube and then combine the elutions).
- Save an aliquot (at least 20 µL) for qPCR (see step 4.1). To quantify before concentrating, save an additional 1 µL for high-sensitivity quantification.
- If desired, proceed with sample concentration.
- DNA extraction procedure
- Sample concentration with commercial filter units
NOTE: See the commercial protocol26 for more details. Depending on the downstream use, it may not be necessary to perform sample concentration (e.g., for end-point PCR and qPCR applications). However, for NGS library construction, it will likely be necessary to concentrate dilute organellar DNA obtained after DNA extraction.- Concentration column procedure
- Carefully pre-weigh (see Table 2) the empty filter unit (without a tube) on a clean piece of weighing paper on a digital analytical balance. Record the weight.
- Pipette the combined elutions into the filter unit and carefully weigh again.
NOTE: The commercial manual26 says that the filter unit maximum volume is 500 µL, but up to 575 µL can be added to the unit at once with no overflow. - Carefully place the filled filter unit into a tube (provided with the columns). Centrifuge at 500 x g for the desired time to achieve the required concentrate volume. For a sample volume of ~575 µL, a 20-min spin will usually result in a concentrate volume of 15 - 30 µL.
- Remove the filter unit from the tube and weigh again. Use the table to determine if the desired concentrate volume has been achieved. If not, centrifuge again at 500 x g for a shorter length of time and weigh again; repeat until the desired concentrate volume is reached.
- Place a new tube (provided with the columns) over the top of the filter unit and invert. Centrifuge for 3 min at 1,000 x g to transfer the concentrate to the tube.
- Determine the volume recovered. This will usually be ~3 - 5 µL less than the calculated volume, due to filter retention. If over-concentrated, dilute with sterile water or TE to achieve the desired volume.
- Quantify the DNA using high-sensitivity quantification (per manufacturer instructions).
- Concentration column procedure
3. Method #2: Methyl-fractionation (MF) Approach to Enrich for Organellar DNA from Total Genomic DNA
NOTE: This protocol was modified from a user-developed Genomic Tip Kit DNA extraction protocol for plants and fungi27 and the commercial Microbiome DNA Enrichment Kit protocol28. In theory, any DNA isolation protocol that yields high-molecular weight DNA may be used for the pulldown. For short-read sequencing, any extraction yielding predominately >15 kb fragments is adequate for use in the pulldown. For long-read sequencing, larger fragments may be desirable. Therefore, we optimized this protocol to yield high molecular weight DNA.
- Isolation of total DNA
NOTE: See the list of required equipment and reagents and prepare the required buffers and working stocks for Method #2 (Table 1). Add lysing enzymes to the lysis buffer stock to make the lysis buffer working solution. Turn on the thermomixer and set it to 37 °C. Turn on the water bath to 50 °C and place QF buffer in the bath. Place 70% EtOH in the freezer and set the microcentrifuge to 4 °C.- Total DNA extraction using commercial DNA extraction columns
NOTE: Before starting, read the commercial handbook29 for detailed information regarding the use of the gravity-flow anion-exchange columns. The columns may be set up using a specialized rack or placed over the tubes using the provided plastic rings. All steps, including the genomic tips, should be allowed to proceed by gravity flow, and residual liquid should NOT be forced through.- Grind 20 mg of frozen tissue in liquid nitrogen in a 2-mL low-bind tube using hand-held grinding pestles designed for 2-mL tubes.
- Add 2 mL of lysis buffer working solution (the tubes will be very full).
- Incubate in a thermomixer at 37 °C for 1 h with gentle agitation at 300 rpm. If a thermomixer is not available, incubating on a heat block and mixing by gentle flicking every 15 min is a suitable alternative.
- Add 4 µL of RNase A (100 mg/mL, final concentration of 200 µg/mL). Invert to mix and incubate in a thermomixer for 30 min at 37 °C, with gentle agitation at 300 rpm.
- Add 80 µL of proteinase K (20 mg/mL, final concentration of 0.8 mg/mL), invert to mix, and incubate in a thermomixer for 2 h at 50 °C, with gentle agitation at 300 rpm.
- Centrifuge for 20 min at 4 °C and 15,000 x g to pellet the insoluble debris.
- While the samples are centrifuging, equilibrate the columns with 1 mL of Buffer QBT and allow the column to empty by gravity flow.
- Use a wide-bore pipette tip to promptly apply the sample (avoid the pellet) to the equilibrated column and allow it to fully flow through the column. If the sample becomes cloudy, filter or centrifuge again before application to the column (see the commercial handbook for details29).
- Once the sample has fully entered the resin, wash the column with 4 x 1 mL of Buffer QC.
- Suspend the column over a clean, 2 mL, low-bind microcentrifuge tube. Elute the genomic DNA with 0.8 mL of Buffer QF prewarmed at 50 °C.
- Precipitate the DNA by adding 0.56 mL (0.7 volumes of elution buffer) of room-temperature isopropanol to the eluted DNA.
- Mix by inversion (10X) and centrifuge immediately for 20 min at 15,000 x g and 4 °C. Carefully remove the supernatant without disturbing the glassy, loosely attached pellet.
- Wash the centrifuged DNA pellet with 1 mL of cold 70% ethanol. Centrifuge for 10 min at 15,000 x g and 4 °C.
- Carefully remove the supernatant (be cautious with this step as well) without disturbing the pellet. Air-dry for 5-10 min and resuspend the DNA in 0.1 mL of elution buffer (EB). Dissolve the DNA overnight at room temperature. Avoid pipetting, which may shear the DNA.
- Quantify the samples using a high-sensitivity DNA quantification assay (per manufacturer instructions).
- Total DNA extraction using commercial DNA extraction columns
- Bead-based fractionation of methylated and unmethylated DNA
NOTE: A recent publication demonstrated the use of a commercially available kit28 that takes advantage of a pulldown approach utilizing a CpG-specific methyl-binding domain protein fused to the human IgG Fc fragment (MBD2-Fc protein) to fractionate plant organellar genomes (unmethylated) from nuclear genome (highly methylated) content23. Fractionation efficiency in wheat samples was not previously tested using this commercial MF kit28.- Things to do before starting
- Freshly prepare 80% ethanol (at least 800 µL per reaction). Set 5x bind/wash buffer to thaw on ice and prepare 5 mL of 1x buffer per sample (dilute 5X buffer with sterile, nuclease-free water and keep on ice during the protocol).
- Prepare MBD2-Fc protein-bound magnetic beads
- Prepare the required number of bead sets. Scale the reactions to use between 1 and 2 µg of total input DNA, requiring 160 - 320 µL of beads. Note that the reactions listed below are for 1 µg of total input DNA, so they require 160 µL of beads. Scale the reactions according to the needs.
- Using wide-bore tips, gently pipette the Protein A Magnetic Bead slurry up and down to create a homogeneous suspension. As an alternative, gently rotate the tube of beads for 15 min at 4 °C.
NOTE: Do not vortex the beads. - Proceed with the directions per the manufacturer instructions28.
- Capture methylated nuclear DNA
- For each individual sample, add 1 µg of input DNA to a tube containing 160 µL of MBD2-Fc-bound magnetic beads.
- Add 5x bind/wash buffer as appropriate given the volume of the DNA input sample for a final concentration of 1x (volume of 5x bind/wash buffer to add (µL) = volume of input DNA (µL)/4). Pipette the sample up and down a few times to mix using a wide-bore pipette tip.
- Rotate the tubes at room temperature for 15 min. Gently pipette the samples with a wide-bore pipette tip and flick the samples 2 - 3 times throughout the incubation to prevent bead clumping.
NOTE: The pipetting and flicking is critical to ensure efficient pulldown of the methylated DNA.
- Collect enriched, unmethylated organellar DNA
- Briefly spin the tube containing the DNA and MBD2-Fc-bound magnetic bead mixture. Place the tube on a magnetic rack for at least 5 min to collect the beads to the side of the tube. The solution should appear clear.
- Using wide-bore tips, carefully remove the cleared supernatant without disturbing the beads. Transfer the supernatant (contains unmethylated, organellar-enriched DNA) to a clean, low-bind, 2-mL microcentrifuge tube. Store this sample at -20 or -80 °C, or proceed directly to step 3.2.6 for purification.
- Elute captured nuclear DNA from the MBD2-Fc-bound magnetic beads
- If the nuclear fraction is also desired, follow the manufacturer instructions28 to elute the nuclear DNA from the MBD2-Fc-bound magnetic beads; purify as described in step 3.2.7.
- Bead-based nucleic acid purification
- Make sure the purification beads are at room temperature and are thoroughly mixed. Proceed with the protocol per the instructions in the MF kit manual28.
NOTE: The sample can now be used for NGS library construction or another downstream analysis.
- Make sure the purification beads are at room temperature and are thoroughly mixed. Proceed with the protocol per the instructions in the MF kit manual28.
- Things to do before starting
4. Sample Quantification and Quality Control
- qPCR assay to assess organellar enrichment
NOTE: The qPCR reaction and assay parameters listed here were designed for use on a Roche LightCycler 480 and may need to be adjusted for different equipment and reagents. If qPCR is unavailable, end-point PCR and visualization on an agarose gel may be used as a qualitative measure of sample purity, using the same primers and conditions described here. Amplicon sizes will be ~150 bp for all primer sets. See Table 3 for primer sequences and pairings.- qPCR reaction setup
- To set up an individual 20 µL qPCR reaction, carefully pipette the following into a single well of a 96-well qPCR plate: 10 µL of 2x SYBR Green I Master; 2 µL of the 10 µM forward and reverse primer mix (for a final concentration of 0.5 µM); 2 µL of template (within the range of the standard curve); and 6 µL of sterile, nuclease-free H2O. To reduce pipetting errors, it is preferable to make a master mix with all reaction components except the template. Add the master mix to the qPCR plate and then add the template of interest to each well. Three technical replicates for each sample should be performed to minimize the effects of pipetting error.
NOTE: Ultimately, the ratio of nuclear to organellar quantification cycles are compared between samples, so slight differences in concentration are acceptable. However, DNA concentrations should be roughly within the range of each other. - Seal the plate with a high-quality qPCR sealing film. Gently vortex the samples, taking care to avoid the creation of any bubbles. Briefly spin the plate down for 2 min at 4 °C to collect the sample and eliminate any small bubbles.
- Load the plate into the machine. Run the qPCR program per the guidelines listed below.
- To set up an individual 20 µL qPCR reaction, carefully pipette the following into a single well of a 96-well qPCR plate: 10 µL of 2x SYBR Green I Master; 2 µL of the 10 µM forward and reverse primer mix (for a final concentration of 0.5 µM); 2 µL of template (within the range of the standard curve); and 6 µL of sterile, nuclease-free H2O. To reduce pipetting errors, it is preferable to make a master mix with all reaction components except the template. Add the master mix to the qPCR plate and then add the template of interest to each well. Three technical replicates for each sample should be performed to minimize the effects of pipetting error.
- qPCR reaction parameters
NOTE: These are default parameters, except for the annealing cycle of the amplification stage. Adjust this setting to accommodate specific primers if those used differ from the primers presented in this protocol.- Pre-incubate at 95 °C for 5 min, with a ramp rate of 4.4 °C/s.
- Perform 45 amplification cycles of (1) 95 °C for 10 s, with a ramp rate of 4.4 °C/s; (2) 60 °C for 20 s, with a ramp rate of 2.2 °C/s; and (3) 72 °C for 10 s, with a ramp rate of 4.4 °C/s (data acquired during (3)).
- Use an optional melt curve cycle of 95 °C for 5 s, with a ramp rate of 4.4 °C/s; 65 °C for 1 min, with a ramp rate of 2.2 °C/s; and 97 °C, with a continuous acquisition mode.
- Use a cooling cycle of 40 °C for 30 s, with a ramp rate of 1.5 °C/s.
- Assay parameters
- Select the SYBR template. Check the program parameters in the Experiment button. Once plate is loaded, the assay can be started, and the settings may be adjusted while the assay is running.
- Assign samples using the sample editor. Select Abs Quant as the workflow and designate the samples as unknown, standards, or negative controls. Designate replicates and fill in the sample names of the first of each replicate. Add concentrations and units to the standards.
- Set up subsets for analysis; these are assigned in the subset editor.
- For analysis, select Abs Quant/2nd Derivative Max from the "create new analysis" list. Import the externally saved standard curve (if applicable) and then hit calculate; the report will contain the information selected.
- To perform accurate absolute quantification for the determination of copy number or concentration, use a standard curve that is representative of the sample being tested (e.g., organellar DNA isolated from the above methods). Since the amount of mitochondrial DNA required to prepare a standard curve is too high to be attained with a reasonable amount of tissue, do not utilize copy number calculations provided by the software, but instead examine crossing point (Cp) values to determine the relative enrichment of organellar compared to nuclear DNA in the samples. Compare these relative amounts to those of total genomic DNA (see the Representative Results). Test primer efficiencies on five 1:10 dilutions of total genomic DNA from fully light-grown, two-week-old wheat seedlings (representative efficiencies reported in the legend of Figure 2).
- qPCR reaction setup
- Pulsed-field gel electrophoresis (PFGE)
NOTE: This protocol is based on manufacturer guidelines to perform PFGE to resolve high-molecular weight DNA. See the Materials Table.- Preparing the gel and samples
- Follow the guidelines for gel and sample preparation and adapt them to the available system.
- Run the parameters
- Follow the guidelines for setting up the electrophoresis system and use the following parameters: initial switch time of 2 s, final switch time of 13 s, run time of 15 h and 16 min, V/cm of 6, and included angle of 120°.
- Stain and image the gel
- Stain the gel with a dye of choice (e.g., ethidium bromide or a suitable alternative) and image with a suitable gel documentation system.
- Preparing the gel and samples
- NGS and analysis
- Use 1 ng of DNA as the input for the DNA Library Prep Kit, per the manufacturer's instructions.
- Barcode and pool the samples for sequencing in a single run. Perform sequencing according to manufacturer guidelines.
NOTE: Pooling and sequencing parameters may be altered depending on the species of interest, the desired coverage level, and the platform used to sequence the libraries. For example, a HiSeq lane has substantially more output than a MiSeq lane, so many more samples can be multiplexed. Sequence a smaller subset of samples to determine if the coverage levels of the organellar genomes are adequate for downstream analysis. - Examine the read quality using FastQC31 to determine the extent of trimming and filtering required for the data.
- Trim and filter the raw reads using Trimmomatic32 or another comparable program. Use the following settings: ILLUMINACLIP 2:30:10 (to remove adapters), LEADING 3, TRAILING 3, SLIDINGWINDOW 4:10, and MINLEN 100.
- Map the quality-filtered and adapter-trimmed paired-end (PE) reads to Chinese Spring mitochondrial (NCBI Reference Sequence NC_007579.133), chloroplast (NCBI Reference Sequence NC_002762.134), and nuclear35 reference genomes using Bowtie236, with the following settings: -I 0 -X 800 --sensitive.
- Convert the sam alignment files to bam format (samtools) and sort the bam files. Use the bam files to calculate genome-wide coverage and per-base coverage with bedtools. Visualize the results with the R-plot function.
Subscription Required. Please recommend JoVE to your librarian.
Representative Results
The protocols presented in this manuscript describe two distinct methods to enrich for organellar DNA from plant tissue. The conditions presented here reflect optimization for wheat tissue. A comparison of key steps in the protocols, required tissue input, and DNA output are described in Figure 1. The steps of the DC protocol we tested follow similar conditions to those described previously (Figure 1A). Harvested tissue must be processed freshly and subjected to differential centrifugation and/or gradients to isolate intact organelles. The nuclear DNA is eliminated before the organelles are lysed, and finally, the DNA is extracted and used for downstream applications. In contrast, in the MF protocol, plant tissue may be harvested and stored before use, and intact organelles are not required. Instead, the nuclear and organellar DNA is fractionated from total gDNA based on the methylation status of the DNA. Both protocols yield roughly equal amounts of organellar DNA (Figure 1C). In terms of total organellar DNA output relative to tissue input, the MF protocol is advantageous when tissue is limited, as a small sample from a single plant may be used, and the plant may be allowed to grow for further analysis. Typically, in DC protocols, all aerial tissues of many seedlings are required, and these plants are discarded. However, the DC method can be optimized to specifically enrich for one organelle type over the other, which is not possible with the MF approach. It is worth mentioning that the total time for each protocol is roughly equivalent, although there is less hands-on time in the MF approach.
Both Methods Enrich for Organellar DNA, Albeit with Differing Proportions of Mitochondria and Plastid Sequences:
Very low amounts of purified organellar DNA are obtained from either method (on the order of ~50 - 100 ng; Figure 1C). To assess the levels of organellar genome enrichment and nuclear genome contamination in DNA isolated from both the DC and MF methods, a qPCR assay was employed. In this assay, the relative abundances of three amplicons (i.e., nuclear-specific, ACTIN; mitochondrial-specific, NAD3; and chloroplast-specific, PSBB) were assessed in total genomic DNA, and the organellar DNA fraction was obtained from both methods (Figure 2). Quantification cycle (Cq) values were examined for each sample (Figure 2A), and because the Cq is defined as the PCR cycle at which the fluorescence from the target amplification increases above the background fluorescence level, Cq and target abundance have an inverse relationship. In the DC sample, the Cq of NAD3 and PSBB are, respectively, ~17 and ~15 cycles earlier than ACTIN (which has a Cq of ~36) (see Figure 2B for Cq values and enrichment levels). This equates to theoretical 167,181- and 47,790-fold enrichments for NAD3 and PSBB, respectively, relative to ACTIN in the DC sample (Figure 2B, see the legend of Figure 2 for the calculation). In the total genomic DNA sample, the fold enrichments for NAD3 and PSBB relative to ACTIN are only 158 and 10,701, respectively. It is not surprising to find a higher abundance of the organellar amplicons relative to the nuclear amplicon in total genomic DNA, given that the organellar genomes exist in greater copy numbers per cell than the nuclear genome37 and that the number of organelles per cell may differ depending on the tissue type or the developmental stage38,39. Overall, the data indicate that the DC method preferentially enriches for mitochondria, which is to be expected, as centrifugation speeds are optimized for selectively isolating mitochondria and reducing nuclear and chloroplast "contamination."
The unmethylated fraction of the MF total gDNA also shows substantial enrichment of both organellar amplicons and is expected to retain the native relative amounts of these targets. The fold enrichments for NAD3 and PSBB relative to ACTIN in the unmethylated fraction are 20,551 and 1,703,253, respectively (Figure 2A and 2B). In the methylated fraction, the fold enrichments for NAD3 and PSBB relative to ACTIN are 31 and 823, respectively, indicating that MBD2-Fc protein is highly efficient at the pulldown of methylated nuclear DNA. As the chloroplast amplicon has a higher abundance than the mitochondrial amplicon in total genomic DNA (~6 Cq earlier), methylated fraction (~5 Cq earlier), and unmethylated fraction (~6 Cq earlier) samples, this suggests that the native abundance of these amplicons is not substantially changed by MDB2 pulldown. We focus here on the unmethylated (organellar) fraction due to the interest in sequencing these genomes specifically. However, if the nuclear genome is the primary interest, MF and subsequent sequencing of the methylated fraction would yield a much higher nuclear genome coverage than total genomic DNA sequencing, due to the reduction in organellar DNA "contamination."
It is worth noting that if qPCR is not available, end-point PCR (using the same primers as for qPCR) provides the qualitative assessment of organellar purity. In this case, pure organellar DNA samples will show amplification for the mitochondrial and plastid amplicons, but no detectable amplification of the nuclear amplicon on the agarose gel, whereas total genomic DNA shows amplification for all three primer sets, as demonstrated in previous studies11,12.
Organellar DNA Isolated From Both Methods Is Suitable for NGS:
Trimmed and cleaned PE sequencing reads (see step 4.3) were mapped to previously published wheat organellar reference genomes, and the amount of reads used for mapping each sample ranged from ~800,000 to 1,100,000 reads (Figure 3I). Results from mapping de novo Illumina sequencing reads to the available wheat chloroplast and mitochondria genomes are consistent with the qPCR results, with the DC method yielding DNA that is more enriched in mitochondrial DNA (Figure 3A and 3B, ~80% and ~10% of reads map to the mitochondrial (mt) and chloroplast (cp) genomes, respectively) and the MF method yielding DNA that likely reflects the native abundance of the two organellar genomes (Figures 3A and 3B, ~20% and ~80% of reads map to the mt and cp genomes, respectively). In both methods, the theoretical coverage (see the legend of Figure 3 for the calculation) of both wheat organellar genomes exceeds 100X coverage (and ranges up to ~2,000X coverage for the chloroplast genome in the unmethylated fraction from the MF method), even when 12 libraries are multiplexed (Figure 3C and 3D; the 6 libraries included in this analysis were pooled with an additional 6 libraries for a separate analysis, for a total of 12 libraries pooled in a single sequencing lane). A more detailed view of coverage was attained by examining the fraction of the genome covered at specific depths, as well as at per-base coverage levels (Figure 3E-3I). For the MF method, the average per-base coverage was ~300 - 450X for the mt genome and 4,000 - 5,000X for the cp genome. For the DC method, the average per-base coverage was ~900 - 1,300 and ~500 - 700X for the mt and cp genomes, respectively. However, there was a small fraction of both the mt and cp genomes that had extremely low or high coverage, and this was seen in organellar DNA derived from either method (Figure 3I). Regions of higher-than-average coverage likely correspond to regions of homology between the organellar genomes, and regions with low coverage may indicate SNPs or other small variants between the cultivars we sequenced and the published references. In support of this notion, these spikes of high coverage were most pronounced for the mt DNA derived from the MF method (Figures 3E and 3I), likely due to the high coverage of the cp genome in this method. Unexplainably, the coverage of the cp genome is more uneven in the MF method than the DC method (Figure 3G and 3H), which could be due to slight biases in the MBD2-Fc pulldown along the cp DNA. Further experiments will be required to determine why this is the case. Regardless, the mt and cp genomes had relatively even coverage with both methods and no large areas of missing coverage, which can be demonstrated by the examination of the fraction of genomes sequenced at a given depth (Figure 3E-3H). Additionally, the levels of coverage for both genomes are considered sufficient for downstream analysis, such as variant analysis. If deemed necessary for the analysis of rare variants, reducing the number of pooled samples would achieve greater coverage. Alternatively, a far greater number of samples may be pooled on a HiSeq lane, while attaining even greater sequencing depth, albeit at a sacrifice to sequence length, as HiSeq libraries are currently limited at the PE150 length in contrast to PE300 MiSeq libraries.
To examine the levels of nuclear genome contamination using a mapping approach, PE read mapping categories were examined. PE reads can map to a reference genome in a variety of configurations. When reads 1 and 2 align to the reference in a head-to-head fashion, with a certain "expected" distance between the two mates (based on the average insert size of the library and typically specified as an input parameter in the mapping software), these PE reads are said to map "concordantly." In contrast, "discordant" mapping is the situation where mates map with a lesser- or greater-than-expected distance to the reference genome or map in alternate configurations (head-to-tail or tail-to-tail). If only one mate aligns to the reference genome, then that PE read is said to map neither concordantly or discordantly to the reference genome. In all three read-mapping categories, PE reads can align to the reference genome one or multiple times.
For both DC- and MF-isolated organellar DNA, read mapping to the mitochondrial genome was predominantly in the aligned concordantly one time category (Figure 4A), whereas reads mapped to the chloroplast genome in relatively equal proportions of concordantly one time and concordantly more than one time (Figure 4B), likely due to the large inverted repeats present in the chloroplast genome and also to the extremely high coverage levels. However, fewer PE reads mapped to the nuclear genome and largely mapped more than one time in a neither concordant nor discordant fashion (i.e., only one mate is able to map). These are most likely mapping "off-target" to sequences in the nuclear genome, which are homologous to the organellar genomes or misassembled regions. Only a minor amount of reads (<5%) mapped to the nuclear genome concordantly, indicating low levels of nuclear genome contamination in organellar DNA isolated from the DC or MF method (Figure 4C), as is also reflected by the qPCR results (Figure 2A). The nuclear fraction after MBD2-Fc pulldown from Chinese Spring non-etiolated tissues was also sequenced to determine how efficient the pulldown is at the removal of unmethylated DNA. Less than 1% of reads in the nuclear fraction-derived library mapped to organellar reference genomes, whereas ~45% of all reads mapped to the nuclear genome (Figure 4). However, most reads mapped in a discordant fashion, which likely reflects the high levels of misassembly and fragmentation in the wheat nuclear reference genome. Regardless, the results suggest that the MBD2-Fc pulldown is highly efficient at the removal of unmethylated organellar DNA from methylated nuclear DNA. It is worth noting that, because the organellar-enriched DNA resulting from these methods contains a mixture of mitochondria and chloroplast sequences, and because sequence similarities resulting from ancient gene transfer between these organelles remain in their genomes, the proper assignment of reads to the specific genomes must be solved bioinformatically.
The Etiolation of Leaf Tissue Does Not Appreciably Alter Organelle Abundances:
Traditionally, etiolated tissues are preferred for plant mitochondrial DNA isolation in order to decrease the levels of phenolics and starches, which may interfere with extraction or downstream applications13. To determine if organellar genome enrichment levels could be altered or improved by growth conditions, both etiolated and non-etiolated tissues were subjected to the MF protocol and sequencing. Interestingly, etiolation did not appreciably change the percentage of reads that mapped to the organellar reference genomes (Figures 3A and 3B) or the per-base coverage (Figure 3I) compared to non-etiolated conditions. We also isolated organellar DNA using differential centrifugation, with both etiolated and non-etiolated tissues, and little difference in enrichment was found between the different tissues using qPCR (data not shown). This suggests that more physiologically relevant non-etiolated tissues can be used for organellar sequencing studies, with no appreciable change of enrichment.
Quality Control Suggests That MF DNA Is Most Suitable for Long-read Sequencing:
As long-read sequencing becomes more accessible to researchers, the isolation of high-molecular weight DNA is becoming increasingly important. To assess organellar DNA isolated with either method for intactness and quality, PFGE was employed. Total genomic DNA typically migrates as a diffuse smear in PFGE, and the molecular weight is determined by the protocol and how the DNA was stored and handled post-extraction. The total genomic DNA isolated with genomic tips should exceed 50 kb, which was verified using PFGE (Figure 5, lane 2). The total genomic DNA from the genomic tips is used as the input into the Microbiome Enrichment Kit to fractionate the nuclear from organellar DNA. The nuclear fraction obtained after fractionation does decrease in size, but remains centered around 50 kb (Figure 5, lane 4). This is not surprising, given that the relatively rougher handling of the nuclear fraction as elution from MBD2-Fc-bound beads requires heat and proteinase K digestion. Due to the limited mass, the organellar fraction was not run on PFGE, but subsequent analysis with the TapeStation indicated DNA >50 kb (data not shown). The organellar DNA obtained with differential centrifugation has an average mass of ~20 kb, likely caused by the extended organellar isolation protocol and the subsequent column-based DNA extraction and concentration. Gradient-based organellar isolation and alternate DNA extraction methods may maintain larger DNA fragment sizes. Regardless, DNA of the size obtained in this protocol may be used to generate 10- or 15-kb sequencing reads if care is taken during the library preparation.
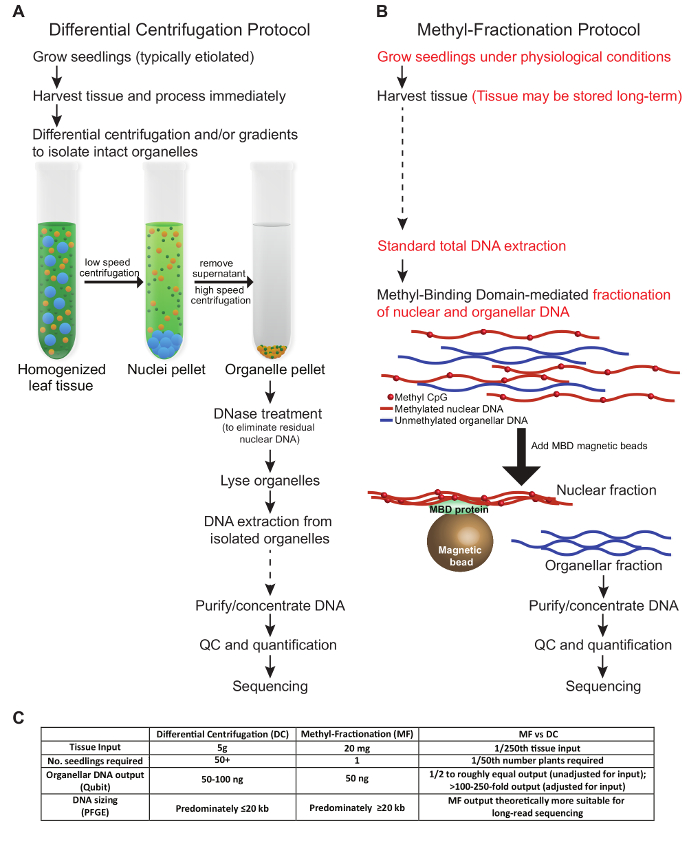
Figure 1: A Comparative View of Two Methods to Enrich for Plant Organellar DNA. A traditional DC protocol (A) is contrasted with the MF protocol (B). It is recommended to avoid freezing and thawing the samples; however, steps at which the samples may be stored long-term are indicated with dashed arrows (A and B). Key differences between the protocols are highlighted in red (B). (C) The table compares the methods in terms of tissue input, number of plants required, DNA output, and resulting DNA size. Please click here to view a larger version of this figure.

Figure 2: Assessment of Nuclear DNA Contamination in Organellar DNA Isolated Using two Methods. (A) The Cq (Y-axis) is the PCR cycle at which the fluorescence from the target amplification increases above the background fluorescence level. ACTIN is a nuclear-specific target gene, and NAD3 and PSBB are mitochondria- and chloroplast-specific, respectively. The error bars indicate the standard deviation among three technical replicates of each sample. DC – differential centrifugation method, Unmethylated – fraction of DNA not bound by MBD2-Fc, Total gDNA – genomic DNA not treated with MBD2-Fc, Methylated – fraction of DNA bound by MBD2-Fc.
(B) The table shows the Cq values, which are shown on the graph in (A), and the fold enrichment of the organellar amplicons relative to ACTIN. *Fold enrichment = 2(Cq ACTIN - Cq Target). The formula assumes a perfect efficiency of 2 for each primer set, since the minor deviation of each primer set from 2 is negligible and would have little effect on the calculation and overall trend (ACTIN = 1.961, NAD3 = 1.95, and PSBB = 1.989). Primer efficiencies were evaluated by making a standard curve with a series of five 1:10 dilutions of total genomic DNA. Please click here to view a larger version of this figure.

Figure 3: Read Mapping and Theoretical Coverage of Chloroplast and Mitochondrial Genomes. Percentage of reads mapped to the mitochondrial (A) or chloroplast (B) Chinese Spring reference genomes. Corresponding theoretical coverage of the Chinese Spring mitochondrial (C) or chloroplast (D) reference genomes, assuming genome sizes of 450 and 135 kb, respectively, calculated using the total read numbers and the percentage of reads mapping to the different genomes. Genome-wide distribution of coverage for organellar DNA from the MF method (E and G) or the DC method (F and H). The data in panels E-H is from the Chinese Spring etiolated sample, but all other samples showed a similar trend. (I) Average, lowest, and highest per-base coverage for all samples in panels A-D. Sample labels including "E" designate etiolated samples, and "NE" designates non-etiolated samples. DC indicates DNA isolated with the differential centrifugation method and Unmethylated indicates DNA that is in the unmethylated fraction after pulldown with MBD2-Fc (MF protocol). Samples labeled “Chris” designate wheat Triticum aestivum ‘Chris.’ CS designates samples of wheat Triticum aestivum ‘Chinese Spring. Note: Due to sequence homology between the chloroplast, mitochondria, and nuclear genomes resulting from ancient gene transfer between the organellar genomes as well as between the organellar and nuclear genomes, a small percentage of raw reads may map to multiple genomes. In addition, reads that do not map to either organellar reference genome are not represented in this figure. Hence, the percentages displayed here (A and B) do not total 100%. Please click here to view a larger version of this figure.

Figure 4: PE Read Mapping to the Wheat Nuclear Genome. Percentage of categories of PE read mapping types to the mitochondrial (A), chloroplast (B), or nuclear (C) Chinese Spring reference genomes. – E designates etiolated samples and – NE designates non-etiolated samples. DC indicates DNA isolated with the differential centrifugation method, Unmethylated indicates DNA that is in the unmethylated fraction after pulldown with MBD2-Fc in the MF protocol, and Methylated designates the nuclear fraction after MBD2-Fc pulldown. Samples labeled “Chris” designate wheat Triticum aestivum ‘Chris.’ CS designates samples of wheat Triticum aestivum ‘Chinese Spring.’ Unmapped reads are not shown. Please click here to view a larger version of this figure.

Figure 5: Examination of DNA Quality Using PFGE. Wheat total genomic DNA (lane 2), wheat organellar DNA obtained from differential centrifugation (lane 3), and the nuclear fraction after MF with the MBD2-Fc pulldown approach (lane 4) were subjected to PFGE on a 1% agarose gel with a 1 kb extended ladder used as a marker (lanes 1 and 5). Please click here to view a larger version of this figure.
| Buffer Name | Recipe | Notes | Method |
| STE Buffer | 400 mM sucrose, 50 mM Tris pH 7.8, 20 mM EDTA pH 8.0, 0.6% (w/v) polyvinylpyrrolidone (PVP), 0.2% (w/v) bovine serum albumin (BSA), 0.1% (v/v) β-mercaptoethanol (BME) | Buffer mix containing only sucrose, Tris, and EDTA can be made up to a month in advance and kept at 4°C. PVP, BSA, and BME should be added fresh to an aliquot of the required amount of buffer just before use. | Method #1 |
| ST Buffer | 400 mM sucrose, 50 mM Tris pH 7.8, 0.6% (w/v) polyvinylpyrrolidone (PVP), 0.1% (w/v) bovine serum albumin (BSA) | Buffer mix containing only sucrose and Tris can be made up to a month in advance and kept at 4°C. Note that the ST buffer does not contain EDTA or BME, and contains a lower concentration of BSA. | Method #1 |
| DNase stock | 2 mg/ml DNase in 0.15 M NaCl to a stock concentration of 2 mg/ml | Store 200 ul aliquots at -20°C. To prepare DNase working solution (200 μl of DNase solution per sample) see Table 1 below. See the full protocol below for full details of DNase digestion. DNase working solution should be prepared fresh. To stop the DNase reaction a 400 mM EDTA pH 8.0 solution is required (final concentration needed to stop the reaction is 0.2 M EDTA, see full protocol for details). | Method #1 |
| DNase working solution | 0.25 mg/ml DNase and 20 mM MgCl2 in ST Buffer | Prepare fresh, 200 ul per sample. Concentrations shown are for final reaction volume, so mix: 62.5 μl 2 mg/ml DNase (based on final 500 μl reaction volume), 4 μl 1M MgCl2 (based on 200 μl DNase solution volume), and 133.5 μl of ST buffer for a final volume of 200 μl. | Method #1 |
| Lysis Buffer | 20 mM EDTA pH 8.0; 10 mM Tris pH 7.9; 500 mM Guanidine-HCl; 200 mM NaCl; 1% Triton X-100; 0.5 mg/ml lysing enzymes from trichoderma harzianum | Mix all ingredients except for lysing enzymes and store at room temperature. Lysing enzymes should be added fresh to a small aliquot for immediate use. | Method #2 |
Table 1: Recipes of homemade buffers and working stocks.
| Concentration Worksheet | |||||||
| SAMPLE NAME | Empty Device Weight (g) | Weight of Filled Device (g) | Filled Volume (ul, filled minus empty weights) | Weight After 1st Spin (20 min*, g) | Volume After 1st Spin (ul, filled minus empty weights) | Weight After 2nd Spin (X min*, g) | Volume After 2nd Spin (ul, filled minus empty weights) |
| Note that the actual recovered volume will be a few ul less than calculated volume. | |||||||
Table 2: Concentration Worksheet.
| Name | Genome Specificity | Gene Sequence Source | Sequence (5’ – 3’) |
| Ta_ACTIN - F | Nuclear | Gramene Scaffold IWGSC_CSS_1AS_scaff_3272162: 10,663-12,557 | CAGGTATCGCTGACCGTATGA |
| Ta_ACTIN - R | Nuclear | Same as above | GAAGGTAGGGCTGAACAAGAAAC |
| Ta_NAD3 – F | Mitochondrial | NCBI accession EU534409.1 | GGTGATGCCAGAAGTCGTTT |
| Ta_NAD3 - R | Mitochondrial | Same as above | CAGATCAATCTTGTTAGGAGGTACTG |
| Ta_PSBB - F | Chloroplast | NCBI accession KJ592713.1 | GCTACCTTTGCTTTGCTCTTCT |
| Ta_PSBB - R | Chloroplast | Same as above | GCTGCCTGTTTCCTTGTAGTT |
Table 3: List of qPCR Primers.
Subscription Required. Please recommend JoVE to your librarian.
Discussion
To date, most organellar sequencing studies center on traditional DC methods to enrich for specific DNA. Methods to isolate organelles from diverse plants have been described, including moss40; monocots such as wheat15 and oats11; and dicots such as arabidopsis11, sunflower17, and rapeseed14. Most protocols focus on leaf tissue13,14,15,16,17, with some having been adapted for a variety of tissue types, including seeds11. The isolation of organelles from protoplasts has also been demonstrated41. However, this not amenable to all systems, nor is it feasible when the tissue of interest is limited. Many of these organellar isolation methods were designed to recover intact organelles for specific experiments, such as physiological studies. These protocols are cumbersome and typically require the use of density gradients, such as sucrose or Percoll gradients, which are very efficient at isolating specific organellar fractions but require a large tissue input (i.e., in excess of 5 g and upwards of kilograms, depending on the tissue type). However, the DC method may be optimized to enrich for specific cellular fractions, such as the mitochondria or chloroplast, by changing spin speeds and density gradients. In contrast, the MF approach requires far less starting material (20 mg), but mitochondrial and plastid DNAs will be present per their relative abundances in the tissue used for DNA extraction. Nonetheless, the MF protocol offers an alternative approach for isolating mixed organellar DNA and is particularly beneficial for starting with small amounts of tissue.
To assess sample purity following organelle isolation, most studies to date only use end-point PCR and gel electrophoresis11,12. This gives a fair qualitative measure of sample purity. However, low levels of amplification may not be visualized on an agarose gel. Few reports include more quantitative measures of quality control, such as qPCR14. For a quantitative assessment of DNA sample purity isolated from both methods, we utilized qPCR and sequencing to determine how much nuclear DNA remains in the sample, as well as the relative proportions of mitochondrial versus chloroplast DNA. Both methods evaluated here are efficient at removing nuclear DNA. Both methods yield a mix of mitochondrial and chloroplast DNA, albeit at different proportions.
Growing plants in the dark (etiolation) is reported to help facilitate organellar isolation due to a reduction of phenolics13. However, in this comparison, we did not find an appreciable advantage to working with etiolated tissue over light-grown samples. Although the proportion of specialized chloroplasts will likely be higher when light-grown, the total plastid number, as reflected in the proportion of reads mapping to the chloroplast genome, is unchanged under differing light conditions. Therefore, for downstream functional analyses, such as the assessment of heteroplasmy in different tissues or under different stressors or for expression analyses, we recommend performing genomic sequencing on plants grown under physiologically relevant conditions.
For application with short-read sequencing technologies, both techniques compared here yield adequate DNA quantity and quality. However, to achieve long reads of >20 kb for single-molecule sequencing applications, a greater amount of higher-quality DNA is necessary. For instance, ideally, > 1 µg of pure organellar wheat DNA with a molecular weight >20 kb is necessary for in-house, low-input protocols for 20-kb insert library preparations42. New user-developed, low-input protocols may reduce DNA requirements (i.e., to 50 ng or even less20), but the challenge remains to have high-quality, high-molecular weight DNA going into the library preparations. It is essential that a majority of the DNA is >20 kb, as smaller fragments will be preferentially inserted into the SMRTbell and throw off the size distribution of the library43. We tried a number of homemade DNA extraction protocols and a number of commercial protocols for DNA extraction (not shown). For wheat leaf tissue, the best balance between DNA quantity and quality, particularly length, was obtained using a commercial kit27,29. Depending on the plant species and tissue of interest, alternative extraction protocols may be equally suited or more fruitful. Nonetheless, we conclude that the total extraction of high-molecular weight genomic DNA >50 kb in size, followed by fractionation with the MBD2-Fc pulldown approach28, is amenable to long-read sequencing from limited starting material. Future work should test the limits of the starting material required following fractionation for long-insert library preparation and subsequent long-read sequencing. Critically, this approach could provide a robust method to isolate DNA from a subsample of a single leaf that is suitable for long-read sequencing, without whole-genome amplification. We anticipate that this approach will be easily adaptable to additional tissue types and broadly applicable to other plant species. It will be particularly useful in situations where the tissue amounts are limiting, such as sequencing at individual generations in a crossing scheme or in rarer tissue types.
Subscription Required. Please recommend JoVE to your librarian.
Disclosures
The authors declare that they have no competing interests.
Mention of trade names or commercial products in this publication is solely for the purpose of providing specific information and does not imply recommendation or endorsement by the US Department of Agriculture. USDA is an equal opportunity provider and employer.
Acknowledgments
We would like to acknowledge funding from the United States Department of Agriculture-Agricultural Research Service and from the National Science Foundation (IOS 1025881 and IOS 1361554). We thank R. Caspers for greenhouse maintenance and plant care. We also thank the University of Minnesota Genomics Center, where the Illumina library preparations and sequencing were performed. We are also grateful for the comments from the journal editors and four anonymous reviewers that further strengthened our manuscript. We also thank OECD for a fellowship to SK to integrate these protocols for collaborative projects with colleagues in Japan.
Materials
| Name | Company | Catalog Number | Comments |
| 2-mercaptoethanol (beta-mercaptoethanol; BME) | Sigma Aldrich | M3148-100ml | |
| 2-propanol (Isopropyl alcohol/isopropanol), bioreagent | Sigma Aldrich | I9516 | |
| agarose, Bio-Rad Cetified Megabase agarose | Bio-Rad | 1613108 | |
| analytical balance | Mettler Toledo | AB54-S | |
| balance | Mettler Toledo | PB1502-S | |
| bovine serum albumin (BSA) | Sigma Aldrich | B4287-25G | |
| Ceramic grinding cylinders, 3/8in x 7/8in | SPEX SamplePrep | 2183 | |
| Cryogenic Blocks compatible with tissue homogenizer for holding 50 mL tubes | SPEX SamplePrep | 2664 | |
| DNaseI | Sigma | DN25 | |
| ethanol, absolute | Decon Laboratories | 2716 | |
| Ethylenediamine Tetraacetic Acid (EDTA), 0.5 M Solution, pH 8.0 | Fisher | BP2482-500 | |
| gel imaging system | |||
| gel stain | Such as GelRed or Ethidium Bromide | ||
| grinding pestle, wide tip for 2 mL conical tubes | |||
| Guanidine-HCl, 8 M solution | ThermoFisher | 24115 | |
| LightCycler 480 SYBR Green I Master | Roche | 4707516001 | |
| liquid nitrogen | |||
| Lysing enzymes from Trichoderma harzianum | Sigma | L1412 | |
| Magnesium Chloride | G Bioscience | 24115 | |
| magnetic rack | ThermoFisher | A13346 | |
| microcentrifuge tubes, LoBind 1.5 mL | Eppendorf | 22431021 | |
| microcentrifuge tubes, standard nuclease-free 1.5 mL | Eppendorf | ||
| microcentrifuge, refrigerated | Sorvall | Legend X1R | Or equivalent product, must be capable of reaching at least 18,000 x g with rotors for 50 mL tubes, Oak Ridge tubes, and 1.5 mL tubes |
| microcentrifuge, room temperature | Eppendorf | 5424 | Or equivalent product, must be capable of reaching at least 18,000 x g with rotor for 1.5 mL and 2 mL microcentrifuge tubes |
| Microcon DNA Fast Flow Centrifugal Filter Units | EMD Millipore | MRCFOR100 | |
| Miracloth, 1 square per sample cut to fit funnel | EMD Millipore | 475855 | |
| NEBNext Microbiome DNA Enrichment Kit | New England Biolabs | E2612L | |
| parafilm | Parafilm M | PM992 | |
| plastic pots and trays | |||
| polyvinylpyrrolidone (PVP) | Fisher | BP431-100 | |
| Proteinase K | Qiagen | 19131 | |
| Pulsed-Field Gel Electrophoresis rig (e.g. CHEF DR III) | Bio-Rad | 1703697 | |
| purification beads, Agencourt AMpureXP beads | Beckman Coulter | A63881 | |
| QIAamp DNA Mini Kit | Qiagen | 51304 | |
| Qiagen 20/g Genomic Tip DNA Extraction Kit | Qiagen | 10223 | |
| Qiagen Buffer EB (elution buffer) | Qiagen | 19086 | |
| Qiagen DNA Extraction Buffer Set | Qiagen | 19060 | |
| QiaRack | Qiagen | 19015 | |
| qPCR machine (e.g. Roche Light Cycler 480) | Roche | ||
| qPCR plate sealing film | Roche | 4729757001 | |
| qPCR plate, 96 well plate | Roche | 4729692001 | |
| Qubit assay tubes | Life Technologies | Q32856 | |
| Qubit Broad Spectrum assay kit | Life Technologies | Q32850 | |
| Qubit High Sensitivity assay kit | Life Technologies | Q32851 | |
| RNaseA | Qiagen | 19101 | |
| Serological pipettes (20 mL) and pipet-aid | Fisher | 13-678-11 | |
| Small funnels, 1 per sample | |||
| Sodium Chloride | Ambion | AM9759 | |
| Soft paintbrush, 2 per sample | |||
| SPEX SamplePrep 2010 Geno/Grinder or another type of tissue homogenizer | SPEX SamplePrep | Or another comparable tissue homogenizer. If you do not have access to a tissue homogenizer, then grinding in a pre-chilled mortar and pestle will suffice (see protocol for details). However, a homogenizer will give more consistent results and total homogenization time is reduced. | |
| Sucrose | Omnipure | 8550 | |
| TBE | |||
| thermomixer | |||
| Tris | Sigma | T2819-100ml | |
| Triton X-100 | Promega | H5142 | |
| tube rotater | |||
| tubes, 50 mL conical polypropylene | Corning | 352070 | |
| tubes, 50 mL high-speed polypropylene | ThermoScientific/Nalgene | 3119-0050 | e.g. Nalgene Oakridge tubes or equivalent |
| vermiculite | |||
| water bath | |||
| water, sterile and certified Nuclease-free | Fisher | 1481 | |
| water, sterile milliQ |
References
- Liberatore, K. L., Dukowic-Schulze, S., Miller, M. E., Chen, C., Kianian, S. F. The role of mitochondria in plant development and stress tolerance. Free Radic Biol Med. 100, 238-256 (2016).
- Samaniego Castruita, J. A., Zepeda Mendoza, M. L., Barnett, R., Wales, N., Gilbert, M. T. Odintifier--A computational method for identifying insertions of organellar origin from modern and ancient high-throughput sequencing data based on haplotype phasing. BMC Bioinformatics. 16 (232), 1-13 (2015).
- Zhang, T., Zhang, X., Hu, S., Yu, J. An efficient procedure for plant organellar genome assembly, based on whole genome data from the 454 GS FLX sequencing platform. Plant Methods. 7 (38), 1-8 (2011).
- Wambugu, P. W., Brozynska, M., Furtado, A., Waters, D. L., Henry, R. J. Relationships of wild and domesticated rices (Oryza AA genome species) based upon whole chloroplast genome sequences. Sci Rep. 5 (13957), 1-9 (2015).
- Iorizzo, M., et al. De novo assembly of the carrot mitochondrial genome using next generation sequencing of whole genomic DNA provides first evidence of DNA transfer into an angiosperm plastid genome. BMC Plant Biol. 12 (61), 1-17 (2012).
- Park, S., et al. Complete sequences of organelle genomes from the medicinal plant Rhazya stricta (Apocynaceae) and contrasting patterns of mitochondrial genome evolution across asterids. BMC Genomics. 15 (405), 1-18 (2014).
- Skippington, E., Barkman, T. J., Rice, D. W., Palmer, J. D. Miniaturized mitogenome of the parasitic plant Viscum scurruloideum is extremely divergent and dynamic and has lost all nad genes. Proc Natl Acad Sci U S A. 112 (27), E3515-E3524 (2015).
- Wicke, S., Schneeweiss, G. M. Chapter 1. Next Generation Sequencing in Plant Systematics. Hörandl, E., Appelhans, M. , Koeltz Scientific Books. (2015).
- Sloan, D. B. One ring to rule them all? Genome sequencing provides new insights into the 'master circle' model of plant mitochondrial DNA structure. New Phytol. 200 (4), 978-985 (2013).
- Woloszynska, M. Heteroplasmy and stoichiometric complexity of plant mitochondrial genomes--though this be madness, yet there's method in't. J Exp Bot. 61 (3), 657-671 (2010).
- Ahmed, Z., Fu, Y. B. An improved method with a wider applicability to isolate plant mitochondria for mtDNA extraction. Plant Methods. 11 (56), 1-11 (2015).
- Ejaz, M., et al. Comparison of small scale methods for the rapid and efficient extraction of mitochondrial DNA from wheat crop suitable for down-stream processes. Genet Mol Res. 13 (4), 10320-10331 (2014).
- Eubel, H., Heazlewood, J. L., Millar, A. H. Isolation and subfractionation of plant mitochondria for proteomic analysis. Methods Mol Biol. 355, 49-62 (2007).
- Hao, W., Fan, S., Hua, W., Wang, H. Effective extraction and assembly methods for simultaneously obtaining plastid and mitochondrial genomes. PLoS One. 9 (9), e108291 (2014).
- Pomeroy, M. K. Studies on the respiratory properties of mitochondria isolated from developing winter wheat seedlings. Plant Physiol. 53 (4), 653-657 (1974).
- Taylor, N. L., Stroher, E., Millar, A. H. Arabidopsis organelle isolation and characterization. Methods Mol Biol. 1062, 551-572 (2014).
- Triboush, S. O., Danilenko, N. G., Davydenko, O. G. A method for isolation of chloroplast DNA and mitochondrial DNA from Sunflower. Plant Mol Biol Rep. 16 (2), 183-189 (1998).
- Pinard, R., et al. Assessment of whole genome amplification-induced bias through high-throughput, massively parallel whole genome sequencing. BMC Genomics. 7 (216), 1-21 (2006).
- Lamble, S., et al. Improved workflows for high throughput library preparation using the transposome-based Nextera system. BMC Biotechnol. 13 (104), 1-10 (2013).
- Raley, C., et al. Preparation of next-generation DNA sequencing libraries from ultra-low amounts of input DNA: Application to single-molecule, real-time (SMRT) sequencing on the Pacific Biosciences RS II. bioRxiv. , (2014).
- Tsai, Y. C., et al. Resolving the Complexity of Human Skin Metagenomes Using Single-Molecule Sequencing. MBio. 7 (1), e01948 (2016).
- Feehery, G. R., et al. A method for selectively enriching microbial DNA from contaminating vertebrate host DNA. PLoS One. 8 (10), e76096 (2013).
- Yigit, E., Hernandez, D. I., Trujillo, J. T., Dimalanta, E., Bailey, C. D. Genome and metagenome sequencing: Using the human methyl-binding domain to partition genomic DNA derived from plant tissues. Appl Plant Sci. 2 (11), 1-6 (2014).
- Noyszewski, A. K., et al. Accelerated evolution of the mitochondrial genome in an alloplasmic line of durum wheat. BMC Genomics. 15 (67), 1-16 (2014).
- Qiagen. QIAamp DNA Mini and Blood Mini Handbook. , 5th ed, Available from: https://www.qiagen.com/ch/resources/ (2016).
- E.M. Corporation. User Guide: Microcon Centrifugal Filter Devices. , Available from: http://www.emdmillipore.com/US/en/product/Microcon-DNA-Fast-Flow-Centrifugal-Filter-Unit-with-Ultracel-membrane,MM_NF-MRCF0R100 (2013).
- Qiagen. User developed protocol: Isolation of genomic DNA from plants and filamentous fungi using the QIAGEN Genomic-tip - (EN). , Available from: https://www.qiagen.com/ch/resources/ (2001).
- New England BioLabs, Inc.. NEBNext Microbiome DNA Enrichment Kit: Instruction Manual Version 4.0. , Available from: http://www.neb.com/~/media/Catalog/All-Products/371BCB5A557C462D95D1E45E15BBFEA3/Datacards or Manuals/E2612Manual.pdf (2015).
- Qiagen. QIAGEN Genomic DNA Handbook. , Available from: https://www.qiagen.com/ch/resources/ (2012).
- PacificBiosciences. Guidelines for Using the BIO-RAD® CHEF Mapper® XA Pulsed Field Electrophoresis System. , Available from: http://www.pacb.com/wp-content/uploads/Unsupported-Guidelines-Using-BIO-RAD-CHEFMapper-XA-Pulsed-Field-Electrophoresis.pdf (2016).
- Andrews, S. FastQC: A quality control tool for high throughput sequence data. , Available from: http://www.bioinformatics.babraham.ac.uk/projects/fastqc/ (2016).
- Bolger, A. M., Lohse, M., Usadel, B. Trimmomatic: a flexible trimmer for Illumina sequence data. Bioinformatics. 30 (15), 2114-2120 (2014).
- Ogihara, Y., et al. Structural dynamics of cereal mitochondrial genomes as revealed by complete nucleotide sequencing of the wheat mitochondrial genome. Nucleic Acids Res. 33 (19), 6235-6250 (2005).
- Ogihara, Y., et al. Structural features of a wheat plastome as revealed by complete sequencing of chloroplast DNA. Mol Genet Genomics. 266 (5), 740-746 (2002).
- International Wheat Genome Sequencing Consortium (IWGSC). A chromosome-based draft sequence of the hexaploid bread wheat (Triticum aestivum) genome. Science. 345 (6194), (2014).
- Langmead, B., Salzberg, S. L. Fast gapped-read alignment with Bowtie 2. Nat Methods. 9 (4), 357-359 (2012).
- Bendich, A. J. Why do chloroplasts and mitochondria contain so many copies of their genome? Bioessays. 6 (6), 279-282 (1987).
- Kumar, R. A., Oldenburg, D. J., Bendich, A. J. Changes in DNA damage, molecular integrity, and copy number for plastid DNA and mitochondrial DNA during maize development. J Exp Bot. 65 (22), 6425-6439 (2014).
- Ma, J., Li, X. Q. Organellar genome copy number variation and integrity during moderate maturation of roots and leaves of maize seedlings. Curr Genet. 61 (4), 591-600 (2015).
- Lang, E. G., et al. Simultaneous isolation of pure and intact chloroplasts and mitochondria from moss as the basis for sub-cellular proteomics. Plant Cell Rep. 30 (2), 205-215 (2011).
- Tobin, A. K. Subcellular fractionation of plant tissues. Isolation of chloroplasts and mitochondria from leaves. Methods Mol Biol. 59, 57-68 (1996).
- PacificBiosciences. Procedure & Checklist - 10 kb to 20 kb Template Preparation and Sequencing with Low (100 ng) Input DNA. , Available from: http://www.pacb.com/wp-content/uploads/Procedure-Checklist-10-20kb-Template-Preparation-and-Sequencing-with-Low-Input-DNA.pdf (2015).
- PacificBiosciences. Template Preparation and Sequencing Guide. , Available from: http://www.pacb.com/wp-content/uploads/2015/09/Guide-Pacific-Biosciences-Template-Preparation-and-Sequencing.pdf (2014).
