Here we describe a simple protocol for rapidly producing hundreds of nematode growth media agar, 96-well culture plates with consistent numbers of Caenorhhabditis elegans per well. These cultures are useful for the phenotypic screening of whole organisms. We focus here on using these cultures to screen chemicals for pro-longevity effects.
Method Article
A Simple Method for High Throughput Chemical Screening in Caenorhabditis Elegans
In This Article
Summary
Abstract
Caenorhabditis elegans is a useful organism for testing chemical effects on physiology. Whole organism small molecule screens offer significant advantages for identifying biologically active chemical structures that can modify complex phenotypes such as lifespan. Described here is a simple protocol for producing hundreds of 96-well culture plates with fairly consistent numbers of C. elegans in each well. Next, we specified how to use these cultures to screen thousands of chemicals for effects on the lifespan of the nematode C. elegans. This protocol makes use of temperature sensitive sterile strains, agar plate conditions, and simple animal handling to facilitate the rapid and high throughput production of synchronized animal cultures for screening.
Introduction
Here a protocol is described that was developed for high throughput screening of chemical compounds for effects on Caenorhabditis elegans lifespan. The protocol itself is readily adaptable to other phenotypic screens, including studies utilizing reporter C. elegans strains. This protocol was successfully utilized to identify a novel biologically active compound, NP1 (nitrophenyl-piperazine 1), that strongly extends the lifespan of C. elegans through a dietary restriction mechanism. NP1 and a characterization of its effect on lifespan, including a description of the genetic pathways at play, was previously described elsewhere1. That report also includes a description of the results from a large-scale implementation of the screen. Here we describe in much greater detail the methodology and setup of the screen itself, which is scalable for both small- and large-scale applications.
The goal that led to the creation of the protocol described here was to develop a C. elegans culture platform that allowed for the rapid screening of large chemical libraries for novel biologically active compounds. While chemical screens have been performed prior to the development of this protocol, these were mainly small-scale and/or candidate type approaches2,3. Indeed, most of the screens performed in the lab on tens of compounds utilized stress resistance assays, with hits being screened for longevity effects4. This study sought instead to directly screen for lifespan effects. Remarkably, there were few descriptions in the scientific literature at the time of performing large scale chemical screens with C. elegans. Indeed, compared to other types of screens5,6,7, large-scale chemical screening using C. elegans seemed to be under-employed.
There were two descriptions of large scale chemical screens in C. elegans that were used as a basis to develop this approach. The first of these was an elegant study from Peter Roy's laboratory using chemical screens to identify compounds that could perturb the development of animals. The study then followed up with a forward mutagenesis screen to identify the genetic targets of these chemicals8. The protocol described in that study used 24-well pates, which was simply unworkable for this study's specific needs (limited amounts of chemical in the library and limited available incubator space). The other study was Michael Petrascheck's innovative and ambitious small-molecule screen for lifespan extending chemicals9,10. That study used 384-well plates and liquid cultures. The other main feature of this screen was the use of FUDR (5-fluorodeoxyuridine) to chemically inhibit progeny production. After considerable consideration of the protocol described in that study, both chemical sterilization and liquid cultures of C. elegans were avoided.
Although FUDR is widely used in C. elegans lifespan experiments, there were concerns that FUDR might cause unanticipated drug interactions, or that FUDR itself may have some effect on lifespan. Recently this latter concern has been validated, at least at some concentrations and in particular at 25 °C11. To circumvent the problem of progeny contamination, C. elegans strain TJ1060 was used, which harbors two independent temperature sensitive mutations (spe-9(hc88)I; rrf-3(b26)II) that abolish sperm production and have been demonstrated to be useful for mass cultures of synchronous populations12. This strain was completely sterile at 25 °C, but will produce progeny when cultured at 15-20 °C. This study used conventional culture conditions, with worms crawling on the surface of agar, as results obtained with liquid cultures are not always reproducible with conventional agar plates. While this phenomenon is not completely understood, it has been demonstrated that worms cultured in liquid respond to DR (dietary restriction) in a different manner than worms cultured on standard media13,14. It is therefore plausible that liquid media could mask some DR mimetics that would otherwise be identified with the screen.
Having settled on agar culture conditions, different options for scoring the performance of wells in this assay were considered. While various automated or imaging based assays were available, they necessitated acquisition and deployment of technically challenging devices, most of which were prohibitively expensive. Whilst considering these options, it was essential to refer to previous lifespan screens of all types. Ultimately, this study used a scoring method adapted from the Siu Sylvia Lee Lab's whole genome RNAi screen for lifespan phenotypes15. Specifically, all lifespan plates were set up in the same manner, but only the negative controls were monitored. Once the negative control plates were confirmed to have near complete mortality, test plates were scored by hand. In this large-scale screen, positives were confirmed by re-testing with freshly prepared chemicals, using triplicate repeats of the primary positives.
Protocol
1. Preparing Buffers
- LB broth
- Use pre-mixed granules (see Materials Table) and follow manufacturer's protocol for preparation.
- Nematode Growth Media (NGM) Agar
- Mix 23 g of agar, 3 g of NaCl, 2.5 g of bacto peptone, and deionized water to 0.972 L. Autoclave and let cool to 60 °C, then add 25 mL of 1 M potassium phosphate (KPO4) buffer (pH 6.0), 1 mL of 1 M magnesium sulfate (MgSO4), 1 mL of 1 M calcium chloride (CaCl2), and 1 mL of 5 mg/mL cholesterol (in ethanol).
- Hypochlorite solution
- Mix 5 mL of 5 M KOH, 4 mL of sodium hypochlorite solution (6%), and deionized H2O to a total volume of 50 mL.
- S basal
- Mix 5 g of NaCl, 1 g of K2HPO4, 6 g of KH2PO4, and de-ionized water to 1 L, then autoclave.
2. Preparation of Concentrated E. coli (OP50)
NOTE: This step concentrates 1 L of a saturated E. coli solution into 25 mL of S basal buffer.
- Inoculate 5 mL of autoclaved LB broth (step 1.1) with a single colony of E. coli (Strain OP50), and incubate for 4-6 h at 37 °C with shaking (250 rpm). Use 0.1 mL of this solution to inoculate 1 L of LB in a 2 L Erlenmeyer flask. Incubate the 1 L flasks overnight (12-16 h) at 37 °C with shaking (250 rpm).
- Centrifuge 1 L overnight cultures in 500 mL centrifuge bottles for 5 min at 10,000 x g and 4 °C to pellet the bacteria and decant away remaining media. Resuspend pellet in 25 mL of S Basal (step 1.4). Store at 4 °C.
3. Preparation of NGM Culture Plates
- For mass culture plates used to produce large numbers of worms, dispense 30 mL of molten (60 °C) NGM agar (step 1.2) in a laminar flow cabinet onto 10 cm culture plates with an automated fluid dispensing apparatus or a serological pipette. Allow to dry overnight.
- Pipet 2 mL of concentrated OP50 onto each 10 cm plate, spread to completely cover the agar surface by tilting and rotating the plate, then allow plates to dry. Store plates at 4 °C for up to 2 weeks.
- For high throughput assay culture plates used for screening, utilize an automated 8 channel dispenser to dispense 0.15 mL of molten NGM agar into each well of a 96 well plate in a laminar flow cabinet. Use care to make sure wells are devoid of bubbles, as these will enable burrowing of worms that will compromise the assay in that well. Allow to dry overnight. Store plates at 4 °C for up to 2 weeks.
4. Preparation of Temperature Sensitive (ts) Sterile C. Elegans Mass Cultures
- To start cultures, using a 'worm pick' (a glass pipette with an attached platinum wire or a manufactured worm pick) under a dissecting microscope, transfer 20 eggs (strain TJ1060: spe-9(hc88)I; rrf-3(b26)II) onto mass culture plate(s) prepared in step 3.1. Then, incubate plates at 20 °C for 6 days (allows for more than one generation of growth, as you are targeting for collection of the progeny of the 20 eggs moved).
- Visually confirm presence of gravid adults (eggs present in the uterus) with a dissecting microscope. Collect the gravid adults by dispensing 2-3 mL of S basal onto the plate using a glass pipette. Swirl the liquid around the plate by hand, then collect the liquid into a 15 mL tube using a glass pipette.
- Spin down the tube (1,000 x g for 1.5 min at 20 °C) to pellet worms, then aspirate off supernatant. Add 10 mL hypochlorite solution (step 1.3) to the worm pellet and rapidly shake the tube by hand in a top-to-bottom direction for 5 s. Incubate for 5 min, shaking every 2.5 min.
- Again, spin down the tube (1,000 x g for 1.5 min); the pellet should be yellowish-brown. Aspirate off the supernatant. Add 10 mL hypochlorite solution to the egg pellet and vigorously shake the tube. Incubate 1-3 min, with occasional shaking, and while monitoring appearance with the dissecting microscope. Visually confirm only eggs are remaining, and proceed to the next step.
- Spin down the tube (1,000 x g for 1.5 min) and aspirate off the supernatant. The pellet should be white with no brown coloration.
NOTE: After the removal of the hypochlorite solution, it is critical to use sterile techniques and buffers, since contamination (bacterial and fungal, in particular) can ruin the experiment, wasting valuable time and reagents. This study used a filtered laminar flow cabinet and moved liquids using only sterile pipettes and tips. - Open the tubes in a sterile space. Wash the pellet 3 times with S basal, spinning down (1,000 x g for 1.5 min) and aspirating away the supernatant each time. Re-suspend the egg pellet in 2-3 mL S basal. These eggs can now be used for an overnight hatch in buffer to collect L1 larva (step 5).
5. Hatching C. Elegans Eggs in Buffer to Get Synchronous Cultures (Preparing L1 Larval C. Elegans )
- Decant the egg pellet and buffer into a sterile glass petri dish with a cover. Rinse the remaining eggs from the tube into a dish using a serological pipette with 2-3 mL of S basal. Add 5 mL of S basal to ease crowding, as this may encourage hatching, as will light shaking (20 rpm with a belly dancer orbital shaker). Incubate overnight at 20 °C, to allow eggs time to hatch (16-24 h). All hatchlings will arrest at the 1st larval stage (L1) due to the absence of food.
NOTE: Anecdotal evidence indicates that fresh L1 preparations (16-36 h after egg collection) generate the most synchronous populations of adult worms. - Collect L1s in a 15 mL tube with a serological pipette. Spin down L1s in a centrifuge (1,000 x g for 1.5 min), aspirate away the supernatant, and repeat until all L1s have been collected from hatching plates, while leaving 10 mL of S basal for next step.
- From the tube containing L1s, micropipette out 0.01 mL (immediately after mixing) and dispense it onto an unseeded (no E. coli) NGM plate. Count the number of L1s on the plate. Repeat 10 times and obtain an average for the number of L1s in each aliquot. Generally, expect between 1-3 L1s per µL (when starting with 1 mass culture plate containing 20 eggs).
- Determine with a serological pipette the volume of S basal holding the L1s. Then extrapolate with the determined average number of worms per 0.01 mL, obtained in the previous step, to estimate the total number of L1s. Generally, expect between 10,000-30,000 L1s (per mass culture plate containing 20 eggs).
- To use this culture in 96-well assay, dilute the L1 suspension to 1 L1 per µL in a sterile round media bottle, then proceed to step 7. If this culture is to be used to generate additional C. elegans mass cultures, then proceed to step 6.
6. Large Scale Synchronous Culture Preparation
NOTE: L1 solutions can be used to quickly increase worm populations.
- To generate large worm numbers with an L1 solution, dispense up to 5,000 L1s on each of the desired number of mass culture plates. Collect gravid adults 2.5 days later (20 °C) as described in steps 4.1-2, and proceed to step 4.3 to collect the eggs.
- As it has been anecdotally observed that repeated hypochlorite collection can stress the subjugated population, split populations by picking eggs for propagation prior to subjecting the remaining population to hypochlorite treatments, so that multiple generations of the population are not repeatedly subjected to hypochlorite solution treatment.
7. Setup of 96-Well Assay Plates
- Allow the assay plates (prepared in step 3.3) to reach room temperature. Then, in a laminar flow cabinet, add 5 µL of concentrated OP50 (prepared in step 2.2) to each well. As before, use an automated 8 channel dispenser.
- Add 10 µL of L1 suspension to each well using an automated 8 channel dispenser. This will yield on average 10 worms per well, since they are present in the suspension at 1 L1 per µL. To promote equal distribution of L1s from the slurry, dispense L1s from a round media bottle actively mixed with a moderately slowly turning stir bar.
- Cover plate with lid, box batches of plates, and incubate at 25 °C for 2 days.
8. Treating 1 st Day Adult C. elegans with Chemicals
- Remove chemical library plates from the freezer, and allow plates to reach room temperature before proceeding.
NOTE: Chemical library plates as described here are 96 well plates containing discrete compounds in each well, all of which are at the same concentration and dissolved in DMSO. These libraries do not utilize the outer columns, and so each plate has a maximum of 80 distinct chemicals. In the protocol described here, the library concentration is 10 mM. It is important to consider solvent effects on phenotypes. While this study screens at a DMSO concentration of 0.5%, this level was never exceeded in these lifespan assays and in low throughput assays, where it is more likely to pick a compound stock solution concentration. This protocol does not exceed 0.25%, which is a level at which lifespan modifications do not occur16, at least in the N2 strain. - Gently shake plate at 60 rpm on a microplate shaker for 1 min immediately prior to use.
- Using an automated 96-well liquid handler, transfer 0.75 µL of compound (or DMSO) from the library plate to the assay plate. The depth of the pipette during liquid delivery to the assay plate is controlled carefully, such that the pipette tips of the liquid handler are delivering the 0.75 µL volume to the ~15 µL of liquid on the surface of the agar (with worms and concentrated OP50 from steps 7.1-2) and does not pierce the agar surface in the well. Do not use manual 8 or 12 multi-channel pipettes except in very small screens (<10 plates), as they can increase error and often result in puncturing of the agar surface, which compromises the assay.
- Prepare chemical library negative control plates with DMSO (dimethyl sulfoxide), assuming the library being tested uses DMSO as the solvent. Make 1 negative control plate for every 5 test plates, up to 10 negative control plates. If possible, also make a positive control plate (NP11 at 20 mM, for a final assay concentration of 0.1 mM, is effective for this purpose; see Representative Results section). Do not add chemicals (test or control) to the 2 exterior columns of the plates, as they are particularly susceptible to desiccation.
9. Drying Cultures
- To remove liquid from the surface of the agar, dry plates in the laminar flow cabinet for 4-8 h. It is critical that these plates are dried completely but do not become desiccated. As some plates will take longer to dry than others, monitor all plates closely and remove as soon as they are dry. Confirm drying by careful visual inspection of the individual wells of the plate.
NOTE: Depending on factors that include the exhaust rate of the cabinet, the time this takes must be empirically determined. This drying step can take about 4-8 h for a full cabinet. - Seal plates with transparent film, then put on the plate lids.
- Spin the 96-well assay plates for 45 s at 1,000 x g.
- Store plates inverted at 25 °C.
10. Scoring C. Elegans Cultures for Longevity
- Monitor negative control plates until >95% mortality is observed. Check plates weekly for the first two weeks and daily thereafter. Caenorhabditis cohorts of the same strain and species can display significantly different lifespans by trial17.
NOTE: For the lifespan assay described here, with TJ1060 animals cultured at 25 °C, 95% mortality in these populations has occurred from adult day 16-20. - When negative control wells are considered to have reached the >95% mark, spin down all 96-well assay plates for 45 s on a table top centrifuge with a microplate adapted rotor (250 x g for 45 s at 20 °C).
- Score all wells in the control plates. This is done by counting and recording the number of alive and dead animals in each well. Dead worms can be differentiated from alive worms by their complete lack of movement. Provoke movement in alive worms by dropping the 96 well plate from approximately 7 cm onto the dissecting microscope surface while looking through the eyepiece for any evoked response. Dead worms will not respond, and nearby lab mates may not appreciate the repetitive noise.
- For the test plates, count and record only wells containing live worms. When a live worm is observed, count all alive and dead animals in that well, along with the well position and plate.
NOTE: It is often useful to re-score the plates after >99% of negative control worms are dead. In large scale screens, this may be the best point to do the initial scoring. In either case, score/re-score as described above
11. Re-Testing Compounds
- When testing only a small number of candidate compounds (<320 compounds), as with a re-test or a candidate screen (see Representative Results), restrict the assay to the 32 central wells in an effort to minimize possible plate effects. This leaves the 2 wells closest to the edge of the plate untreated but still containing agar, food, and worms.
Results
We begin by examining representative results from employing this protocol for 96-well lifespan assays. In the first example, the method was used to screen through 30,000 chemicals to successfully identify chemicals that extend the lifespan of C. elegans, and also includes results from the follow-up re-test screen of the best performing chemicals using the same protocol. These results were previously described1. The second example uses the same protocol in a smaller-scale screen of candidate compounds.
Large-scale screen and re-test: The large-scale screen testing 30,000 compounds was performed at a single dose, in duplicate. Each chemical was therefore tested in two wells with an expected total animal population of 20. To accomplish this, three discrete sets of 10,000 compounds (in duplicate) were screened over a period of ~3 months to cover the entire 30,000 compounds. This was done in part, to ensure a manageable amount of manual scoring at the end of the assay and required a total of 260 of the 96-well assay plates in each of the sets. In library stock plates, only 80 wells contained compound; one replicate of 10,000 compounds makes 125 assay plates. This study used 2 replicates with 10 negative control plates in each set. To increase throughput, plates were scored when negative control populations were assessed to have experienced ~99% mortality. All test wells were then examined for live worms.
Chemicals in wells with one live worm were called hits. Chemicals in wells containing more than 1 worm alive were also called hits, and additionally all the worms in those wells (alive and dead) were counted to generate a simple score (percent alive score; the number of alive worms divided by the number of dead worms). Each chemical in the library could therefore be called a hit twice and those hits could, but might not, have scores associated with them. 512 distinct chemicals were called hits (at least once) from the screen of 30,000 compounds. The screen was performed with the intention of identifying potent and/or robust (reproducible) pro-longevity effects. These two different properties may have distinct effects. Potent chemicals could dramatically increase lifespan, in which case we would expect a high percent of worms to be alive in that chemical's well. For robust chemicals, both replicates would be expected to have live worms. The hit list was ranked based on these criteria. 179 of the chemicals yielded high percent alive scores, or were hit in both replicates and were therefore chosen for re-testing. Most of the remaining chemicals that were called hits, but not selected for re-testing, had only contained a single worm alive in one of the replicate wells.
Re-testing of the hits was performed, similar to the primary screen except with 3 replicates (expected total animal population of 30), and careful quantification of the lifespans of the animals in the untreated control plates. These changes were added to aid in comparing the test and control wells. 179 of the chemical hits were re-ordered, diluted to 10 mM, and moved into 96 well plates. Only the inner 24 wells were used for the re-test assay (current versions of this protocol would have used the inner 32 wells as described in the protocol section for re-test screens) and the compounds were re-tested in triplicate with six negative control assay plates treated with DMSO solvent. One negative control plate was scored periodically for total survival (Figure 1A). When approximately 95% of control animals were dead, all plates were completely scored (all treated live and dead worms were counted).
To call hits from the re-test results, a cut-off was made at the average percent alive score of the negative control +2 standard deviations (SD). For the test wells, averaged percent alive (at the time of scoring) scores were calculated by averaging the percent alive score from three replicates for each well. For this particular assay, negative control wells' average percent alive scores were calculated as the average of three replicates for 48 wells (2 sets of triplicate negative control plates). The SD used to call hits from the re-test chemical set was the SD across the 48 negative control averaged percent alive scores. Using this strategy, this study found 57 hits from the re-test library of 179 compounds, demonstrating that a total of 32% of the re-test chemicals tested positive (Figure 1B). Binning of the averaged percent alive scores for the negative control and test wells indicated that the test wells outperformed the control wells (Figure 1C).
Candidate screen: Small scale screens can be performed in a manner similar to the retest described above. Here, we describe the results from a candidate screen with 139 compounds. These candidates were assembled as structures likely to promote longevity. For this screen, we performed 5 replicates of the test plates at two different doses (50 µM and 100 µM). Additionally, we used 8 negative control plates, with a single positive control (NP1) plate containing two different doses; 50 µM and 100 µM.
Negative control plates were monitored until ~90% of animals were dead. At that time, wells were scored by counting live and dead worms in all control wells, and from test wells that contained live worms. The percent alive at the time of scoring were used to calculate averaged percent alive scores for each well. For the negative controls, 32 wells had percent alive scores from 8 replicates. For the positive controls, there were 4 well scores averaged across 4 replicates for each dose. Hits were called for wells with an averaged percent alive score that was greater than the averaged negative control percent alive score +2 SD. This cutoff left 14 hits from the candidate screen and excluded all of the negative control wells. That cutoff also included all of the positive control wells treated at 100 µM and 50% of the positive controls treated at 50 µM. These results are presented here as binned averaged percent alive scores for both the 50 µM (Figure 2A) and the 100 µM (Figure 2B) test screens.
Finally, all plates were re-scored at a late time point, which corresponded to a time when greater than 99% of the negative control treated animals were dead. Those results indicated that the positive control wells far out-performed the negative control and test wells (Figure 2C). While the test wells were slightly better than the negative controls. This latter result is biased by the indication that many of the test wells appeared to exhibit toxicity relative to the control treatment (Table 1), thereby confounding this simple interpretation. This was to be expected, since the candidate library was a true screen of chemicals with unknown biological activity in C. elegans, while the re-test screen was essentially pre-screened for compounds that were not toxic. Since this primary screen was for compounds that lengthened lifespan, significantly toxic chemicals should not have been in the re-test set.
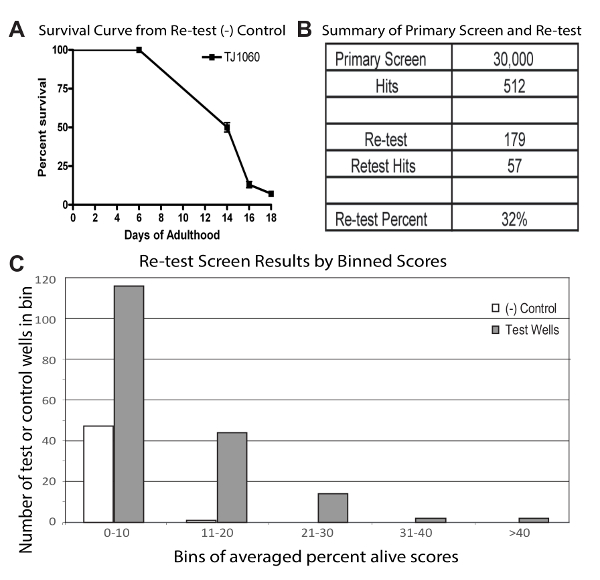
Figure 1: Representative results from a high throughput screen and re-testing
(A) Survivorship curve from a representative negative control plate used in the re-test assay. This curve was constructed from scoring all live and dead worms in the 24 wells used in this assay 4 times over the 18 days of the assay. At day 18 of adulthood, controls were assessed to have ~5% survival and all control test and plates were then also scored. (B) Table summarizing the results of the screen and re-test. (C) Binning of the wells averaged percent alive scores for both control and test conditions from the re-test screen. For controls, scores are from 48 wells each consisting of the average of 3 replicates. Test results are from 179 wells each consisting of the averaged score from three replicates. Figure 1 is reproduced from a previous publication1. Please click here to view a larger version of this figure.
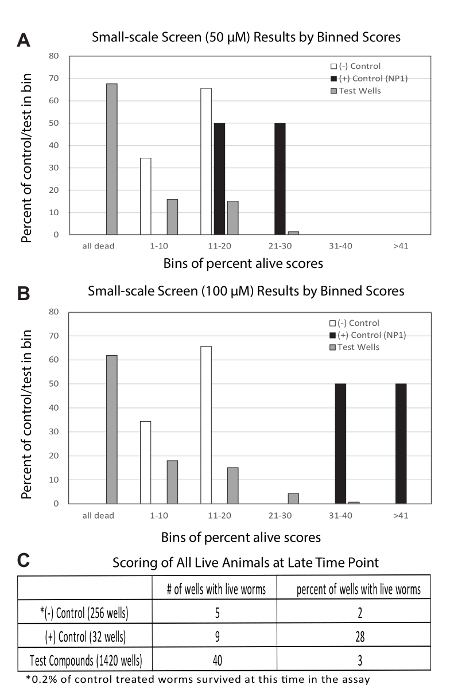
Figure 2: Representative results from a candidate screen
(A) Binning of the results from the 50 µM candidate screen. The 139 test-well results represent the averaged percent alive score from 5 replicates. The 32 negative control results consist of averaged percent alive scores from 8 replicates. The 4 positive control results consist of averaged percent alive scores from 4 replicates (16 total wells containing NP1 at 50 µM). (B) Binning of the results from the 100 µM candidate screen. All is the same as in (A), except that the test wells and positive controls were treated at 100 µM concentrations. The same negative control plates are shown in both (A and B). (C) Representative results from re-scoring the plates at a relatively extreme late time point. Positive controls dramatically outperformed all others, if just accounting for the percent of wells with live worms at this time point, which is biased against test wells as described in main text and Table 1. Please click here to view a larger version of this figure.
| Binning of Averaged Percent Alive Scores | ||||||
| Grouped Scores | All Dead (0) | 1-10 | 11-20 | 21-30 | 31-40 | >41 |
| Re-test | ||||||
| # of (-) Control | 16 | 31 | 1 | 0 | 0 | 0 |
| # of Test Wells (50µM) | 46 | 69 | 50 | 8 | 3 | 3 |
| Candidate Screen | ||||||
| # of (-) Control | 0 | 11 | 21 | 0 | 0 | 0 |
| # of (+) Control (50µM) | 0 | 0 | 2 | 2 | 0 | 0 |
| # of (+) Control (100µM) | 0 | 0 | 0 | 0 | 2 | 2 |
| # of Test Wells (50µM) | 94 | 22 | 21 | 2 | 0 | 0 |
| # of Test Wells (100µM) | 86 | 25 | 21 | 6 | 1 | 0 |
Table 1: Representative results from binning different screens
Here we present the binning of the averaged percent alive scores from the two screens (re-test and candidate). In the re-test screen, the peak is similar to the negative control with the re-tests outperforming the negative control dramatically on the right (long-lived) side of the table. This indicates the presence of multiple pro-longevity compounds present in the re-test set. In the candidate screen, we see that the peak is in the all dead category, while there is also an apparent signal from the right side of the table. This indicates the presence of pro-longevity compounds in the candidate set, but also indicates the presence of significant toxicity among the candidate set of compounds.
Discussion
Here we have described a simple method for culturing C. elegans in 96-well plates. We describe these cultures for use in chemical screening and lifespan assays, but they can be used for many types of assays. While multi-well culture conditions for chemical screening have previously been reported8, including for lifespan analysis10, the assay described here differs in several ways. The lifespan assay described here utilizes 96-well plates, relies on sterile mutants (instead of chemical sterilization), uses agar culture conditions, uses simple liquid handling to move worms, and is manually scored at the endpoint. The different approaches used in this assay may be of help to researchers looking for screening methods that include these conditions.
Crucial elements to this protocol mainly center on the quality of the plates produced for the assay. First, when making plates it is imperative that the agar surface is free of bubbles and other imperfections. These variations in the agar surface almost always lead to burrowing and loss of the well. Second, this protocol relies on drying off liquids deposited during the setup and drugging stages. It is critical that these liquids are completely removed, but the agar does not become dried out. Anecdotally, it appears that worms in wells that are not completely dried (swimming in liquid) live longer than properly dried wells, while over-drying of the plates leads to desiccation and cracking of the agar, which leads to worm burrowing and loss. Another crucial element of this protocol is maintaining sterile conditions. As with any lifespan assay, there is a lot of work involved with the plate setup, and many opportunities and time exist for assay ruining contamination to settle and grow on the plates.
While the lifespan assay described here is useful for screening of compounds in C. elegans, it is limited to particular genetic backgrounds, as it relies on a temperature sensitive (ts) sterile strain; we used TJ1060, which has high sterility penetrance. This restricts the strains available for screening with this method. Alternative approaches including crossing ts sterile mutations into the desired background or using chemical sterilization. We have not tried chemical sterilization with this assay, but it should be possible. Potential hurdles include placing the sterilizer on the worms at the correct stage and in the proper dose. The protocol described here uses a liquid dispenser that is fast, but does not appear to dispense adults effectively. So, these worms develop on the plates and therefore must be treated with the sterilization chemical on the plates. Determining the optimal dose and timing would be important for success. Alternative strategies include using a dispensing method that can move adults. In the past, we have found that machines able to identify and sort adults are generally much slower than the simple liquid handlers, which can dispense homogenous slurries of suspended larva.
In general, we use this method to rapidly screen chemicals and treatments for large positive effects on lifespan. The method is particularly effective when used with multiple doses, high replicate numbers, and close monitoring of negative controls that are always maintained and interspersed among the test plates. Positive controls are also useful when designing and implementing the screens described in this manuscript. However, to be an effective positive, the control would need to be fairly potent and/or highly robust. When the screen was originally deployed, a suitably potent and robust compound could not be identified. Currently, there are many reports in the 'aging' literature of likely candidates for positive controls useful in the screens described here. As described in the candidate screen section of the expected results section of this manuscript, and in Figure 2 and Table 1, the compound NP1 is an effective positive control for this screen. We generally confirm positive hits from these screens with standard lifespan assays on 3 mm culture plates.
Disclosures
The authors declare that no funding entity supporting this work had any input on collection of data, analysis of results, or the decision to publish.
Acknowledgements
We thank Dipa Bhaumik, Aaron Miller and Bob Hughes for technical assistance. Strains were provided by the CGC, which is funded by NIH Office of Research Infrastructure Programs (P40 OD010440). We are grateful to Georgia Woods and members of the Lithgow, Kapahi and Melov Labs for useful discussions. M.L. was supported by National Institutes of Health (NIH) Training Grant T32 AG000266 and an Ellison Medical Foundation/American Federation of Aging Research Post-Doctoral Fellowship. This work was supported by a grant from BioAge Labs, a Larry L. Hillblom Foundation grant, as well as National Institutes of Health grants UL1024917, supporting the Interdisciplinary Research Consortium on Geroscience, and 1R01AG029631-01A1 to G.J.L.
Materials
| Name | Company | Catalog Number | Comments |
|---|---|---|---|
| LB Broth Miller Granules | VWR | ||
| Unispense | Wheaton Science Products | automated fluid dispensing apparatus | |
| 96 well assay plate; COSTAR 3370 | Corning | ||
| Multidrop 384; automated 8 channel dispenser | Thermo Fisher Scientific | ||
| manufactored worm pick | Genesee Scientific | ||
| Belly Dancer Orbital Shaker | Stovall Life Science inc. | ||
| microplate shaker; MTS 2/4 Digital | IKA Works, inc. | ||
| automated 96-well liquid handler; Biomek FX Liquid Handler | Beckman Coulter | ||
| automated 96-well liquid handler; Bench Top Pipettor | Sorenson Bioscience, inc. | ||
| manual 8 or 12 multi-channel pipettes | we use rainin… | ||
| transparent 96 well film cover; TempPlate RT Optical Film | USA Scientific | ||
| table top centrifuge; Centrifuge 5810 R | Eppendorf |
References
- Lucanic, M., et al. Chemical activation of a food deprivation signal extends lifespan. Aging Cell. , (2016).
- Evason, K., Huang, C., Yamben, I., Covey, D. F., Kornfeld, K. Anticonvulsant medications extend worm life-span. Science. 307 (5707), 258-262 (2005).
- Melov, S., et al. Extension of life-span with superoxide dismutase/catalase mimetics. Science. 289 (5484), 1567-1569 (2000).
- Benedetti, M. G., et al. Compounds that confer thermal stress resistance and extended lifespan. Exp Gerontol. 43 (10), 882-891 (2008).
- Hansen, M., Hsu, A. L., Dillin, A., Kenyon, C. New Genes Tied to Endocrine, Metabolic, and Dietary Regulation of Lifespan from a Caenorhabditis elegans Genomic RNAi Screen. PLoS Genet. 1 (1), 17(2005).
- Lee, S. S., et al. A systematic RNAi screen identifies a critical role for mitochondria in C. elegans longevity. Nat Genet. 33 (1), 40-48 (2003).
- Samuelson, A. V., Carr, C. E., Ruvkun, G. Gene activities that mediate increased life span of C. elegans insulin-like signaling mutants. Genes Dev. 21 (22), 2976-2994 (2007).
- Kwok, T. C., et al. A small-molecule screen in C. elegans yields a new calcium channel antagonist. Nature. 441 (7089), 91-95 (2006).
- Petrascheck, M., Ye, X., Buck, L. B. A high-throughput screen for chemicals that increase the lifespan of Caenorhabditis elegans. Ann N Y Acad Sci. 1170, 698-701 (2009).
- Solis, G. M., Petrascheck, M. Measuring Caenorhabditis elegans life span in 96 well microtiter plates. J Vis Exp. (49), (2011).
- Angeli, S., et al. A DNA synthesis inhibitor is protective against proteotoxic stressors via modulation of fertility pathways in Caenorhabditis elegans. Aging (Albany NY). 5 (10), 759-769 (2013).
- Fabian, T. J., Johnson, T. E. Production of age-synchronous mass cultures of Caenorhabditis elegans. J Gerontol. 49 (4), 145-156 (1994).
- Greer, E. L., Brunet, A. Different dietary restriction regimens extend lifespan by both independent and overlapping genetic pathways in C. elegans. Aging Cell. 8 (2), 113-127 (2009).
- Mair, W., Panowski, S. H., Shaw, R. J., Dillin, A. Optimizing dietary restriction for genetic epistasis analysis and gene discovery in C. elegans. PLoS One. 4 (2), 4535(2009).
- Hamilton, B., et al. A systematic RNAi screen for longevity genes in C. elegans. Genes Dev. 19 (13), 1544-1555 (2005).
- Frankowski, H., et al. Dimethyl sulfoxide and dimethyl formamide increase lifespan of C. elegans in liquid. Mech Ageing Dev. 134 (3-4), 69-78 (2013).
- Lucanic, M., et al. Impact of genetic background and experimental reproducibility on identifying chemical compounds with robust longevity effects. Nat Commun. 8, 14256(2017).
Reprints and Permissions
