We present a protocol to investigate the mRNA expression biomarkers of periosteum-derived cells (PDCs) induced by vitamin C (vitamin C) and 1,25-dihydroxy vitamin D [1,25-(OH)2D3]. In addition, we evaluate the ability of PDCs to differentiate into osteocytes, chondrocytes, and adipocytes.
Method Article
Isolation of Mesenchymal Stem Cells from Human Alveolar Periosteum and Effects of Vitamin D on Osteogenic Activity of Periosteum-derived Cells
In This Article
Summary
Abstract
Mesenchymal stem cells (MSCs) are present in a variety of tissues and can be differentiated into numerous cell types, including osteoblasts. Among the dental sources of MSCs, the periosteum is an easily accessible tissue, which has been identified to contain MSCs in the cambium layer. However, this source has not yet been widely studied.
Vitamin D3 and 1,25-(OH)2D3 have been demonstrated to stimulate in vitro differentiation of MSCs into osteoblasts. In addition, vitamin C facilitates collagen formation and bone cell growth. However, no study has yet investigated the effects of Vitamin D3 and Vitamin C on MSCs.
Here, we present a method of isolating MSCs from human alveolar periosteum and examine the hypothesis that 1,25-(OH)2D3 may exert an osteoinductive effect on these cells. We also investigate the presence of MSCs in the human alveolar periosteum and assess stem cell adhesion and proliferation. To assess the ability of vitamin C (as a control) and various concentrations of 1,25-(OH)2D3 (10−10, 10−9, 10−8, and 10−7 M) to alter key mRNA biomarkers in isolated MSCs mRNA expression of alkaline phosphatase (ALP), bone sialoprotein (BSP), core binding factor alpha-1 (CBFA1), collagen-1, and osteocalcin (OCN) are measured using real-time polymerase chain reaction (RT-PCR).
Introduction
Although numerous relevant techniques have been developed in recent years, bone reconstruction remains limited by multiple constraints, and estimating the extent of necessary reconstruction is often impossible. Hard-tissue augmentation is required to achieve both esthetic and functional goals in addition to a favorable long-term success rate. Methods commonly used for such procedures include autogenous and allogenic bone grafting, xenografting, and alloplastic bone grafting. Among the various types of bone graft, autogenous bone grafts are considered the most effective. However, donor site morbidity, compromised vascularity, and limited tissue availability1 have been major drawbacks for autogenous bone grafting. In addition, allogenic bone grafts and xenografts have been associated with disease transmission. Currently, synthetic bone grafts are widely used to resolve these problems. However, with their lack of osteogenic potential, clinical outcomes have varied widely. Materials such as cellulose are associated with volume fluctuation, infection, and a lack of strength.
Bone augmentation using tissue engineering has generated considerable interest. In this technique, mesenchymal stem cells (MSCs) are initially used to promote osteoblast differentiation, which are then transplanted to the site of bone loss to achieve bone repair. This procedure is currently applied in cell therapy. Achieving bone reconstruction by extracting a limited amount of tissue is simpler and less invasive compared with other methods.
The potential role of MSCs as a tool for cell-based therapies aimed at dental regeneration is an emerging interest among various research groups. Studies have confirmed that MSCs can be differentiated from the following types of tissue: bone marrow, adipose, synovial membrane, pericyte, trabecular bone, human umbilical cord, and dental tissues2,3. Common sources of MSCs include bone marrow, adipose tissue, and dental tissues. Compared with MSCs derived from adipose tissue and bone marrow, the advantages of dental stem cells are easy accessibility and less morbidity after harvesting. Compared with embryonic stem cells, MSCs derived from dental tissue appear nonimmunogenic and are not associated with complex ethical concerns3.
In 2006, the International Society for Cellular Therapy recommended using the following standards to identify MSCs: First, MSCs must be capable of attaching to plastic. Second, MSCs must be positive for the surface antigens CD105, CD73, and CD90 and negative for the markers for monocytes, macrophages, and B cells in addition to the hematopoietic antigens CD45 and CD344. As a final criterion, MSCs must be able to differentiate into the following three types of cells under standard conditions of in vitro differentiation: osteoblasts, adipocytes, and chondrocytes4. To date, six types of human dental stem cell have been isolated and characterized. The first type was isolated from human pulp tissue and termed postnatal dental pulp stem cells5. Subsequently, three additional types of dental MSCs have been isolated and characterized: stem cells from exfoliated deciduous teeth6, the periodontal ligament7, and the apical papilla8. More recently, dental follicle-derived9, gingival tissue-derived10, dental bud stem cells(DBSCs)11, and periapical cyst MSCs (hPCy-MSCs)12 have also been identified.
Friedenstein was the first to define MSCs13. MSCs exhibit a high proliferation potential and can be manipulated to differentiate before being transplanted, which suggests that they are ideal candidates for regenerative procedures10.
Although most studies have used bone marrow as a source of stem cells, periosteum-derived cells (PDCs) have also been used recently14. The periosteum is more easily accessible than is the bone marrow. Therefore, in this technique, we use alveolar periosteum to eliminate the need for additional incisions during surgery and to reduce postsurgical morbidity in patients. The periosteum is the connective tissue that forms the outer lining of long bones and comprises two distinct layers: the outer fibrous layer composed of fibroblasts, collagen, and elastic fibers15, and the inner cell-rich cambium layer in direct contact with the bone surface. The cambium layer contains a mixed cell population, primarily fibroblasts16, osteoblasts17, pericytes18, and a critical subpopulation identified as MSCs19,20,21. Most studies have reported that PDCs are comparable, if not superior, to bone marrow-derived stem cells (bMSCs) in bone healing and regeneration22,23,24. The periosteum is easily accessible and exhibits excellent regenerative effectiveness. However, few studies have focused on the periosteum25,26,27.
Regarding bone repair, the current clinical practice involves the transplantation of periosteal progenitor cells amplified within supportive scaffolds. Recent studies have focused on acquiring stem cells in defective regions and employing progenitor cells for tissue regeneration20. Dentists also anticipate future application of periodontal bone regeneration in periodontal treatments and dental implants. Regarding the donor site, the periosteum can be easily harvested by general dental surgeons. This compares favorably against marrow stromal cells, as the periosteum can be accessed during routine oral surgery. Thus, the objective of this study is to establish a protocol for harvesting PDCs and to assess the morphology, attachment, viability, and proliferation of human periosteum stem cells.
Vitamin D metabolites affect the in vivo bone-mineral dynamic equilibrium. One study reported that the 24R,25-(OH)2D3 active form of Vitamin D is essential for the osteoblastic differentiation of human MSCs (hMSCs)28. Bone homeostasis and repair are regulated by a network of Vitamin D3 metabolites, of which 1,25-(OH)2D3 (calcitriol) is the most biologically active and relevant in the regulation of bone health. Vitamin D3 is essential for calcification29. In one study using 2-d-old Kunming white mice, the embryoid bodies in the mice indicated that Vitamin C and Vitamin D supplements effectively promoted the differentiation of ESC-derived osteoblasts30. Among its other biological activities, 1,25-(OH)2D3 stimulates the in vitro differentiation of hMSCs to osteoblasts, which can be monitored based on the increase in alkaline phosphatase (ALP) enzyme activity or OCN gene expression.
Few studies have detected a dose-response relationship of combined treatments with Vitamin C and 1,25-(OH)2D3 in human PDCs with a particular focus on bone tissue engineering. Therefore, in this study, we examine the optimal concentrations for single or combined treatment of 1,25-(OH)2D3 and Vitamin C for inducing osteogenic differentiation of human PDCs. The goal of this protocol is to determine whether a cell population isolated from the dental alveolar periosteum contains cells with an MSC phenotype and whether these cells can be expanded in culture (in vitro) and differentiated to form the desired tissue. In addition, we evaluate the ability of PDCs to differentiate into osteocytes, chondrocytes, and adipocytes. The second part of the study evaluates the effects of Vitamin C and 10−10, 10−9, 10−8, and 10−7 M 1,25-(OH)2D3 on the osteogenic activity of PDCs. The primary objective of this study is to assess the functions of Vitamin C and 1,25-(OH)2D3 during the osteoblastic differentiation of PDCs by ALP activity, and pro-osteogenic genes, such as ALP, collagen-1, OCN, BSP, and CBFA1. In addition, this study determines the optimal osteoinductive conditions for human PDCs based on these findings.
Protocol
The study protocol was approved by the Institutional Review Board of Chang Gung Memorial Hospital. All participants provided written informed consent.
1. Tissue Preparation
- Harvest the periosteal tissues from patients during dental surgery (Figure 1). After flap reflection under local anesthesia, take a piece of periosteum tissue from the alveolar bone using a periosteal separator31.
- After harvesting, store the periosteal tissues slices of approximately 5 mm × 2 mm in Dulbecco’s phosphate buffered saline (DPBS) with 300 U/mL of penicillin and 300 mg/mL of streptomycin. Transfer the tissues to the laboratory within 24 h.
- Mince the alveolar periosteal tissue fragments with scalpels until well minced and maintain the samples in passage 0 medium (composed of 300 U/mL of penicillin and 300 mg/mL of streptomycin, α-MEM, and 5% fetal bovine serum [FBS]) cultured in an incubator at 37 °C with humidified air (5% carbon dioxide). In the incubator, prepare a water basin to maintain humidity.
- Change the medium after 3 days and twice per week thereafter.
- When the cells have reached subconfluence (80%), release the adherent cells with 200 µL of 0.25% trypsin in the incubator (37 °C) for 3 min, and then use 4.5 mL of medium to terminate the reaction.
- Plate the cells again in fresh passage 1 medium (α-MEM, 10% FBS, 100 units/mL of penicillin, and 100 μg/mL of streptomycin). Plate is 5 × 10³ Cells (as counted by a hemocytometer).
- Perform each subsequent passage after the cells achieve 80% confluence31.
NOTE: In the beginning, the medium will be orange red. After roughly three days, the medium color should change to a yellowish shade. The doubling time of the cells is roughly 30–40 h, needing 7 days for 3–5 generations. - Culture the isolated PDCs in α-MEM supplemented with 10% FBS, 100 U/mL of penicillin, and 100 mg/mL of streptomycin in an incubator (37 °C, 5% CO2).
- Observe cell growth daily and replace the growth medium twice per week. Use third- to fifth-generation cells for all further experiments.
2. Flow Cytometry
- Harvest 1 × 10⁶ cells through trypsin digestion:
- Add 200 µL of 0.25% trypsin. After 3 min, use 4.5 mL of culture medium containing FBS to terminate the reaction of trypsin and collect through centrifugation (1500 rpm, 5 min, 22 °C).
- Wash the cell pellets three times using 1x DPBS. Resuspend the cells in 200 µL 1x permeabilization buffer. Count the cells with a hemocytometer.
- Examine the expressed surface markers expressed of the PDCs through flow cytometry (fluorescence-activated cell sorting)32. Use monoclonal antibodies (MAb) against CD19 (fluorescein isothiocyanate (FITC)), CD34 (FITC), CD44 (Phycoerythrin [PE]), CD45 (FITC), CD73 (PE), CD90 (allophycocyanin [APC]), CD146 (PE), STRO-1 (Alex), and HLA-DR (FITC)32.
- Add the antibodies to the samples and culture in the dark at 4 °C for 30 min.
- Wash the cells with 1x DPBS three times.
- Fix the cells using 2% formaldehyde and proceed with flow cytometry analysis32.
3. Cell Attachment and Viability with Osteogenic, Adipogenic, and Chondrogenic Differentiation
Induce differentiation in the cells into osteogenic, adipogenic, and chondrogenic lineages by culturing the periosteal cells in all three passages on six-well plates with specific differentiation media.
- For osteogenic differentiation, culture the cells in α-MEM at a density of 5000 cells per well on six-well culture plates.
- On achieving 80% confluence, culture the cells in media containing α-MEM, 5% FBS, β-glycerophosphate (10 mM), 10−7 M dexamethasone (0.1 mM), and 5 mL of ascorbic acid (100 uM). Culture the negative control in media consisting of α-MEM and 5% FBS.
- Change the media twice per week.
- After 4 weeks, assess the potential of the cells to differentiate into an osteogenic lineage by staining the cells using a von Kossa assay, which distinguishes the presence of calcified deposits in a culture33.
- Add 10% formalin for fixing. Within 30 min, add 5% silver nitrate and treat under ultraviolet (UV) light for 1 h at room temperature.
- Add 5% Na2SO4 four times, allowing 3 min for each reaction. Finally, wash the cells twice with distilled water.
NOTE: Von Kossa staining is a precipitation reaction where silver ions and phosphate react in the presence of acidic material; this staining technique is not specific to calcium. In this study, when the investigated cells were treated with silver nitrate solution, calcium—which is reduced by strong UV light—was replaced by silver, which became visible as metallic silver.
- For adipogenic differentiation, culture the cells at a density of 5000 cells per well on six-well culture plates containing α-MEM.
- On achieving 80% confluence, culture the cells in media containing α-MEM, 5% FBS, 0.5 mM 3-isobutyl-1-methylxanthine (100 mg/mL), 1% penicillin, 10−6 M dexamethasone (1 mM), insulin (5 mg/mL), and indomethacin (60 mM).
- Culture the negative control in media consisting of α-MEM and 5% FBS.
- After 6–9 weeks, use oil red O to stain the cells and highlight lipid drops, thereby determining the presence of adipogenic differentiation33:
- Add 10% formalin for fixing. Within 30 min, stain the cells with 0.5% oil red O at room temperature for 10 min, and then wash the cells three times with 60% isopropanol for 3 min each time; finally, wash the cells with distilled water.
NOTE: Oil red O is a lysochrome (fat-soluble) diazo dye used for the staining of neutral lipids, primarily triacylglycerol, lipoprotein, and cholesterol esters. The dye dissolves in the lipid droplets in the cell, turning the lipid droplets red.
- Add 10% formalin for fixing. Within 30 min, stain the cells with 0.5% oil red O at room temperature for 10 min, and then wash the cells three times with 60% isopropanol for 3 min each time; finally, wash the cells with distilled water.
- For chondrocyte differentiation, culture cells on six-well culture plates with each well containing 5000 cells.
- Add a differentiation medium containing α-MEM, 5% FBS, 10−7 M dexamethasone (0.1 mM), sodium pyruvate (100 µg/mL), insulin-transferrin-selenium-A (1 × ITS), transforming growth factor-β (10 ng/mL), and 5 mL of ascorbic acid (100 µM).
- Culture the negative control in media consisting of α-MEM and 5% FBS.
- After 4–5 weeks, use Alcian blue staining to highlight the acidic polysaccharides, such as glycosaminoglycans or some types of mucopolysaccharides, in the cartilage of the cells to determine the presence of chondrocyte differentiation33.
- Add 10% formalin for fixing. Within 30 min, add 3% acetic acid and allow 2 min for the reaction. Subsequently, wash with distilled water three times, add 1% Alcian blue 8GX incubated for 30 min, and then wash with distilled water. Finally, add 3% acetic acid and wash for 3 min, and then wash with distilled water to finish.
NOTE: The parts of the cell that specifically stain by this dye become blue to blue-green after staining and are called “alcianophilic.”
- Add 10% formalin for fixing. Within 30 min, add 3% acetic acid and allow 2 min for the reaction. Subsequently, wash with distilled water three times, add 1% Alcian blue 8GX incubated for 30 min, and then wash with distilled water. Finally, add 3% acetic acid and wash for 3 min, and then wash with distilled water to finish.
4. Effects of 25-Dihydroxyvitamin D3 (1,25-(OH)2D3) on Osteogenesis
- Split the P3 to P5 PDCs into six groups and culture on 6-well plates with various culture media:
- negative group (α-MEM and 5% FBS);
- Vitamin C group (α-MEM, 5% FBS, 10 mM β-glycerophosphate, and 10−7 M dexamethasone + 100 uM Vitamin C);
- and 10−7 M 1,25-(OH)2D3 group (α-MEM, 5% FBS, 10 mM β-glycerophosphate, and 10−7 M dexamethasone + 10−7 M 1,25-(OH)2D3).
- Add 2 mL of the medium to an incubator (37 °C) in each well and change the medium twice every week.
5. Reverse Transcription/Quantitative Real-Time Polymerase Chain Reaction
- After 7 d of osteoblast differentiation, isolate the total RNA on ice by using a commercial reagent (see Table of Materials):
- Add 1 mL of isolation reagent to each well. Add 200 µL of bromochloropropane and leave for 10 min to generate layered RNA, and then centrifuge at 10,000 rpm for 15 min at 4 °C.
- After centrifugation, add 500 µL of 2-propanol to 500 µL of the supernatant containing RNA. Precipitate the RNA on the ice and allow 15 min for the reaction.
- After the procedure, centrifuge at 12,000 rpm for 15 min at 4 °C, after which the RNA is located at the bottom of the tube. Subsequently, remove the supernatant by using 1 mL of 75% alcohol for washing and centrifuge at 7,500 rpm for 8 min in 4 °C.
- Remove the supernatant and use a vacuum concentrator to produce RNA from the bottom of the liquid. Recover with water.
- Reverse transcribe the RNA (1 μg) using avian myeloblastosis virus reverse transcriptase. Set the polymerase chain reaction (PCR) to run at 25 °C for 10 min followed by 50 °C for 60 min and then 85 °C for 5 min, before finally maintaining at 4 °C.
- Synthesize first-strand complementary DNA (cDNA). Perform quantitative PCR (qPCR) using 5 μL of 1:10 diluted cDNA. Conduct quantitative RT-PCR (qRT-PCR) using primers for ALP, BSP, OCN, CBFA1, and collagen-1.
NOTE: To avoid DNA contamination by the signals, the forward and reverse sequences of each primer were designed on distinct exons. - Perform qPCR by using a commercial PCR Master Mix (see Table of Materials) in accordance with the manufacturer’s instructions. Set the thermal cycler at 50 °C for 2 min followed by 95 °C for 10 min and then 40 cycles each at 95 °C for 15 s followed by 60 °C for 60 s.
NOTE: The SYBR protocol also requires a melt curve stage, which is run at 95 °C for 15 s, 60 °C for 60 s, and then 95 °C for 15 s. - Normalize the cycle threshold values for ALP, BSP, CBFA1, collagen-1, and OCN to that of the housekeeping gene GAPDH.34
- Primer pairs are listed in the Table of Materials.
6. Alkaline Phosphatase Activity
- Assess the ALP enzyme activity of the cells using the previously described technique35, which converts p-nitrophenyl phosphate to p-nitrophenol; p-nitrophenyl phosphate is a phosphatase substrate that turns yellow when dephosphorylated by ALP, as determined at a 405-nm wavelength. Normalize the total p-nitrophenol formed based on the total protein as determined by the Bradford assay.
- Compare the ALP activities of the control (α-MEM, 5% FBS), Vitamin C (α-MEM, 5% FBS, 10 mM β-glycerophosphate, 10−7 M dexamethasone + 100 uM Vitamin C), 1,25-(OH)2D3 (α-MEM, 5% FBS, 10 mM β-glycerophosphate, and 10−7 M dexamethasone + 10−8 M 1,25-(OH)2D3), and Vitamin C + 1,25-(OH)2D3 (α-MEM, 5% FBS, 10 mM β-glycerophosphate, 10−7 M dexamethasone + 100 uM Vitamin C +1,25-(OH)2D3) groups after 1, 2, 3, and 4 week of culture.
- Perform a protein extraction procedure on ice:
- Scrape the cells from the 6-well plates and add 50 µL of lysis buffer. Subsequently, place the cells on the ice for 30 min to destroy the cells and free the protein.
- After 30 min, centrifuge at 13000 rpm at 4 °C for 15 min. After centrifugation, extract the supernatant for storage and use.
Results
For all quantitative assays, the data are presented as mean ± standard deviation (SD). All statistical analyses were performed using Student's t-test. In total, 34 samples were obtained with a mean participant age of 48.1 ± 12.3 y. Eleven of these samples were obtained from male patients and 23 from female patients. Twenty-eight samples were obtained from the molar regions and six from the anterior regions; 26 were obtained from the maxilla and 8 from the mandible. The mean duration between the dental procedure and the culture was 0.5 ± 0.1 h. Of the 34 investigated samples, 20 successfully yielded MSC colonies, with a successful isolation rate of 58.8%. No significant differences were observed in any of the parameters between the successfully and the unsuccessfully isolated PDCs (mean age: 48.8 ± 13.0 vs. 47.1 ± 11.5 y, sex: 7 men [35%] vs. 4 men [28.6%], location: 15 from molar regions [75%] vs. 13 [92.9%], and 15 from the maxilla [75%] vs. 11 [78.6%], respectively).
Cell isolation and morphology: Osteogenic, chondrogenic, and adipogenic differentiation
From Days 1-9, PDCs formed colonies and spherical clusters. Most cells exhibited a spindle appearance and were homogeneous under a phase-contrast microscope (Figure 2). After 14 d of culture, the cell morphology appeared spindle-shaped as observed under the phase-contrast microscope. Following the first-generation cells, the cells no longer grew in clusters but exhibited widespread and uniform proliferation.
The MSCs were spindle-shaped with irregular processes and firmly attached to the culture dish after 1-3 d of primary culture (Figure 2a). The initial culture exhibited small, round cells and spindle-shaped cells under an optical microscope. The cultured cells exhibited a homogeneous, fibroblast-like spindle shape from the first passage (Figure 2a). The differentiation study revealed that the PDCs could be subpassaged and differentiated in vitro into osteoblasts (Figure 2b), chondrocytes (Figure 2c), and adipocytes (Figure 2d).
At the end of the osteogenic differentiation, von Kossa staining indicated the presence of calcium deposits and osteogenic differentiation (Figure 2b). These results strongly indicated that among periosteal cell populations, progenitor cells possess the potential to differentiate into osteogenic cells.
To assess the production of proteoglycans, Alcian blue stain was used as an indicator for determining the presence of chondrocyte differentiation (Figure 2c). The cells successfully differentiated into chondrocytes. These results suggested that, among periosteal cell populations, progenitor cells possess the potential to differentiate into chondrogenic cells.
The cells were cultured in the previously mentioned specific media to trigger adipogenic differentiation. After 8 weeks, oil red O was used to detect the existence of intracellular lipids. Following staining, intracellular microscopic fat drops were observed in five differentiated samples (Figure 2d).
Flow cytometric surface marker expression analysis for PDCs
A flow cytometric assay was conducted to confirm the expression of mesenchymal surface marker on the surface of the cells. MSC markers CD73, CD90, STRO-1, and CD44 were strongly positive in the PDCs, whereas hematopoietic lineage markers CD19, CD34, CD45, and HLA-DR were negative.
Effects of various Vitamin D3 concentrations on osteogenesis
Although the results confirmed the positive effects of 1,25-(OH)2D3 (calcitriol) on osteogenic activity, statistically significant differences were observed only among some of the fold changes in the mRNA expressions of the osteogenic enzymes. This analysis might have been biased by the high SD values, which can be attributed to the individual deviations among the hosts.
Messenger RNA expression of alkaline phosphatase
The fold changes in the mRNA expression of ALP after 1 week of culture was 7.43 (SD = 3.96) in the Vitamin C group and 7.15 (SD = 4.88), 9.30 (SD = 5.63), 12.92 (SD = 7.95), and 6.60 (SD = 6.33) in the 10−10, 10−9, 10−8, and 10−7 M 1,25-(OH)2D3 groups, respectively (Figure 4a). The mRNA expression levels of ALP in the Vitamin C, 10−8 M 1,25-(OH)2D3, and 10−9 M 1,25-(OH)2D3 groups were significantly higher (p < 0.05) than those in the other groups, indicating increased ALP mRNA expression in these groups. The control was set to the value 1. The following fold increases in the ALP mRNA expressions were observed in this study: 7.43-fold in the Vitamin C group; 9.30-fold in the 10−9 M 1,25-(OH)2D3 group; and 12.92-fold in the 10−8 M 1,25-(OH)2D3 group.
Although a greater fold change in the ALP mRNA expressions was observed in the 10−8 M 1,25-(OH)2D3 group, no statistically significant differences were observed regarding these expression levels between this group and the negative and Vitamin C groups (p = 0.20 and p = 0.52, respectively).
ALP is a strong indicator for determining the early osteogenic differentiation of cells. ALP also serves as an ectoenzyme for the degradation of inorganic pyrophosphate and releases phosphate during mineralization36. The PDCs treated with Vitamin C and 10−8 and 10−9 M 1,25-(OH)2D3 exhibited significant differences when compared with those from the other groups (Figure 4a).
Messenger RNA expression of bone sialoprotein
The fold changes in the mRNA expressions of BSP after 1 week of culture were 3.21 (SD = 1.20) and 4.18 (SD = 2.55), 10.34 (SD = 10.31), 24.91 (SD = 23.44), and 5.24 (SD = 3.54) in the Vitamin C and the 10−10, 10−9, 10−8, and 10−7 M 1,25-(OH)2D3 groups, respectively (Figure 4b). The BSP mRNA expressions were higher in the 10−8 M 1,25-(OH)2D3 group, but with no statistical significance compared with the corresponding expressions in the other groups.
The BSP mRNA expressions in the Vitamin C and 10−10 M 1,25-(OH)2D3 groups were significantly higher (p < 0.05) than those in the other groups, indicating that Vitamin C and 10−10 M 1,25-(OH)2D3 promoted BSP expression. The control was set to a value of 1. The Vitamin C and the 10−10 M 1,25-(OH)2D3 groups exhibited a 3.21- and 4.18-fold increase in the BSP mRNA expressions, respectively. The 10−9 M and 10−8 M 1,25-(OH)2D3 groups exhibited higher BSP mRNA expressions than did the other groups. The 10−9 and 10−8 M 1,25-(OH)2D3 groups exhibited a 10.34- and 24.91-fold increase in the BSP mRNA expressions, respectively, but this increase was not statistically significant (p > 0.05). A possible explanation is that the stem cells were not all obtained from the same participant. Thus, the potential differences might have increased the SD and consequently affected the statistical results.
Messenger RNA expression of CBFA1
The fold changes in the CBFA1 mRNA expressions after 1 week of culture were 0.96 (SD = 0.10) and 0.90 (SD = 0.26), 1.01 (SD = 0.25), 1.31 (SD = 0.32), and 1.12 (SD = 0.35) in the Vitamin C and the 10−10, 10−9, 10−8, and 10−7 M 1,25-(OH)2D3 groups, respectively (Figure 4c). The 10−8 M 1,25-(OH)2D3 group exhibited higher CBFA1 mRNA expressions. No marked changes were observed in the CBFA1 mRNA gene expressions in the treatment groups or in the control group. In addition, no significant increase was observed in the expression of the mRNA markers after the addition of Vitamin C or 1,25-(OH)2D3. Moreover, no significant intergroup differences were observed.
Messenger RNA expression of collagen-1
The fold changes in the mRNA expression of collagen-1 after 1 week of culture were 0.98 (SD = 0.17) and 0.85 (SD = 0.16), 1.05 (SD = 0.16), 1.52 (SD = 0.36), and 1.01 (SD = 0.33) in the Vitamin C and the 10−10, 10−9, 10−8, and 10−7 M 1,25-(OH)2D3 groups, respectively (Figure 4d). The collagen-1 mRNA expressions were higher in the 10−8 M 1,25-(OH)2D3 group but with no statistically significant differences compared with the corresponding expressions in the other groups.
The 10−8 M 1,25-(OH)2D3 and control groups exhibited statistically significant differences in their results (p < 0.05). The control was set to a value of 1. A 1.52-fold increase in the collagen-1 mRNA expressions was observed. The 10−10 M 1,25-(OH)2D3 and the 10−8 M 1,25-(OH)2D3 groups exhibited significant differences in their results (p < 0.05).
Messenger RNA expression ofosteocalcin
The fold changes in the OCN mRNA expressions after 1 week of culture were 0.60 (SD = 0.1) and 0.78 (SD = 0.18), 1.13 (SD = 0.55), 2.59 (SD = 1.59), and 1.61 (SD = 0.73) in the Vitamin C and the 10−10, 10−9, 10−8, and 10−7 M 1,25-(OH)2D3 groups, respectively (Figure 4e). The OCN mRNA expressions were higher in the 10−8 M 1,25-(OH)2D3 group but with no statistically significant differences compared with the corresponding expressions in the other groups.
No significant increase was observed in the expressions of the OCN mRNA markers after the addition of Vitamin C or 1,25-(OH)2D3. However, the OCN mRNA expressions decreased after Vitamin C treatment. The control was set to the value 1. The basal OCN expressions exhibited a significant 0.6-fold decrease (p < 0.05) during osteoblastic differentiation. The OCN mRNA expressions were significantly higher (p < 0.001) in the cells cultured in 10−8 M 1,25-(OH)2D3 than in the corresponding expressions of the other groups, which exhibited an average fold increase of 2.59. However, these results were not statistically significant (p > 0.05). A possible explanation is that the stem cells were not all obtained from the same participant; thus, the potential differences might have increased the SD and consequently affected the statistical results.
ALP activity assay
A previous study demonstrated that 1,25-(OH)2D3 is most effective at a concentration of 10−8 M; therefore, 10−8 M was used in the test group to compare the osteogenic ability of 1,25-(OH)2D3 with that of the negative, Vitamin C, and Vitamin C + 1,25-(OH)2D3 groups. The osteogenic ability was expressed by the ALP activity. After 1 week of culture (Figure 5a), the fold changes in ALP activity were 1.00 (SD = 0.00), 1.92 (SD = 0.89), 3.77 (SD = 1.66), and 1.46 (SD = 0.49) in Negative, C, D, and C + D, respectively. Among all the groups, statistically significant differences were only observed between the D and Negative groups (p = 0.03; Figure 5a). After 2 weeks of culture, the fold changes in ALP activity (Figure 5b) were 1.00 (SD = 0.00), 2.32 (SD = 1.68), 4.98 (SD = 3.02), and 4.86 (SD = 2.73) in Negative, C, D, and C + D, respectively. No statistically significant differences were observed in any of the groups. After 3 weeks of culture, the fold changes in ALP activity (Figure 5c) were 1.00 (SD = 0.00), 2.93 (SD = 2.15), 5.76 (SD = 3.60), and 5.61 (SD = 3.88) in Negative, C, D, and C + D, respectively. Again, no statistically significant differences were observed in any of the groups (Figure 5c). After 4 weeks of culture, the fold changes in ALP activity (Figure 5d) were 1.00 (SD = 0.00), 2.83 (SD = 1.97), 3.79 (SD = 0.77), and 4.24 (SD = 2.87) in Negative, C, D, and C + D, respectively. Here, the D and Negative groups exhibited statistically significant differences (p = 0.00; Figure 5d).
In Week 1, only the 10−8 M 1,25-(OH)2D3 group exhibited significant differences compared with the control group (p = 0.03). In Week 2, the 10−8 M 1,25-(OH)2D3 and Vitamin C groups exhibited significant differences compared with the control group (p = 0.0498). In Week 3, none of the groups exhibited significant differences compared with the control group. In Week 4, the 10−8 M 1,25-(OH)2D3 group exhibited significant differences compared with the control group. This indicated that 10−8 M 1,25-(OH)2D3 promoted ALP activity.
In brief, the 10−8 M 1,25-(OH)2D3 group exhibited increased ALP and collagen-1 mRNA expression; the Vitamin C group exhibited significantly enhanced ALP and BSP mRNA expression; and the 10−9 M 1,25-(OH)2D3 group exhibited significantly enhanced ALP mRNA expression. In Week 1, increased ALP activity was observed in the Vitamin C and 1,25-(OH)2D3 groups but with no statistically significant differences compared with the corresponding expression levels in the other groups. From Weeks 2 to 4, both Vitamin C and 1,25-(OH)2D3 groups exhibited similar results. Therefore, these results could not clearly elucidate the synergistic effects of Vitamin C and 1,25-(OH)2D3 on the osteogenic differentiation of the cells (ALP activity).
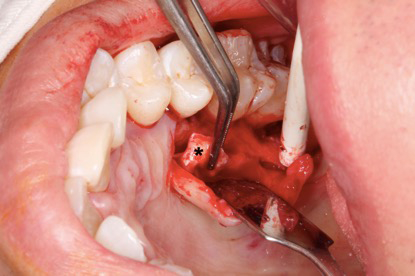
Figure 1: Human alveolar periosteum. Periosteal tissues were harvested during dental surgery. The asterisk denotes the location of the alveolar periosteum.
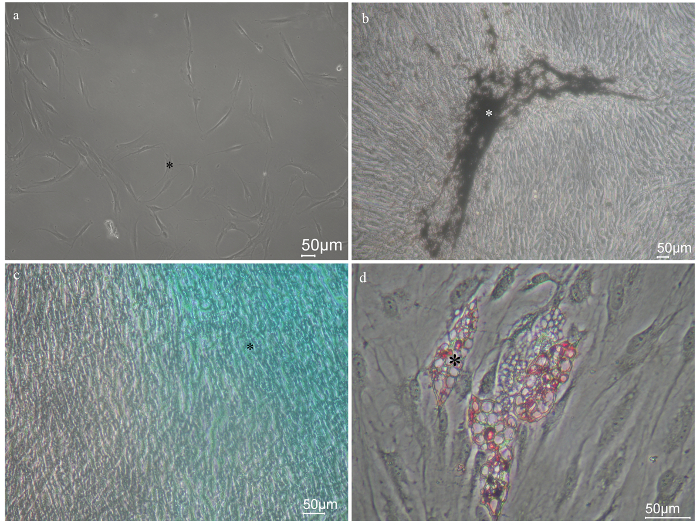
Figure 2: Differentiation study. The MSCs were spindle-shaped with irregular processes and firmly attached to the culture dish after 1-3 d of primary culture (A; the asterisk denotes the location of the mesenchymal stem cell). Under in vitro culture conditions, the MSCs were subpassaged and differentiated into osteoblasts (B, the black asterisk indicates the area stained by von Kossa), chondrocytes (C, the blue asterisk indicates the area stained by Alcian blue), and adipocytes (D, the pink asterisk indicates the area stained by oil red O). Figure 2 is reused from Biomedical Research International, Volume 2016, Article ID 352956125. Please click here to view a larger version of this figure.
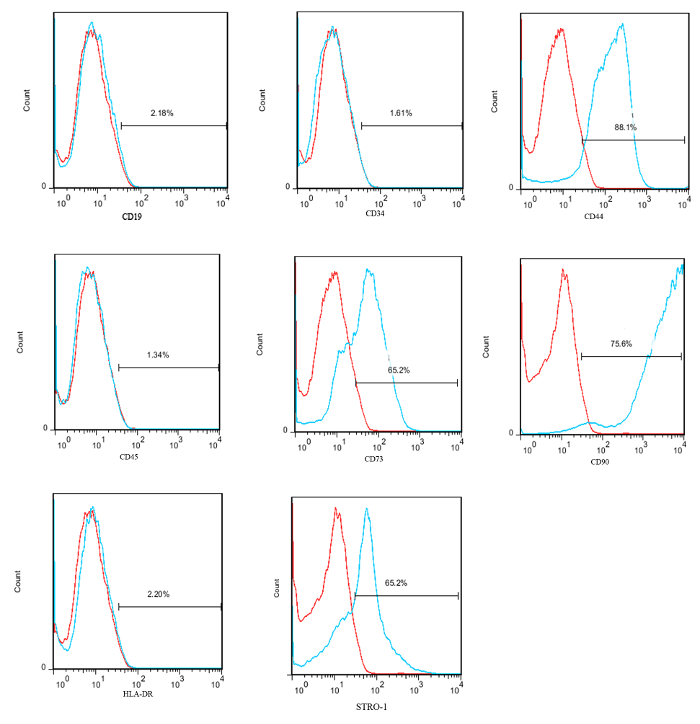
Figure 3: Flow cytometry. Surface markers expressed by MSCs were CD73 (65.2%), CD90 (75.6%), STRO-1 (65.2%), and CD44 (88.1%) but not CD45 (1.34%), CD34 (1.61%), CD19 (2.18%), or HLA-DR (2.20%). "%" in the figure denotes a positive ratio. The control group (α-MEM and 5% FBS) is represented by the red line. The experimental group is represented by the blue line. Please click here to view a larger version of this figure.
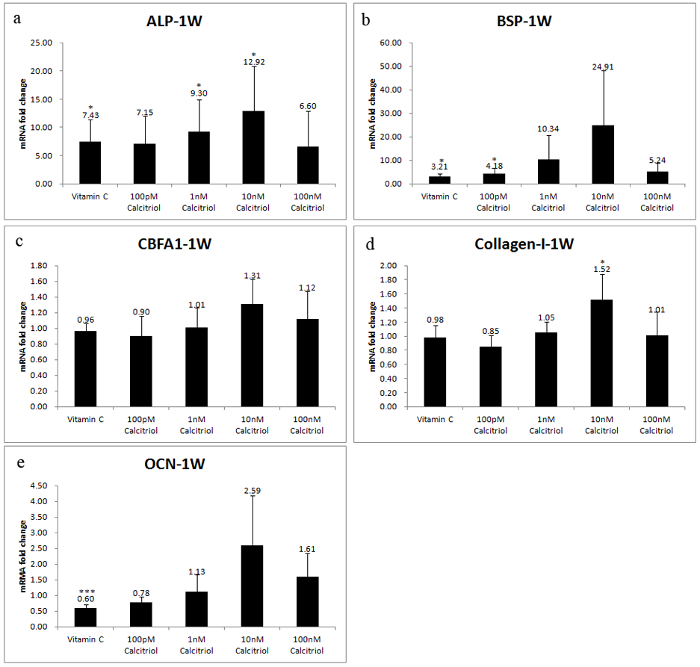
Figure 4: mRNA expressions. mRNA expressions of osteoblast differentiation for Week 1. (A) ALP (B) BSP, (C) CBFA1, (D) COL-I, and (E) OCN. p < 0.05 is *, p < 0.01 is **,p < 0.001 is ***. The mRNA fold change is versus control (α-MEM and 5% FBS). Please click here to view a larger version of this figure.
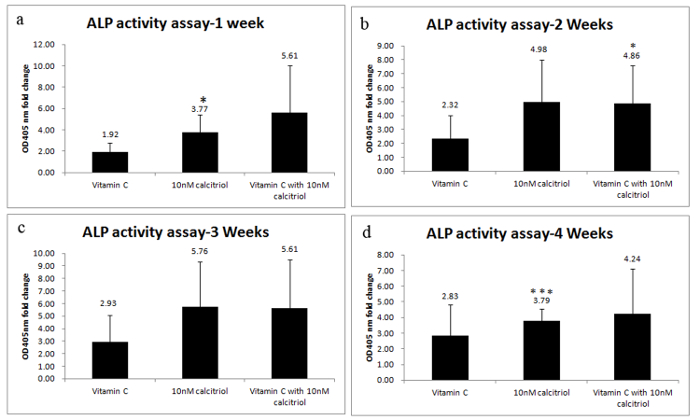
Figure 5: Alkaline phosphatase activity. Alkaline phosphatase activity assay of osteoblast differentiation for (A) Week 1, (B) Week 2, (C) Week 3, and (D) Week 4. p < 0.05 is *, p < 0.01 is **, p < 0.001 is ***. The fold change is versus control (α-MEM, 5% FBS). Please click here to view a larger version of this figure.
Discussion
A recently developed therapeutic modality, namely tissue engineering entailing MSCs, has numerous advantages. MSCs, which are present in several tissue types, are multipotent cells that can differentiate into a variety of functional mesodermal tissue cells37 and other cells such as osteoblasts.
The periosteum serves as a niche for progenitor cells and as a rich vasculature supply for the bone it envelops38. In our study, of the 34 investigated samples, 20 successfully yielded MSC colonies, with a successful isolation rate of 58.8%. MSCs derived from the periosteum were selected in this study based on their proliferation and osteogenic differentiation abilities. The proliferation rate of the periosteal cells was much higher than that of the marrow stromal cells22. Regarding the osteogenic ability of the periosteum, Ousual24 contended that the osteogenic ability of periosteum-derived stem cells (PMSCs) was inferior to that of BMSCs. However, Yoshimura attested that the osteogenic ability of PMSCs outperformed that of BMSCs39. Hayashi et al. demonstrated periosteal adult MSCs as ideal candidates for bone tissue regeneration24. In addition, periosteal adult MSCs are considered useful in shortening the cell culture period, thus reducing both cost and the risk of contamination22. Reportedly, aging also affects the mitogenic activity of the osteoprogenitor cells40. A study reported 1,25-(OH)2D3 induced a higher degree of stimulation of in vitro osteoblast differentiation in hMSCs from younger participants (aged < 65 y)41. The present study involved the use of periosteal cells obtained from young adults (aged < 65 y). Further studies are required to compare the bone regeneration ability of periosteal cells between old and young donors.
In this study, a cell population was isolated based on its plastic-adherent property, as described by Friedenstein et al.13. The PDCs harvested here adhered to the cell culture plastic. The esenchymal markers (CD 73, CD 90, STRO-1, and CD 44) of the surface antigens of these primary cultures cells exhibited significant expressions. Furthermore, hematopoietic markers (CD 45, CD 34, CD 19, and HLA-DR) were absent, indicating that the cultured cells were of a mesenchymal origin. The osteogenic, chondrogenic, and adipogenic differentiation of the PDCs could be induced using specific differentiation media, as described in other studies evaluating samples obtained from gingival tissue and bone marrow42. The results of the present study comply with the minimal standards for the phenotypic and functional definition of human MSCs accepted by the International Society for Cellular Therapy4. In the present study, the MSCs from human periosteum were isolated and expanded, which revealed characteristics similar to those typically described of BMSCs.
Studies have proposed that dexamethasone, ascorbate, and β-glycerophosphate cause BMSCs to undergo osteogenic differentiation43. Another study demonstrated that 1α, 25-dihydroxyvitamin D3 (1,25-(OH)2D3) in combination with ascorbic acid promoted stem cell differentiation44. Therefore, dexamethasone, ascorbate, and β-glycerophosphate were added in this study to promote stem cell differentiation. The patterns observed were similar in all three patient cell samples. In this study, MSCs were successfully identified from the alveolar periosteum with an isolation rate of 58.8%. No statistically significant differences were observed in the success rate with respect to age, sex, and location.
The present experimental study investigated two substances, namely 1,25-(OH)2D3 and vitamin C, both of which can stimulate the osteogenic differentiation of stem cells. A 2008 study45 indicated that 1,25-(OH)2D3 is crucial for bone metabolism and calcium homeostasis and affects the cardiovascular system through mechanisms yet to be fully understood. In another previous study46, 1,25-(OH)2D3 stimulated the in vitro differentiation of human MSCs into osteoblasts. The ability of 1,25-(OH)2D3 to induce undifferentiated BMSCs to differentiate into osteoblast-like cells in vitro has been demonstrated in several studies exploring various systems46. Some studies have also demonstrated that, when added to cultures of osteoblast-like cells, 1,25-(OH)2D3 inhibits cellular proliferation but increases the expression of osteoblastic markers such as ALP, osteopontin, OCN, and matrix Gla protein47,48. A previous study reported that 1,25-(OH)2D3 typically inhibits cellular proliferation and induces osteoblast differentiation49. One in vitro study conducted on murine cells indicated that 1,25-(OH)2D3 can promote the early stages of osteoblastogenesis9. Additionally, another in vitro study suggested that, to both early and late MSCs,1,25-(OH)2D3 can stimulate osteogenic differentiation markers, including ALP, osteopontin, BSP, and OCN43.
Both OCN—considered responsible for the control of matrix synthesis—and collagen 1A1—the most abundant matrix protein—are crucial acidic bone matrix proteins that play vital roles in matrix synthesis. In addition, they are characteristic mature matrix-forming osteoblasts.50 A previous study reported that 1,25-(OH)2D3 treatment stimulated increased collagen 1A1 expression but not CBFA1 or ALP gene expression34. Assessments of genes involved in osteoblastic differentiation have revealed that 1,25-(OH)2D3 treatment increased the expression of OCN51,52,53. In our study, the results showed that 1,25-(OH)2D3 exerts positive effects on osteogenic activity. Compared with the other groups, 10−8 M 1,25-(OH)2D3 demonstrated increased mRNA expression of ALP, BSP, CBFA1, OCN, and Col1. Among these, the results for ALP and Col1 reached statistical significance. Therefore, optimal conditions were obtained when using 10−8 M 1,25-(OH)2D3. mRNA expression of BSP in the 10−10 M 1,25-(OH)2D3 group increased significantly (p < 0.05). However, no statistically significant differences were observed in the fold changes in the mRNA expressions of CBFA1 and OCN. When reviewing the gene mRNA expression, the results of the experiment indicated in vitro osteogenic differentiation. Based on these findings, the osteogenesis observed in the negative, Vitamin C, and 10−10, 10−9, 10−7 M 1,25-(OH)2D3 groups was weaker than that in the 10−8 M 1,25-(OH)2D3 group. These results led to the speculation that 1,25-(OH)2D3 primes PDCs by upregulating the matrix proteins required for mineralization (collagen 1A1).
A previous study reported OCN as a prime target of 1,25-(OH)2D3, which markedly increased OCN expression52. OCN deposition can be seen as a marker for the osteogenic differentiation of PDCs. In addition, OCN expression has been evaluated as a late osteogenic marker54. OCN is a reliable marker for bone formation and osteogenesis55. Therefore, OCN expression is generally related to the mineralization abilities of cells. OCN is a sensitive biomarker of mature osteoblasts. For an in vitro osteogenic comparison, markedly elevated OCN mRNA expression was observed in the 10−8 M 1,25-(OH)2D3 group.
One study indicated that ALP activity was inhibited by transforming growth factor beta (0.1-10 ng/mL) and promoted with 1,25-(OH)2D3 (50 nM)46. These results imply that 10−8 M 1,25-(OH)2D3 promotes stem cell maturation and bone development. ALP activity at the optimal observed concentrations of 10−8 M 1,25-(OH)2D3 was compared with that at the corresponding concentrations of Vitamin C. The PDCs expressed ALP activity. Moreover, the addition of 1,25-(OH)2D3 increased the ALP activity and promoted the osteoblastic differentiation in the PDCs. In all three settings, Vitamin C, 10−8 M 1,25-(OH)2D3, and Vitamin C + 10−8 M 1,25-(OH)2D3 increased ALP activity at Weeks 1 (Figure 4a), 2 (Figure 4b), 3 (Figure 4c), and 4 (Figure 4d) by several fold compared with that of the negative control group. In Weeks 1 and 4, ALP activity increased significantly in the 10−8 M 1,25-(OH)2D3 group. In Week 2, ALP activity increased significantly in the Vitamin C and 10−8 M 1,25-(OH)2D3 groups.
Through a comparative study of various human MSCs at passage 3, Sakaguchi et al.56 found that BMSCs and PMSCs possess similar osteogenic abilities. Therefore, the cell culture period can likely be shortened by using periosteal cells, which in turn would reduce the cost and contamination risk. The use of early-passage hMSCs avoids the senescent effects of expansion in the culture. Ousual and Yoshimura used MSCs at passage 3 and subcultured for 2 weeks under osteogenic differentiation conditions35. Therefore, the passage time should be considered when comparing the cellular activities of various cell sources. In this study, third-generation PDCs were used because the osteogenic potential of the stem cells of later generations of PDCs is lower than that of the stem cells of third-generation PDCs.
When cultured in a human serum medium, periosteum stem cells can not only maintain their shape, but can also attach, maintain activity, and achieve cell growth. In summary, based on these results, human PDCs possess the ability to survive, proliferate, and differentiate into the osteogenic lineage in vitro, which is crucial in evaluating efficacy in vivo. The periosteum is rich in MSCs and is thus suitable for tissue engineering. The periosteum obtained from the gingiva poses fewer complications. Therefore, the alveolar bone is considered an ideal donor site. The results clearly demonstrated the possibility of similarly isolating MSCs from the periosteum and achieving their differentiation into osteoblasts, chondrocytes, and adipocytes. In this study, the effects of Vitamin C on the osteogenic potential of PDCs were compared with those of 1,25-(OH)2D3 at various concentrations. The most effective concentration was 10−8 M 1,25-(OH)2D3. The 10−8 M 1,25-(OH)2D3 treatment throughout the culture period was an effective and economical method of inducing osteogenic differentiation in PDCs. In conclusion, both Vitamin C and 1,25-(OH)2D3 promote the osteogenic differentiation of PDCs. However, these exhibited no significant synergistic effects in ALP activity results. Considering the small sample size, additional samples are required for further evaluation. Thus, PDCs cultured under osteogenic conditions might be useful for bone tissue engineering and offer the advantage of higher cellular proliferation.
Critical steps of this protocol include steps 1.2 and 1.3 (starting the culturing procedure within 24 hours of harvesting and proper maintenance thereafter). Contamination of the tissue must be avoided and use of aseptic technique is mandatory. One limitation of this protocol is that, compared with sourcing stem cells from bone marrow or adipose tissue, sourcing stem cells from dental tissue is limited in terms of the low number of cells that can be obtained through this technique.
The identification and characterization of periosteal stem cells can provide valuable information regarding the functions and regenerative potential of this tissue as well as its applicability in regenerative therapy. An optimal condition was obtained using 10−8 M 1,25-(OH)2D3. Therefore, the treatment of PDCs with 10−8 M 1,25-(OH)2D3 promotes osteogenic differentiation. Future studies should examine the in vivo application of 10−8 M 1,25-(OH)2D3 for effective and economical bone tissue engineering.
Disclosures
The authors have nothing to disclose.
Acknowledgements
The study protocol was approved by the Institutional Review Board for Clinical Research of Chang Gung Memorial Hospital (IRB99-1828B, 100-3019C, 99-3814B, 102-1619C, 101-4728B, and 103-4223C). This study was supported by Chang Gung Memorial Hospital (CMRPG392071, CMRPG3A1141, CMRPG3A1142, and NMRPG3C0151). This manuscript was edited by Wallace Academic Editing.
Materials
| Name | Company | Catalog Number | Comments |
|---|---|---|---|
| 0.25% trypsin-EDTA | Gibco | 25200-056 | |
| 2-phospho-L-ascorbic acidtrisodium salt | Sigma | 49752 | |
| 35-mm culture dishes | Corning | 430165 | |
| 3-isobutyl-1-methylxanthine | Sigma | I5879 | |
| 6 well plate | Corning | 3516 | |
| Alkaline phosphatase | ABI | Hs01029144_m1 | |
| Alkaline Phosphatase Activity Colorimetric Assay Kit | BioVision | K412-500 | |
| avian myeloblastosis virus reverse transcriptase | Roche | 10109118001 | |
| CD146 | BD | 561013 | |
| CD19 | BD | 560994 | |
| CD34 | BD | 560942 | |
| CD44 | BD | 561858 | |
| CD45 | BD | 561088 | |
| CD73 | BD | 561014 | |
| CD90 | BD | 561974 | |
| Cell banker1 | ZEAOAQ | 11888 | |
| core binding factor alpha-1 | ABI | Hs00231692_m1 | |
| dexamethasone | Sigma | D4902 | |
| DPBS | Gibco | 14190250 | |
| FBS | Gibco | 26140-079 | |
| GAPDH | ABI | Hs99999905_m1 | |
| HLA-DR | BD | 562008 | |
| indomethacin | Sigma | I7378 | |
| insulin | sigma | 91077C | |
| insulin–transferrin–selenium-A | Sigma | I1884 | |
| MicroAmp Fast 96 well reaction plate(0.1ml) | Life | 4346907 | |
| MicroAmp optical adhesive film | Life | 4311971 | |
| Minimum Essential Medium 1X Alpha Modification | HyClone | SH30265.02 | |
| Penicillin/Streptomycin | Gibco | 15140-122 | |
| Permeabilization buffer | eBioscience | 00-8333-56 | |
| Sodium pyruvate | Gibco | 11360070 | |
| STRO-1 | BioLegend | 340103 | |
| SYBER Green PCR Master Mix | AppliedBiosystems | 4309155 | |
| TaqMan Master Mix | Life | 4304437 | |
| transforming growth factor-β | Sigma | T7039 | |
| Trizol reagent (for RNA isolation) | Life | 15596018 | |
| β-glycerophosphate | Sigma | G9422 | |
| collagen-1 | Invitrogen | forward primer 5' CCTCAAGGGCTCCAACGAG-3 reverse primer 5'-TCAATCACTGTCTTGCCCCA-3' | |
| OCN | Invitrogen | forward primer 5'-GTGCAGCCTTTGTGTCCAAG-3' reverse primer 5'-GTCAGCCAACTCGTCACAGT-3' | |
| BSP | Invitrogen | forward primer 5' AAAGTGAGAACGGGGAACCT-3' reverse primer 5'-GATGCAAAGCCAGAATGGAT-3' | |
| Commercial ALP primers | |||
| Commercial CBFA1 primers |
References
- Kao, R. T., Murakami, S., Beirne, O. R. The Use of Biologic Mediators and Tissue Engineering in Dentistry. Periodontol. 50, 127-153 (2000).
- Rosenbaum, A. J., Grande, D. A., Dines, J. S. The Use of Mesenchymal Stem Cells in Tissue Engineering: A Global Assessment. Organogenesis. 4, 23-27 (2008).
- Yen, T. H., Wright, N. A., Poulsom, R. Bone Marrow Stem Cells: From Development to Therapy. Horizons in Medicine. Franklyn, J. 16, Royal College of Physicians of London. London, UK. 249-257 (2004).
- Dominici, M., et al. Minimal Criteria for Defining Multipotent Mesenchymal Stromal Cells. The International Society for Cellular Therapy Position Statement. Cytotherapy. 8, 315-317 (2006).
- Gronthos, S., Mankani, M., Brahim, J., Robey, P. G., Shi, S. Postnatal Human Dental Pulp Stem Cells (DPSCs). In Vitro and In Vivo. Proc Natl Acad Sci U S A. 97, 13625-13630 (2000).
- Miura, M., et al. Stem Cells from Human Exfoliated Deciduous Teeth. Proc Natl Acad Sci U S A. 100, 5807-5812 (2003).
- Seo, B. M., et al. Investigation of Multipotent Postnatal Stem Cells from Human Periodontal Ligament. Lancet. 364, 149-155 (2004).
- Sonoyama, W., et al. Mesenchymal Stem Cell-Mediated Functional Tooth Regeneration in Swine. PLOS ONE. 1, e79(2006).
- Morsczeck, C., et al. Isolation of Precursor Cells (PCs) from Human Dental Follicle of Wisdom Teeth. Matrix Biol. 24, 155-165 (2005).
- Mitrano, T. I., et al. Culture and Characterization of Mesenchymal Stem Cells from Human Gingival Tissue. J Periodontol. 81, 917-925 (2010).
- Di Benedetto, A., Brunetti, G., Posa, F., Ballini, A., et al. Osteogenic Differentiation of Mesenchymal Stem Cells from Dental Bud: Role of Integrins and Cadherins. Stem Cell Res. 15, 618-628 (2015).
- Marrelli, M., Paduano, F., Tatullo, M. Cells Isolated from Human Periapical Cysts Express Mesenchymal Stem Cell-like Properties. Int J Biol Sci. 9 (10), Published online Nov 16 1070-1078 (2013).
- Friedenstein, A. J., Piatetzky-Shapiro, I. I., Petrakova, K. V. Osteogenesis in Transplants of Bone Marrow Cells. J Embryol Exp Morphol. 16, 381-390 (1966).
- Perka, C., Schultz, O., Spitzer, R. S., Lindenhayn, K., Burmester, G. R., Sittinger, M. Segmental Bone Repair by Tissue-Engineered Periosteal Cell Transplants with Bioresorbable Fleece and Fabrin Scaffolds in Rabbits. Biomaterials. 21, 1145-1153 (2000).
- Taylor, J. F. The Periosteum and Bone Growth. Hall, B. K. , CRC Press. Boca Raton. Bone Growth VI (1992).
- Squier, C., Ghoneim, S., Kremenak, C. Ultrastructure of the Periosteum from Membrane Bone. J Anat. 171, 233-239 (1990).
- Aubin, J., Triffitt, J. Mesenchymal Stem Cells and Osteoblast Differentiation. Principles of Bone Biology. Bilezikian, J., Raisz, L. G., Rodan, G. A. , Academic Press. San Diego. 59-81 (2002).
- Diaz-Flores, L., Gutierrez, R., Lopez-Alonso, A., Gonzalez, R., Varela, H. Pericytes as a Supplementary Source of Osteoblasts in Periosteal Osteogenesis. Clin Orthop Relat Res. 275, 280-286 (1992).
- Lim, S. M., Choi, Y. S., Shin, H. C., Lee, C. W., Kim, S. L., Kim, D. I. Isolation of Human Periosteum-Derived Progenitor Cells Using Immunophenotypes for Chondrogenesis. Biotechnol Lett. 27, 607-611 (2005).
- Stich, S., et al. Human Periosteum-Derived Progenitor Cells Express Distinct Chemokine Receptors and Migrate Upon Stimulation with CCL2, CCL25, CXCL8, CXCL12, and CXCL13. Eur J Cell Biol. 87, 365-376 (2008).
- Choi, Y. S., et al. Multipotency and Growth Characteristic of Periosteum-Derived Progenitor Cells for Chondrogenic, Osteogenic, And Adipogenic Differentiation. Biotechnol Lett. 30, 593-601 (2008).
- Agata, H., et al. Effective Bone Engineering with Periosteum-Derived Cells. J Dent Res. 86, 79-83 (2007).
- Ribeiro, F. V., et al. Periosteum-Derived Cells as an Alternative to Bone Marrow Cells for Bone Tissue Engineering Around Dental Implants. A Histomorphometric Study in Beagle Dogs. J Periodontol. 81, 907-916 (2010).
- Hayashi, O., et al. Comparison of Osteogenic Ability of Rat Mesenchymal Stem Cells from Bone Marrow, Periosteum and Adipose Tissue. Calcif Tissue Int. 82, 238-247 (2008).
- Hong, H. H., Hong, A., Yen, T. H., Wang, Y. L. Potential Osteoinductive Effects of Calcitriol onthe m-RNA of Mesenchymal Stem Cells Derived from Human Alveolar Periosteum. BioMed Res Int. , Article ID 3529561 (2016).
- Knothe, U. R., Dolejs, S., Miller, R. M., Knothe Tate, M. L. Effects of Mechanical Loading Patterns, Bone Graft, and Proximity to Periosteum on Bone Defect Healing. J Biomech. 43, 2728-2737 (2010).
- McBride, S. H., Dolejs, S., Brianza, S., Knothe, U. R., Knothe Tate, M. L. Net Change in Periosteal Strain During Stance Shift Loading After Surgery Correlates to Rapid de novo Bone Generation in Critically Sized Defects. Ann Biomed Eng. 39, 1570-1581 (2011).
- Curtis, K. M., Aenlle, K. K., Roos, B. A., Howard, G. A. 24R,25-Dihydroxyvitamin D3 Promotes the Osteoblastic Differentiation of Human Mesenchymal Stem Cells. Mol Endocrinol. 28 (5), 644-658 (2014).
- Mostafa, N. Z., et al. Osteogenic Differentiation of Human Mesenchymal Stem Cells Cultured with Dexamethasone, Vitamin D3, Basic Fibroblast Growth Factor, and Bone Morphogenetic Protein-2. Connect Tissue Res. 53 (2), 117-131 (2012).
- Sun, Y., Yang, X., Li, F., Dou, Z. Study on Differentiation of Embryonic Stem Cells into Osteoblast in vitro Inducing by 1,25(OH)2VD3. Zhongguo Xiu Fu Chong Jian Wai Ke Za Zhi. 22 (9), 1117-1120 (2008).
- Ishii, M., Koike, C., Igarashi, A., et al. Molecular Markers Distinguish Bone Marrow Mesenchymal Stem Cells from Fibroblasts. Biochem Biophys Res Commun. 332, 297-303 (2005).
- Maund, S. L., Barclay, W. W., Hover, L. D., et al. Interleukin-1α Mediates the Antiproliferative Effects of 1,25-Dihydroxyvitamin D3 in Prostate Progenitor/Stem Cells. Cancer Res. 71, 5276-5286 (2011).
- Mitrano, T. I., Grob, M. S., Carrión, F., Nova-Lamperti, E., Luz, P. A., Fierro, F. S., Quintero, A., Chaparro, A., Sanz, A. Culture and Characterization of Mesenchymal Stem Cells From Human Gingival Tissue. J Periodontol. 81 (6), 917-925 (2010).
- Curtis, K. M., Aenlle, K. K., Roos, B. A., Howard, G. A. 24R,25-Dihydroxyvitamin D3 Promotes the Osteoblastic Differentiation of Human Mesenchymal Stem Cells. Mol Endocrinol. 28, 644-658 (2014).
- Ippolito, G., Schiller, P. C., Ricordi, C., Roos, B. A., Howard, G. A. Age Related Osteogenic Potential of Mesenchymal Stromal Stem Cells from Human Vertebral Bone Marrow. J Bone Miner Res. 14, 1115-1122 (1999).
- D'Stucki, U., et al. Temporal and Local Appearance of Alkaline Phosphatase Activity in Early Stages of Guided Bone Regeneration. A Descriptive Histochemical Study in Humans. Clin Oral Implants Res. 12, 121-127 (2001).
- Caplan, A. I., Bruder, S. P. Mesenchymal stem cells: building blocks for molecular medicine in the 21st century. Trends Mol Med. 7, 259-264 (2001).
- Knothe Tate, M. L., Falls, T., McBride, S. H., Atit, R., Knothe, U. R. Mechanical Modulation of Osteochondroprogenitor Cell Fate. Int J Biochem Cell Biol. 40, 2720-2738 (2008).
- Yoshimura, H., Muneta, T., Nimura, A., Yokoyama, A., Koga, H., Sekiya, I. Comparison of Rat Mesenchymal Stem Cells Derived from Bone Marrow, Synovium, Periosteum, Adipose Tissue, and Muscle. Cell Tissue Res. 327, 449-462 (2007).
- Tanaka, H., Ogasa, H., Barnes, J., Liang, C. T. Actions of bFGF on Mitogenic Activity and Lineage Expression in Rat Osteoprogenitor Cells: Effect of Age. Mol Cell Endocrinol. 150, 1-10 (1999).
- Zhou, S., et al. Clinical characteristics influence in vitro action of 1,25-dihydroxyvitamin D(3) in human marrow stromal cells. J Bone Miner Res. 27 (9), 1992-2000 (1992).
- Pittenger, M. F., et al. Multilineage Potential of Adult Human Mesenchymal Stem Cells. Science. 284, 143-147 (1999).
- Jørgensen, N. R., Henriksen, Z., Sorensen, O. H., Civitelli, R. Dexamethasone, BMP-2, and 1,25-dihydroxyvitamin D enhance a more differentiated osteoblast phenotype: validation of an in vitro model for human bone marrow-derived primary osteoblasts. Steroids. 69, 219-226 (2004).
- Khanna-Jain, R., et al. Vitamin D(3) Metabolites Induce Osteogenic Differentiation in Human Dental Pulp and Human Dental Follicle Cells. J Steroid BiochemMol Biol. 122 (3), 133-141 (2010).
- Lee, J. H., O'Keefe, J. H., Bell, D., Hensrud, D. D., Holick, M. F. Vitamin D Deficiency an Important, Common, and Easily Treatable Cardiovascular Risk Factor? J Am Coll Cardiol. 52, 1949-1956 (2008).
- Liu, P., Oyajobi, B. O., Russell, R. G., Scutt, A. Regulation of osteogenic differentiation of human bone marrow stromal cells: interaction between transforming growth factor-beta and 1,25(OH)(2) vitamin D(3) In vitro. Calcif Tissue Int. 65 (2), 173-180 (1999).
- Beresford, J. N., Gallagher, J. A., Russell, R. G. G. 1,25-Dihydroxyvitamin D3 and Human Bone-Derived Cells In Vitro: Effects on Alkaline Phosphatase, Type I Collagen and Proliferation. Endocrinology. 119, 1776-1785 (1986).
- Price, P. A., Baukol, S. A. 1,25-Dihydroxyvitamin D3 Increases Synthesis of the Vitamin K-Dependent Bone Protein by Osteosarcoma Cells. J Biol Chem. 255, 11660-11663 (1986).
- Kawase, T., Oguro, A. Granulocyte Colony-Stimulating Factor Synergistically Augments 1, 25-Dihydroxyvitamin D3-Induced Monocytic Differentiation in Murine Bone Marrow Cell Cultures. Horm Metab Res. 36, 445-452 (2004).
- Fujisawa, R., Tamura, M. Acidic Bone Matrix Proteins and Their Roles in Calcification. Front Biosci. (Landmark Ed). 17, 1891-1903 (2012).
- van Driel, M., et al. Evidence that Both 1α,25 Dihydroxyvitamin D3 and 24-Hydroxylated D3 Enhance HuMan Osteoblast Differentiation and Mineralization. J Cell Biochem. 99, 922-935 (2006).
- Atkins, G. J., et al. Metabolism of Vitamin D3 in Human Osteoblasts: Evidence for Autocrine and Paracrine Activities of 1 α ,25-Dihydroxyvitamin D3. Bone. 40, 1517-1528 (2007).
- Kerner, S. A., Scott, R. A., Pike, J. W. Sequence Elements in the Human Osteocalcin Gene Confer Basal Activation and Inducible Response to Hormonal Vitamin D3. Proc Natl Acad Sci U S A. 86, 4455-4459 (1989).
- Viereck, V., et al. Differential Regulation of Cbfa1/Runx2 and Osteocalcin Gene Expression by Vitamin-D3, Dexamethasone, and Local Growth Factors in Primary Human Osteoblasts. J Cell Biochem. 86, 348-356 (2002).
- Shi, X., et al. In-vitro osteogenesis of synovium stem cells induced by controlled release of bisphosphate additives from microspherical mesoporous silica composite. Biomaterials. 30, 3996-4005 (2009).
- Sakaguchi, Y., Sekiya, I., Yagishita, K., Muneta, T. Comparison of Human Stem Cells Derived from Various Mesenchymal Tissues: Superiority of Synovium as a Cell Source. Arthritis Rheum. 52, 2521-2529 (2005).
Reprints and Permissions
