Here we present a protocol for the fabrication of C60/graphene hybrid nanostructures by physical thermal evaporation. Particularly, the proper manipulation of deposition and annealing conditions allow the control over the creation of 1D and quasi 1D C60 structures on rippled graphene.
Method Article
Preparation and Characterization of C60/Graphene Hybrid Nanostructures
In This Article
Summary
Abstract
Physical thermal deposition in a high vacuum environment is a clean and controllable method for fabricating novel molecular nanostructures on graphene. We present methods for depositing and passively manipulating C60 molecules on rippled graphene that advance the pursuit of realizing applications involving 1D C60/graphene hybrid structures. The techniques applied in this exposition are geared towards high vacuum systems with preparation areas capable of supporting molecular deposition as well as thermal annealing of the samples. We focus on C60 deposition at low pressure using a homemade Knudsen cell connected to a scanning tunneling microscopy (STM) system. The number of molecules deposited is regulated by controlling the temperature of the Knudsen cell and the deposition time. One-dimensional (1D) C60 chain structures with widths of two to three molecules can be prepared via tuning of the experimental conditions. The surface mobility of the C60 molecules increases with annealing temperature allowing them to move within the periodic potential of the rippled graphene. Using this mechanism, it is possible to control the transition of 1D C60 chain structures to a hexagonal close packed quasi-1D stripe structure.
Introduction
This protocol explains how to deposit and manipulate C60 molecules on graphene such that 1D and quasi-1D C60 chain structures can be realized. The techniques in this experiment were developed to address the need to guide adsorbates into desirable configurations without having to rely on manual manipulation, which is slow and can require great effort. The procedures described here rely on the use of a high vacuum system with a sample preparation area capable of supporting molecular deposition and thermal annealing of the samples. STM is used to characterize the samples, but other molecular resolution techniques may be applied.
The thermal evaporation of molecules within a Knudsen cell is an efficient and clean way to prepare thin films. In this protocol, a Knudsen cell is used to evaporate C60 molecules onto a graphene substrate. This Knudsen cell evaporator mainly consists of a quartz tube, a heating filament, thermocouple wires, and feedthroughs1,2,3. The quartz tube is used to accommodate the molecules, the tungsten filament heats the molecules in the quartz tube through applied current, and the thermocouple wires are used to measure the temperature. In the experiments, the deposition rate is controlled by tuning the temperature source in the Knudsen cell. The thermocouple wires are attached to the outside wall of the quartz tube and therefore typically measure a temperature of the outside wall that is slightly different from the temperature inside of the cell where the molecular source is located. To obtain the exact temperature in the quartz tube, we performed calibration using two thermocouple setups to measure temperatures inside and outside the tube and recorded the temperature difference. In this way, we can more precisely control the temperature of the source during the molecular evaporation experiments using thermocouple wires attached to the outside of the quartz tube. Because a small amount of the sublimated molecules will be in a gaseous phase at a lower pressure, when the molecules are evaporated, there is usually an associated pressure change. Therefore, we monitor the change of the pressure in the load lock carefully.
This evaporator can be used to deposit various molecule sources such as C60, C70, boron subphthalocyanine chloride, Ga, Al, and Hg4,5,6,7,8. Compared with other thin film preparation techniques, for instance, spin casting9,10,11, the thermal evaporation in high vacuum is much cleaner and versatile since there is no solvent required for the deposition. Furthermore, the degassing process before deposition improves the purity of the source, eliminating possible impurities.
Protocol
1. Preparation of the Homemade Knudsen Cell
- Prepare components for Knudsen cell
- Purchase a CF flanged based power feedthrough (2.75" CF, 4 pins stainless steel). Drill two threaded holes through the feedthrough, at the cross points between one diameter 1.30" line and its circumference.
- Prepare a glass tube (0.315" outside diameter (OD), 2.50" length).
- Purchase thin copper sheets (99.9%) with 0.005" thickness. Cut one sheet to the dimensions of 7.5" L x 5.0" W using a pair of scissors, then curl it to a hollow columniform shield with a 1.45" diameter by hand (Figure 1a).
- Prepare the type K thermocouple (chromel/alumel) with a 0.005" diameter by cutting a 3" length for both the chromel and alumel wires. Peel the insulator layers about 0.5" in length from both ends of both wires.
- Cut a 0.01" diameter tungsten wire (99.95%) to a length of approximately 60". Coil it into a spring shape with a diameter 0.315" by wrapping tightly it around a rod of a comparable diameter of the glass tube.
- Purchase a ceramic piece. Prepare one suitable cuboid piece with a hole in the middle that fits the dimension of the glass (5 in Figure 1b).
- Cut 2 standard steel threaded 0.10" diameter rods to a 7" length by banding and sawing with a lathe machine.
- Cut a soft, 0.01" diameter copper wire to an approximate 30" length using a scissor.
- Prepare 4 hollow copper rods with a 0.094" OD diameter by cutting three rods to a 2" length, and one rod to a 4" length using a side cutter.
- Assemble these pieces in the Knudsen cell
- Clean all the components mentioned in step 1.1 using ultrasonic cleaning at 42 kHz in acetone for 30 min.
- Mount 2 standard steel threaded rods in the drilled holes in the CF flange of the power feedthrough.
NOTE: The holes are threaded (7 in Figure 1b). - Mount the bottom half of the 4 hollow copper rods in the top part of the 4 pins of the CF flanged power feedthrough by inserting the pin into the hollow copper rods and fixing them by a side cutter (6 in Figure 1b).
- Mount the ceramic piece at the position of 2.5" high from the bottom of the threaded rods with soft copper wire.
NOTE: This piece will support the glass tube in the following step (5 in Figure 1b). - Slide the glass tube into the curled tungsten spring. Squeeze the bottom of the glass tube into the hole of the ceramic piece. Use soft copper wire to hold the top end of the glass tube to the top end of the threaded rods (3 and 4 in Figure 1b).
- Grip the top end of the spring into the longer copper rod, defined as A. Grip the bottom end of the spring into one of the shorter copper rods, defined as B (A and B in Figure 1b).
- Twist one peeled end of both the chromel and alumel wires together (2 in Figure 1b).
- Position the twisted joint end so that it closely touches the outside bottom of the glass tube. Immobilize it with the help of the ceramic piece.
- Grip the other peeled end of the chromel wire into one of the left 2 shorter copper rods, defined as C. Grip the other peeled end of the alumel wire into the left shorter copper rod, defined as D (C and D in Figure 1b).
- Put the curled copper hollow columniform shield on the CF flanged power feedthrough (Figure 1a).
2. Prepare the C60 Source in the Homemade Knudsen Cell
- Load the C60 source in the homemade Knudsen cell.
- Load approximately 50 mg of C60 powder (99.5% purity) into the glass tube of the homemade Knudsen cell.
NOTE: Precision beyond 1 mg of the mass of the powder is unnecessary. - Mount the Knudsen cell back onto one branch of the load lock.
- Load approximately 50 mg of C60 powder (99.5% purity) into the glass tube of the homemade Knudsen cell.
- Pump the load lock.
- Turn on the pump for the load lock. First turn on the water valve for cooling the turbo pump, then turn on the fan to cool the mechanical pump. Then turn on the mechanical pump and finally turn on the turbo pump.
- Check the pressure in the load lock and wait about 10 h.
NOTE: The pressure at the outlet of the turbo pump should be 6.0 x 10⁻² mbar. - Turn on the ion gauge mounted in the load lock to a lower pressure (typically below 10-6 mbar).
- Check the pressure in the load lock: the pressure should be in the range of 10-8 mbar after 10 h pumping.
- Anneal the C60 source in the homemade Knudsen cell.
- Anneal the C60 source in the homemade Knudsen cell gradually (1.5 °C/min) at 250 °C for 2 h for degassing by connecting a power supply on two pins of the CF flanged power feedthrough, which are connected to the curled tungsten spring.
- Increase the annealing temperature to 300 °C, which is above the deposition temperature (270 °C).
- Anneal at 300 °C for 0.5 h for further degassing.
- Decrease the temperature to 270 °C for deposition.
3. Prepare Atomically Clean Graphene in the UHV Chamber
- Transfer the graphene (on copper foil) from the sample storage carousel to the annealing plate in the ultra-high vacuum preparation chamber of the STM system (a special place for preparing and annealing a sample under ultra-high vacuum).
- Anneal the graphene substrate at a base pressure of low 10-10 mbar within the preparation chamber by gradually increasing the temperature to 400 °C.
- Wait for 12 h to remove residual impurities on the graphene surface.
- Decrease the annealing temperature for graphene substrate gradually to room temperature.
4. Deposit the C 60 onto Graphene Substrate Using the Homemade Knudsen Cell in Load Lock
- Transfer the graphene substrate to the load lock.
- Arrange the plate in the preparation chamber in the transferring position. Transfer the atomically clean graphene to the load lock for deposition C60, after having the atomically clean graphene and C60 source ready.
- Open the valve between the load lock and the preparation chamber.
- Transfer the graphene substrate from the plate in the preparation chamber to the load lock with the loadout tool.
- Put the graphene substrate face down (the C60 comes from the source below).
- Deposit the C60 onto the graphene substrate.
NOTE: C60 molecules transfer from the homemade Knudsen cell to the graphene substrate at 270 °C.- Wait for 1 min with a deposition rate of 0.9 monolayer/min.
- Transfer the C60/graphene sample back to the preparation chamber.
5. Prepare the C 60 /Graphene Sample to be Measured in STM Main Chamber
- Anneal the C60/graphene sample to 150 °C with a rate of 3.1 °C/min for 2 h in the ultra-high vacuum preparation chamber.
- Scan the C60/graphene sample with STM in the STM main chamber.
- Anneal the C60/graphene sample to 210 °C with a rate of 3.1 °C/min for 2 h.
- Scan the C60/graphene sample with STM.
Results
Following evaporation, the graphene with the newly deposited C60 is annealed at 150 °C for 2 h. The large-scale STM image in Figure 2a shows a characteristic quasi-1D C60 chain structure found after this initial annealing process. A closer inspection in Figure 2b reveals detailed information of this 1D structure, in which each bright spherical protrusion represents one single C60 molecule. Typically, the 1D chains occur as bimolecular and trimolecular C60 chains with an average C60-C60 distance of 1.00 ± 0.01 nm, indicating that the C60 molecules arrange in a hexagonal close packed manner. The line profile in Figure 2c corresponding to the dashed green line in Figure 2b shows clear separation between the C60 chains where the second and the third peaks in the profile are nearest neighbor molecules on adjacent chains. According to observations, the chains exist exclusively as bimolecular or trimolecular rows with the bimolecular chains occurring twice as frequently as the trimolecular chains. As observed in the high-resolution STM images, the chains are well arranged in either a 3-2-2 or 2-3-2 manner. There may occur some junctions within one chain where a trimolecular segment can jump to a bimolecular arrangement, or vice versa.
The growth of the quasi-1D C60 chains is induced by the underneath graphene substrate. The high-resolution STM image of the atomically clean graphene substrate (Figure 1c) shows a rippled structure. This well-defined linear periodic modulation causes C60 molecules to form the quasi-1D chains. The sample is subsequently annealed at 210 °C for 2 h in order to investigate thermal influences on the C60/graphene 1D nanostructures. Annealing at a higher temperature increases the surface mobility of the C60 molecules, allowing them to self-assemble into a more compact, hexagonal close packed quasi-1D stripe structure, as shown in Figure 3a. These structures orient along the same direction as the C60 chains and are observed with widths varying between 3 and 8 molecules per stripe, as shown in Figure 3b. The most common stripes have a width of six C60 rows, occurring 45% of the time, while 5-row stripes are the second most likely stripe structure. In this structure, there is no space separating neighboring stripes. An obvious difference from the gently annealed C60 chain structure is that the stripes are not formed on a single flat terrace, but on staggered narrow terraces, shown as nearly straight and parallel step edges (Figure 3b, c). The two rows at the boundary of each step edge, one on the upper terrace and one on the lower terrace, assume a denser arrangement relative to one another, having only a lateral inter-row spacing of 0.75 ± 0.01 nm. This arrangement presumably accommodates the underlying terraces that formed after the higher temperature annealing. On the terrace planes, the C60 molecules still maintain a close-packed pattern with the same intermolecular spacing characteristic of C60-C60. The C60 row near the step edge on the upper terrace appears to be around 0.5 Å higher than the other C60 rows on the same terrace; this is likely due to different local electronic environments as shown in Figure 3b, c. Similar to the previous chain structure, there are junctions for neighboring stripes. To compare these two different structures more systematically, we use 3D models to illustrate them. Figure 4a, c is the top and side view of the schematic model for the C60 chains, respectively, with C60 molecules (dark green spheres) and honeycomb structure of graphene substrate (small blue spheres). Here, the unit of the chain structure is defined to be a bimolecular cell (chain plus one interchain spacing) plus an adjacent trimolecular cell. The 3D model clearly shows the size of one unit as 5.08 ± 0.02 nm. The larger gap spacing (1.23 nm) between adjacent chains is labeled in Figure 4a, c. Figure 4b,d shows the 3D schematic model of the 6-row stripe structure. The narrower inter-row spacing between two adjacent C60 stripes is 0.75 nm as labeled in Figure 4b, which is smaller than the typical hexagonal close packed structure. These typical 6-row stripes have a lateral periodicity of 5.08 ± 0.02 nm, almost exactly equal to the lateral spacing of the unit size of the chain structure12.
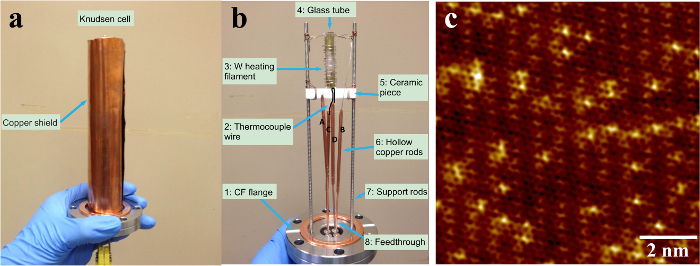
Figure 1. Homemade Knudsen cell and atomically resolved STM image of graphene substrate. (a) The homemade Knudsen cell with the copper shell. (b) The detailed structure of the homemade Knudsen cell showing the main components inside the copper shell. 1 is CF flange, 2 is thermocouple wire, 3 is W heating filament, 4 is glass tube, 5 is ceramic piece, 6 is hollow copper rods (A, B, C, D), 7 is supporting rods, 8 is feedthrough. (c) Atomically resolved STM topographic image of a clean graphene surface12. Figure 1c has been modified from12. Please click here to view a larger version of this figure.
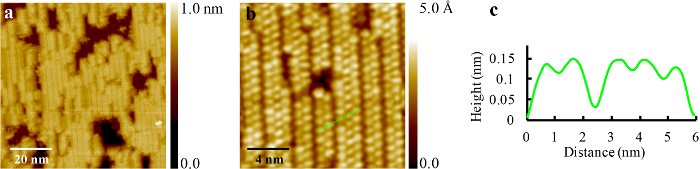
Figure 2. STM images of C60 chains after annealing at 150 °C. (a) C60 forms well-ordered 1D chains on graphene over scales much larger than an individual chain (Vs = 2.255 V, I = 0.300 nA). (b) Molecular resolution STM image of C60 nanostructures showing the occurrence of only bimolecular or trimolecular chains. Intermolecular spacing within a chain is 1.0 nm while the distance between the centers of adjacent C60 rows belonging to neighboring chains is 1.23 nm, which is much larger than the inter-row distance of 0.87 nm in the close packed C60 structure (I = 0.500 nA, Vs = 1.950 V). (c) A line profile showing the intermolecular distance and gap between adjacent chains along the dashed green line in (b)12. This figure has been modified from12. Please click here to view a larger version of this figure.
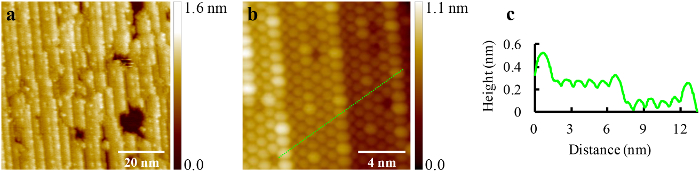
Figure 3. Self-assembled quasi-hexagonal close packed 1D C60 stripe structure on graphene after raising the annealing temperature to 210 °C. (a) STM image showing quasi-hexagonal close packed C60 1D stripes oriented along the same axis (I = 0.200 nA, Vs = 2.200 V). (b) High-resolution STM image of C60 1D stripes (I = 0.200 nA, Vs = 2.400 V). (c) A line profile showing the hexagonal close packed C60 1D stripes on two terraces along the dashed green line in (b)12. This figure has been modified from12. Please click here to view a larger version of this figure.
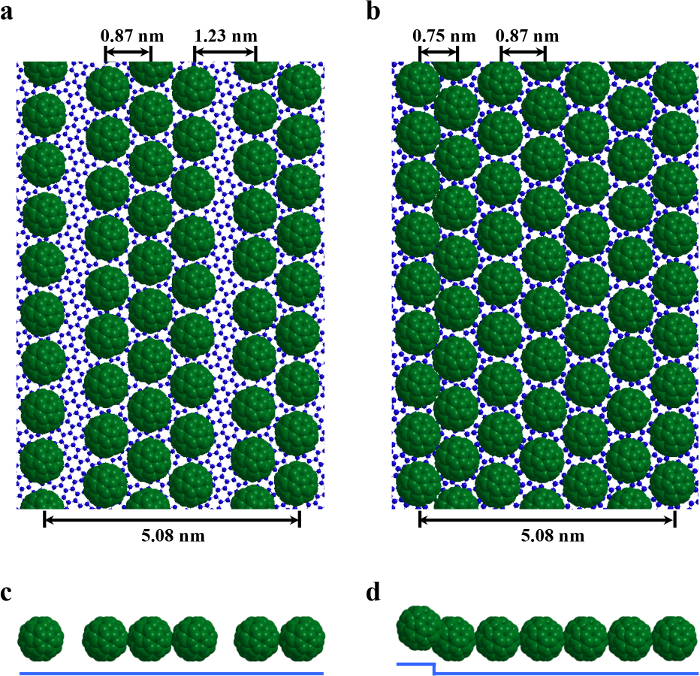
Figure 4. Schematic models. Schematic models for both C60 chains and stripes depicting the graphene as the smaller, underlying blue spheres and the C60 molecules as the dark green, space-filling spheres. (a, c) Top and side views of bimolecular and trimolecular C60 chains on graphene. (b, d) Top and side views of the typical C60 stripe with 6-row width12. This figure has been modified from12. Please click here to view a larger version of this figure.
Discussion
The techniques described in this protocol are designed for thermal deposition of organic materials and other high vapor pressure materials. These techniques can be integrated with ultra-high vacuum systems that have sample preparation areas capable of supporting molecular evaporation as well as thermal annealing. The aim for this specific experiment is to deposit C60 molecules on graphene substrate and study the self-assembly of C60 and the thermal effect.
The benefit of the method is that it provides a super clean sample when compared with other thin film preparation methods, like spin coating. Compared with more complex technologies like chemical vapor deposition (CVD), this physical thermal evaporation is much easier to realize and fit for stable atoms and molecules deposition. Atomic and molecular resolution imaging are required to observe the C60/graphene hybrid nanostructures. STM is used in this exposition. It is critical to maintain the purity of the substrate and C60 source throughout deposition by degassing and annealing ahead of time and maintaining a high vacuum throughout the process. Proper post-deposition annealing is crucial to obtain the 1D and quasi-1D nanostructures, as this technique exploits the variable nature of C60 surface mobility under various thermal conditions.
STM measurement demonstrates that the C60/graphene sample synthesized by the physical thermal deposition method is atomically clean. The space in the load lock is designed to be very limited to achieve an ultra-high vacuum in a rather short time. The molecule deposition needs to be completed in such a small space that a homemade Knudsen cell becomes necessary. The homemade Knudsen cell evaporator is mounted in the load lock chamber and can be baked separately, which is also helpful for changing the molecules or refilling the evaporator12. The highest deposition temperature for this homemade Knudsen cell is 450 °C, as determined by the CF Flanged Power Feedthrough. It is critical to degas the C60 source in the homemade Knudsen cell at 300 °C to guarantee the purity of C60 when deposited at 270 °C. It is also very important to anneal the graphene substrate just before the molecule deposition so that it is at its cleanest state at the beginning of the deposition. A binary system can also be achieved by adding one more homemade Knudsen cell evaporator on the opposite side of the first one.
Disclosures
We have nothing to disclose.
Acknowledgements
This work is supported by the U.S. Army Research Office under the grant W911NF-15-1-0414.
Materials
| Name | Company | Catalog Number | Comments |
|---|---|---|---|
| CF Flanged power feedthrough | Kurt J. Lesker | EFT0042033 | |
| Copper sheets | Alfa Aesar | 7440-50-8 | |
| Thermocouple chromel/alumel wires | Omega Engineering | ST032034/ST080042 | |
| Tungsten wires | Alfa Aesar | 7440-33-7 | |
| Stainless steel rods | McMaster-Carr | 95412A868 | |
| Copper wires | McMaster-Carr | 8873K28 | |
| Hollow copper rods | McMaster-Carr | 7190K52 | |
| C60 | MER Corporation | MR6LP |
References
- Gutzler, R., Heckl, W. M., Lackinger, M. Combination of a Knudsen effusion cell with a quartz crystal microbalance: In situ measurement of molecular evaporation rates with a fully functional deposition source. Review of Scientific Instruments. 81, 015108(2010).
- de Barros, A. L. F., et al. A simple experimental arrangement for measuring the vapour pressures and sublimation enthalpies by the Knudsen effusion method: Application to DNA and RNA bases. Nuclear Instruments & Methods in Physics Research Section a-Accelerators Spectrometers Detectors and Associated Equipment. 560, (2006).
- Shukla, A. K., et al. Versatile UHV compatible Knudsen type effusion cell. Review of Scientific Instruments. 75, 4467(2004).
- Cho, J., et al. Structural and Electronic Decoupling of C60 from Epitaxial Graphene on SiC. Nano Letters. 12, 3018(2012).
- Jung, M., et al. Atomically resolved orientational ordering of C60 molecules on epitaxial graphene on Cu(111). Nanoscale. 6 (111), 11835(2014).
- Li, G., et al. Self-assembly of C60 monolayer on epitaxially grown, nanostructured graphene on Ru(0001) surface. Applied Physics Letters. 100 (0001), 013304(2012).
- Lu, J., et al. Using the Graphene Moire Pattern for the Trapping of C60 and Homoepitaxy of Graphene. Acs Nano. 6, 944(2012).
- Zhou, H. T., et al. Direct imaging of intrinsic molecular orbitals using two-dimensional, epitaxially-grown, nanostructured graphene for study of single molecule and interactions. Applied Physics Letters. 99, 153101(2011).
- Belaish, I., et al. Spin Cast Thin-Films of Fullerenes and Fluorinated Fullerenes - Preparation and Characterization by X-Ray Reflectivity and Surface Diffuse-X-Ray Scattering. Journal of Applied Physics. 71, 5248(1992).
- Bezmel'nitsyn, V. N., Eletskii, A. V., Okun', M. V. Fullerenes in solutions. Uspekhi Fizicheskikh Nauk. 168, 1195(1998).
- Ma, D. N., Sandoval, S., Muralidharan, K., Raghavan, S. Effect of surface preparation of copper on spin-coating driven self-assembly of fullerene molecules. Microelectronic Engineering. 170, 8(2017).
- Chen, C. H., Zheng, H. S., Mills, A., Heflin, J. R., Tao, C. G. Temperature Evolution of Quasi-one-dimensional C60 Nanostructures on Rippled Graphene. Scientific Reports. 5, 14336(2015).
Reprints and Permissions
