This paper uses a flow-cytometry-based assay to screen libraries of chemical inhibitors for the identification of inhibitors and their targets that influence T-cell receptor signaling. The methods described here can also be expanded for high-throughput screenings.
Method Article
Identification of Mediators of T-cell Receptor Signaling via the Screening of Chemical Inhibitor Libraries
* These authors contributed equally
In This Article
Summary
Abstract
The T-cell receptor (TCR) signaling pathway comprises a multitude of mediators that transmit signals upon the activation of the TCR. Different strategies have been proposed and implemented for the identification of new mediators of TCR signaling, which would improve the understanding of T-cell processes, including activation and thymic selection. We describe a screening assay that enables the identification of molecules that influence TCR signaling based on the activation of developing thymocytes. Strong TCR signals cause developing thymocytes to activate apoptotic machinery in a process known as negative selection. Through the application of kinase inhibitors, those with targets that affect TCR signaling are able to override the process of negative selection. The method detailed in this paper can be used to identify inhibitors of canonical kinases with established roles in the TCR signaling pathways and also inhibitors of new kinases yet to be established in the TCR signaling pathways. The screening strategy here can be applied to screens of higher throughput for the identification of novel druggable targets in TCR signaling.
Introduction
T cells are a lineage of lymphocytes that play a pivotal role in the maintenance of adaptive immunity. They express the TCR, which enables them to recognize their ligands, complexes consisting of a major histocompatibility complex molecule (MHC) with a bound peptide, which are found on the surfaces of antigen-presenting cells (APCs). The triggering of the TCR signaling pathway through the TCR/MHC interaction is crucial for T-cell activation and development1.
In T-cell development, bone-marrow-derived hematopoietic stem cells (HSCs) migrate to the thymus, where they undergo differentiation and go through the stages of T-cell lineage progression2. Double-positive (DP) thymocytes, expressing both the CD4 and CD8 coreceptors, engage with self-peptide/MHC on the APCs. Thymocytes with a moderate affinity for their self-peptide/MHC ligands mature to become single-positive (SP) CD4 or CD8 thymocytes, a process termed as positive selection. Conversely, thymocytes that receive excessive TCR stimulation through the self-peptide/MHCs undergo apoptosis via negative selection3,4. This process of stimulation-induced, caspase-dependent apoptosis can be mimicked in vitro by stimulating the thymocytes, for example with anti-CD3/28 antibody-coated beads5. Mature T cells that pass the selection process are activated by non-self-peptide/MHC ligands from APCs in the periphery. Self-peptide/MHCs are still relevant for peripheral T cells, in the context of tonic signaling for survival and homeostatic proliferation, the differentiation of helper T cells, and the enhancement of T-cell responses to non-self-peptide/MHCs through coagonism6,7,8,9. High-affinity TCR binding to the peptide/MHC ligand activates several downstream signaling pathways, which involve many signaling molecules forming a complex TCR signaling network10. The TCR signaling pathways have been studied for several decades, and yet the discovery of new mediators of the pathway shows no sign of abating11,12. The modulation of TCR signaling pathways has clinical relevance and can involve potentiating T-cell responses for immunotherapeutic applications or the inhibition of T-cell responses for the control of autoimmunity13. Strategies for the modulation of T-cell responses mainly depend on the disruption of kinase or phosphatase activity14,15,16.
We describe an application of a flow-cytometry-based assay for the screening of small chemical compounds for their ability to modulate TCR signaling and T-cell activation17. The assay hinges on the phenomenon of thymocytes activating the apoptosis pathway when exposed to strong TCR signals. The assay is sufficiently sensitive to identify changes in stimulation strength; incubating thymocytes expressing transgenic TCR with peptide/MHC tetramers with increasing affinity resulted in a corresponding increase in caspase activation-used as a measure of the apoptotic response5. For the screen, we used a library of kinase inhibitors and assessed their ability to modulate the thymocyte response to strong TCR signals.
Several flow-cytometry-based or fluorescence-reporter-based strategies have been described for the high-throughput screening of an assortment of peripheral activation phenotypes in various T-cell subsets. Such strategies include the use of genetic fluorescent reporters to assess the timing and magnitude of T-cell activation18, the use of degranulation as a readout of cytotoxic T-cell activity19,20, and the analysis of the phosphorylation of various proteins involved in cellular signaling21.
The screening assay presented here is able to successfully identify compounds that inhibit canonical molecules of the TCR signaling pathway, as well as potential, novel compounds with inhibitory effects on TCR signaling. For example, we identified inhibitors of GSK3β and Hsp90 as new compounds affecting T-cell responses17. The assay is able to distinguish the inhibitors that interfere with signal transduction, due to a reduction in the apoptotic response, from the TCR-independent effects of the inhibitors on cellular toxicity. In addition to the induction of apoptosis, we also measure CD69 upregulation and TCR downregulation as markers of activation. As TCR signaling networks are complex, the use of multiple readouts can increase the chances of discovering molecules with specific effects on a single pathway. Here, we also introduce the use of a centrifugation-independent protocol as a high-throughput alternative to the original protocol during the staining of the cells in preparation for the flow cytometric analysis. The assay described in this paper uses a small compound library of kinase inhibitors but, in principle, it can be used for higher throughput screening. The library of choice can also incorporate a variety of inhibitors or other molecules.
Protocol
In this study, 6- to 8-week-old male and female C57Bl/6 mice were used. The mice were bred in the animal facility at the National University of Singapore (Singapore). The National University of Singapore Institutional Animal Care and Use Committee (IACUC) approved all animal experimentation.
1. Preparation of Thymocyte Suspension
- Euthanize the mice in a CO2 chamber.
- Perform subsequent steps in a tissue-culture hood to avoid any contamination of the cell cultures. Secure the mouse carcass to the dissection board, using pins, and spray the mouse with 70% ethanol.
- Using a pair of scissors, make a vertical incision on the ventral side, starting from the abdomen toward the jaw. Make further incisions along each of the hind legs. Stretch the skin to expose the rib cage and pin it down.
- Cut the diaphragm and both sides of the rib cage from the posterior end with a pair of scissors. Lift the rib cage and pin it down to expose the thymus. Separate the connective tissues attached to the thymus and extract the thymus using a pair of curved forceps.
- Place the thymus into a well of a 6-well plate containing 5 mL of complete RPMI media.
NOTE: Consider adding 10% charcoal-stripped fetal bovine serum (FBS) to the media to improve the thymocyte viability if a long waiting time is expected between the dissection and the stimulation assay. - Gently mash the thymus, using the blunt end of a syringe, and pass the cells through a 70 µM cell strainer. Alternatively, to collect thymocytes in a healthier condition, consider using two pairs of forceps to squeeze the thymus and collect the thymocytes that flow out of the thymic epithelium.
- Proceed to cell counting, using a hemocytometer or any automated cell counting instrument.
2. Titration of Kinase Inhibitors to Nontoxic Concentrations
NOTE: This section focuses on preparing the inhibitors for use in the T-cell activation screens. Inhibitors used at high concentrations can cause cell death, which is a readout of the T-cell activation screens. The series of dilutions of the inhibitors aims to determine the final concentration of the individual inhibitors that should not induce apoptosis independent of TCR stimulation. The library of kinase inhibitors used in this study was purchased from an external vendor. The list of inhibitors is included in the Table of Materials.
- Preparation of plates of kinase inhibitors at lower concentrations
- To prepare a plate of inhibitors at 1 mM, add 10 µL of inhibitors to 90 µL of dimethyl sulfoxide (DMSO) for all inhibitors.
NOTE: The inhibitors from the small-molecule library used in this study come at a stock concentration of 10 mM. If the inhibitors are in a pellet form, follow the recommended reconstitution steps from the suppliers. If the inhibitors are not provided at 10 mM, prepare the inhibitor plates at alternative appropriate concentrations instead, and prepare separate serial dilutions of the inhibitors with a suitable dilution factor.
CAUTION: In cases of toxic inhibitors, follow the manufacturer's instructions on safe handling and disposal. - To prepare a plate of inhibitors at 0.1 mM, add 10 µL of inhibitors from the plate of 1 mM inhibitors to 90 µL of DMSO.
- To prepare a plate of inhibitors at 0.01 mM, add 10 µL of inhibitors from the plate of 0.1 mM inhibitors to 90 µL of DMSO.
- To prepare a plate of inhibitors at 1 mM, add 10 µL of inhibitors to 90 µL of dimethyl sulfoxide (DMSO) for all inhibitors.
- Treatment of thymocytes with kinase inhibitors
- Prepare a thymocyte suspension as per section 1.
- Dilute thymocytes in complete RPMI to obtain a thymocyte suspension of 5 x 10⁶ cells/mL.
- Add 200 µL of thymocyte suspension to all wells of a 96-well plate, using a multichannel pipette.
- To each well, add 2 µL of inhibitors from the corresponding well of the plate containing 1 mM inhibitors (the final concentration of the inhibitors is 10 µM).
- In the same plate, prepare four wells of untreated controls, four wells of 5 µM dexamethasone-treated positive controls, and four wells of vehicle-treated negative controls, by adding 2 µL of DMSO.
- Incubate the thymocytes in a 37 °C, 5% CO2 incubator for 17 - 20 h (or overnight).
- Determination of suitable concentrations of individual inhibitors
- Spin the plate of thymocytes at 300 x g and 4 °C, for 5 min. Resuspend the cells in 250 µL of FACS wash buffer.
- Run a flow cytometric analysis of the samples and analyze the results with a flow cytometry analysis program.
- Determine the percentage of live cells based on FSC-SSC gating. The gating strategy is shown in Figure 1B.
- Calculate an average of the percentage of live cells based on the DMSO-treated controls, which are normalized at 100%. Set an arbitrary window of acceptable cell death (e.g.,20%). Inhibitors that resulted in a percentage of live cells below this window (i.e., below 80% of the DMSO-treated controls) are to be tested again at lower concentrations.
- For the inhibitors that did not pass the viability criteria in step 2.3.4, repeat the steps from steps 2.2.1 - 2.3.4, but use the plate of inhibitors at 0.1 mM for step 2.2.4 instead of the plate containing the 1 mM inhibitors. The final concentration of inhibitors used here is 1 µM.
- For the inhibitors that still produce high levels of cell death at 1 µM, test the inhibitors at 0.1 µM. Repeat steps 2.2.1 - 2.3.4, but use the plate of inhibitors at 0.01 mM in step 2.2.4. The final concentration of inhibitors used here is 0.1 µM.
- Preparation of a stock plate of kinase inhibitors
- For inhibitors to be used at 10 µM, add 10 µL of 10 mM inhibitors to 10 µL of DMSO.
- For inhibitors to be used at 1 µM, add 1 µL of 10 mM inhibitors to 19 µL of DMSO.
- For inhibitors to be used at 0.1 µM, add 1 µL of 10 mM inhibitors to 199 µL of DMSO (Figure 1C).
NOTE: The prepared stock plate of inhibitors is 500x the concentration of the intended final concentration when added to the thymocyte suspensions. The stock plate of inhibitors can be prepared in PCR strips or in 96-well plates. - The stock plate of kinase inhibitors can be applied to thymocytes for screening in a conventional centrifugation-dependent system (section 3; see Figure 1A, methods 1 and 2) or in an alternative centrifugation-independent system (section 4; see Figure 1A, method 3).
3. Kinase Inhibitor Library Screening (Conventional Centrifuge-based Assay)
- Treatment of thymocytes with kinase inhibitors
- Prepare a thymocyte suspension as per section 1.
- Dilute thymocytes in complete RPMI to obtain a thymocyte suspension of 5 x 10⁶ cells/mL.
- Add 200 µL of thymocytes to each well of a 96-well plate, using a multichannel pipette. Place the plate on ice.
- Add 0.5 µL of inhibitors to the 96-well plate from the corresponding wells of the inhibitor stock plate prepared in section 2.4.
- Prepare eight wells of untreated controls. Prepare four wells of vehicle-treated controls by adding 0.5 µL of DMSO. Prepare four wells of 5 µM dexamethasone-treated controls (Figure 2).
- Stimulation of thymocytes using anti-CD3/CD28 beads
- Take 1 mL of beads and wash the beads with 2 mL of PBS. Separate the beads using a magnetic stand and aspirate the solution. Resuspend the beads in 5 mL of complete RPMI.
NOTE: The ratio of beads to cells is 1 to 2.5. Adjust the amount of beads to take, depending on the number of wells to stimulate and the number of thymocytes used. - Add 50 µL of beads to each inhibitor-treated sample, the four DMSO-treated samples, and four of the eight untreated samples. Add 50 µL of complete RPMI to the remaining four untreated wells. Figure 2 shows the general layout of the plate.
- Mix the contents of the wells using a multichannel pipette.
- Incubate the thymocytes in a 37 °C, 5% CO2 incubator for 17 - 20 h (or overnight).
- Take 1 mL of beads and wash the beads with 2 mL of PBS. Separate the beads using a magnetic stand and aspirate the solution. Resuspend the beads in 5 mL of complete RPMI.
- Staining of surface antigens
- Prepare an antibody staining mixture containing anti-TCRβ, anti-CD4, anti-CD8, and anti-CD69 antibodies. Dilute antibodies in FACS wash buffer (PBS supplemented with 0.5% bovine serum albumin [BSA]) at a ratio of 1:200 (v/v).
NOTE: Consider optimizing antibody titers used for the staining, instead of using fixed antibody dilutions, to minimize variation in staining across different experiments and to improve the signal-to-noise ratio. - Spin the plate at 300 x g and 4 °C, for 5 min.
- Flick the plate to discard the solution.
- At this point, the protocol can follow the conventional centrifuge-dependent protocol (proceed to step 3.3.5; see Figure 1A, method 1) or the alternative centrifugation-independent protocol (proceed to step 4.4.4; see Figure 1A, method 2).
- Resuspend the cells in 75 µL of the staining antibody mixture prepared in step 3.3.1.
- Mix the samples using a multichannel pipette and incubate them on ice for 30 min.
- Prepare an antibody staining mixture containing anti-TCRβ, anti-CD4, anti-CD8, and anti-CD69 antibodies. Dilute antibodies in FACS wash buffer (PBS supplemented with 0.5% bovine serum albumin [BSA]) at a ratio of 1:200 (v/v).
- Fixation of cells
- Wash the wells with 200 µL of FACS wash buffer and spin the plate at 300 x g and 4 °C, for 5 min.
- Flick the plate to discard the solution.
- Add fixation/permeabilization buffer (comes with the active caspase-3 apoptosis kit; same with the 10x perm/wash buffer mentioned in step 3.5.1 and the anti-caspase-3 antibody in step 3.5.2) at 200 µL per well.
- Incubate on ice for 30 min.
- Intracellular staining for active caspase 3
- Prepare 1x perm/wash buffer by diluting 5 mL of 10x perm/wash buffer in 45 mL of ultrapure water.
- Prepare intracellular active caspase stain by adding 1.3 mL of anti-caspase-3 antibody to 6.5 mL of 1x perm/wash buffer. The ratio of antibody to perm/wash buffer is 1:5.
- Spin the plate at 300 x g and 4 °C, for 5 min. Flick the plate to discard the solution. Wash the plate with 200 µL of 1x perm/wash buffer.
- Repeat step 3.5.3.
- Spin the plate at 300 x g and 4 °C, for 5 min. Flick the plate to discard the solution. Add 75 µL of intracellular caspase stain prepared in step 3.5.2 to all wells.
- Mix the samples using a multichannel pipette and incubate on ice for 1 h.
- Wash the samples with 200 µL of 1x perm/wash buffer and spin the plate at 300 x g and 4 °C, for 5 min.
- Flick the plate to discard the solution. Wash the plate with 200 µL of 1x perm/wash buffer. Spin the plate at 300 x g and 4 °C, for 5 min.
- Flick the plate to discard the solution and resuspend the samples in 200 µL of FACS wash buffer.
- Run a flow cytometric analysis of the samples and analyze the results with a FACS analysis program.
- Using a CD4 versus CD8 plot, gate on the population of DP thymocytes with a positive expression of both CD4 and CD8 (Figure 2, bottom half). Within the DP thymocyte gate, determine the percentage of cells with activated caspase-3, using the unstimulated sample as the negative control and dexamethasone as the positive control. For the analysis of the expression of CD69 in the DP thymocyte gate, use the unstimulated sample as the negative control and the stimulated sample as the positive control.
NOTE: When gating on the DP thymocytes, verify that the population of DP thymocytes is gated correctly for individual samples. Stimulated cells downregulate surface coreceptors, and an unintended exclusion of events can occur if a tight DP gate is used.
4. Kinase Inhibitor Library Screening (Centrifuge-independent Assay)
- Treatment of thymocytes with kinase inhibitors
- Prepare a thymocyte suspension as per section 1.
- Dilute the thymocytes in complete RPMI to obtain a thymocyte suspension of 25 x 106 cells/mL.
- Add 40 µL of thymocytes to each well of a small-volume plate, using a multichannel pipette. Place the plate on ice.
- Dilute the inhibitors from the stock plate, DMSO, and dexamethasone in complete RPMI at a ratio of four parts of complete RPMI to one part of inhibitor/DMSO/dexamethasone (dilution factor of 5).
NOTE: As the volumes used in this small-volume plate are 5x smaller than in the conventional method, the inhibitors and the control reagents are diluted fivefold before adding them to the thymocytes in the plate. - Add 0.5 µL of inhibitors to the 96-well plate from the corresponding wells of the inhibitor plate prepared in step 4.1.4.
- Prepare eight wells of untreated controls. Prepare four wells of vehicle-treated controls by adding 0.5 µL of the DMSO prepared in step 4.1.4. Prepare four wells of 5 µM dexamethasone-treated controls, using the diluted dexamethasone prepared in step 4.1.4 (Figure 2).
- Stimulation of thymocytes using anti-CD3/CD28 beads
- Make sure that the beads are uniformly resuspended. Take 1 mL of beads and wash them with 2 mL of PBS. Separate the beads using a magnetic stand and aspirate the solution. Resuspend the beads in 1 mL of complete RPMI.
NOTE: The ratio of beads to cells is 1 to 2.5. Adjust the amount of beads, depending on the number of wells to stimulate and the number of thymocytes used. - Add 10 µL of bead suspension to each inhibitor-treated sample, the four DMSO-treated samples, and four of the eight untreated samples. Add 10 µL of complete RPMI to the remaining four untreated wells. Figure 2 shows the general plate layout.
NOTE: The final volume of the wells is 50 µL, which is within the maximum capacity of the wells. It is important to exercise caution and to hold the plates upright, to avoid cross-well spillage. - To mix, agitate the plate using a microplate orbital shaker. Alternatively, mix the contents of the wells using a multichannel pipette.
- Incubate the thymocytes in a 37 °C, 5% CO2 incubator for 17 - 20 h (or overnight) with an anti-evaporation lid.
- Make sure that the beads are uniformly resuspended. Take 1 mL of beads and wash them with 2 mL of PBS. Separate the beads using a magnetic stand and aspirate the solution. Resuspend the beads in 1 mL of complete RPMI.
- Setup of the plate washer
NOTE: The instructions for setting up the plate washer are provided by the manufacturer. The steps are mentioned in brief below. Roughly 150 mL of solution is needed for each priming step.- Prime the wash system with 70% ethanol containing 1% Tween 20.
- Prime the wash system with deionized water containing 1% Tween 20.
- Prime the wash system with FACS wash buffer.
- Staining of surface antigens
- Prepare an antibody staining mixture containing anti-TCRβ, anti-CD4, anti-CD8, and anti-CD69 antibodies. Dilute the antibodies in FACS wash buffer at a ratio of 1:100 (v/v).
- Wash the plate 9x, using 55 µL of FACS wash buffer per wash, using the automated laminar flow washing system.
NOTE: At the end of the washes, there will be 25 µL of residual volume in each well. - Resuspend the cells in 25 µL of the staining antibody mixture prepared in step 4.4.1.
- If the samples are transferred from a 96-well plate (from step 3.3.4), resuspend the cells in 50 µL of the antibody mixture prepared in step 3.3.1, and transfer the samples to the small-volume plate. This step corresponds to method number 2, as depicted in Figure 1A.
- To mix, agitate the plate with a microplate orbital shaker or mix the samples using a multichannel pipette, and incubate on ice for 30 min.
- Fixation of cells
- Wash the plate 9x, using 55 µL of FACS wash buffer per wash, using the automated laminar flow washing system.
- Add fixation/permeabilization buffer (comes with the active caspase-3 apoptosis kit; same with the 10x perm/wash buffer mentioned in step 4.6.1 and the anti-caspase-3 antibody in step 4.6.2) at 50 µL per well.
- Incubate on ice for 30 min.
- Intracellular staining for active caspase 3
- Prepare 1x perm/wash buffer by diluting 25 mL of 10x perm/wash buffer in 225 mL of ultrapure water.
- Prepare intracellular active caspase stain by adding 1 mL of anti-caspase-3 antibody to 2 mL of 1x perm/wash buffer. The ratio of antibody to perm/wash buffer is 1:2.
- Prime the wash system with 1x perm/wash buffer.
- Wash the plate 9x with 1x perm/wash buffer, at 55 µL for each wash.
- Add 25 µL of the intracellular caspase stain prepared in step 4.6.2 to all wells.
- To mix, agitate the plate with a microplate orbital shaker or mix the samples using a multichannel pipette, and incubate on ice for 1 h.
- Wash the plate 9x with 1x perm/wash buffer, at 55 µL for each wash.
- Add 25 µL of FACS wash buffer to all wells.
- Transfer the samples to microtiter tubes after adequate mixing via pipetting.
- Add another 50 µL of FACS wash buffer to the empty wells and repeat step 4.6.9.
- Repeat steps 4.6.9 and 4.6.10 2x until 200 µL of the samples are collected in the microtiter tubes.
NOTE: The purpose of the procedures described in steps 4.6.10 and 4.6.11 is to ensure a maximum recovery of the cells from the small-volume plate. If cell numbers are not a concern, after step 4.6.10, simply top up the microtiter tubes to 200 µL with FACS wash buffer. - Run a flow cytometric analysis of the samples and analyze the results with a FACS analysis program, as per step 3.5.11. Caspase-3 activation and CD69 expression are analyzed in the gate containing CD4+CD8+DP thymocytes.
Results
The approach to the screening assay is summarized in Figure 1A. The kinase inhibitors were first screened for their latent effects on thymocyte viability. As a positive control for apoptosis, dexamethasone was used as a proapoptotic agent. The gating for the live cell population was determined based on the untreated negative controls and the dexamethasone-treated positive controls (Figure 1B). The inhibitors were first tested at 10 µM on thymocytes, and the percentage of viable cells was measured after incubating for 18 h. A 20% window for cell death was chosen such that the compounds that induced a larger than 20% loss of cells in the live cell gate, compared to the DMSO-treated samples, were tested at lower concentrations (Figure 1B). Representative FACS plots of selected inhibitor-treated samples are shown to illustrate the viability assay. LY294002 (2-(4-morpholinyl)-8-phenyl-4H-1-benzopyran-4-one; CAS 154447-36-6), a PI3K inhibitor22, did not greatly increase cell death at 10 µM, and the inhibitor was used at 10 µM for the subsequent assays. CAY10626 (N-[2-(dimethylamino)ethyl]-N-methyl-4-[[[[4-[4-(4-morpholinyl)-7-(2,2,2-trifluoroethyl)-7H-pyrrolo[2,3-d]pyrimidin-2-yl]phenyl]amino]carbonyl]amino]-benzamide; CAS 1202884-94-3), a dual inhibitor of PI3Kα/mTOR23, induced high levels of cell death at 10 µM and at 1 µM but not at 0.1 µM, and 0.1 µM was determined to be the suitable concentration for application in downstream assays. Staurosporine (2,3,10,11,12,13-hexahydro-10R-methoxy-9S-methyl-11R-methylamino-9S,13R-epoxy-1H,9H-diindolo[1,2,3-gh;3',2',1'-lm]pyrrolo[3,4-j][1,7]benzodiazonin-1-one; CAS 62996-74-1), a pan-protein kinase C inhibitor with an established ability to induce apoptosis24, induced significant cell death at all concentrations tested, even at 0.1 µM. It was used in subsequent assays at 0.1 µM as an additional positive control.
The final concentrations of the inhibitors were selected based on the highest concentrations wherein they did not amplify cell death by more than 20% of the DMSO-treated samples. With the final concentrations of the inhibitors determined, a stock plate of inhibitors was prepared such that all the inhibitors were 500 times the concentration when applied to the cells. Figure 1C illustrates the plate layout of the stock plate, with the final concentrations of the inhibitors. In the alternative protocol of incubating the cells directly in the small-volume plates for the laminar flow washing assay, the usage of small volumes necessitated a further dilution of the inhibitors. To ensure that the DMSO content of the cultures after inhibitor addition would not be too high for the cells, the inhibitors were further diluted in complete RPMI, by a dilution factor of 5, such that they were at 100 times the intended concentration when applied to the cells.
The inhibitors, diluted to nontoxic concentrations, were used in the assay for TCR-stimulation-induced apoptosis in thymocytes5,17. The stimulation was carried out using anti-CD3/CD28 beads for 18 h, and the cells were subsequently stained for caspase-3 activation in the CD4+ and CD8+ DP thymocyte population (Figure 2). An increase in caspase-3 activation and CD69 expression, and also a TCR downregulation, were observed in both the anti-CD3/CD28-stimulated and the DMSO-mock-treated anti-CD3/28-stimulated samples, compared to the nonstimulated samples. The dexamethasone-treated samples showed an increase in caspase-3 activation independent of CD69 upregulation, which is expected of the apoptosis-inducing effect being independent of TCR stimulation.
Figure 3A summarizes the results of the library screening assay for selected inhibitors. Both caspase-3 activation and CD69 can be used to identify potential inhibitors of interest due to the suppression of expression. As expected, inhibitors of canonical mediators of TCR signaling showed up as positive hits in the screens. Such inhibitors, which exhibited varying degrees of inhibitory potency, included broad-spectrum inhibitors that target multiple kinases and, also, more specific inhibitors. Some inhibitors were able to suppress both caspase-3 activation and CD69 upregulation (Figure 3B, top row, left panels). One such inhibitor is bisindolylmaleimide II (3-(1H-Indol-3-yl)-4-[1-[2-(1-methyl-2-pyrrolidinyl)ethyl]-1H-indol-3-yl]-1H-pyrrole-2,5-dione; CAS 137592-45-1), which inhibits all protein kinase C isoforms, in addition to protein kinase A and PDK125,26,27. Another inhibitor in this category is CAY10657 (3-[(aminocarbonyl)amino]-5-[4-(4-morpholinylmethyl)phenyl]-2-thiophenecarboxamide; CAS 494772-86-0), a proposed inhibitor of IKK228.
There were compounds that inhibited CD69 upregulation but did not impair caspase-3 activation (Figure 3B, top row, right panels). CAY10626, an inhibitor of PI3Kα and mTOR23, and U-0126 (2,3-bis[amino[(2-aminophenyl)thio]methylene]-butanedinitrile; CAS 109511-58-2), an MEK inhibitor29, were some of the identified inhibitors. The results show that different inhibitors targeting different kinases from specific branches of the TCR signaling pathway, especially those targeting late-stage kinases, can result in the selective impairment of T-cell activation phenomena.
There were also inhibitors that did not suppress both CD69 upregulation and caspase-3 activation (Figure 3B, bottom row, left panels). Paclitaxel (βS-(benzoylamino)-αR-hydroxy-benzenepropanoic acid, (2aR,4S,4aS,6R,9S,11S,12S,12aR,12bS)-6,12b-bis(acetyloxy)-12-(benzoyloxy)-2a,3,4,4a,5,6,9,10,11,12,12a,12b-dodecahydro-4,11-dihydroxy-4a,8,13,13-tetramethyl-5-oxo-7,11-methano-1H-cyclodeca[3,4]benz[1,2-b]oxet-9-yl ester; CAS 33069-62-4), a disruptor of microtubule dynamics30, and necrostatin-5 (2-[[3,4,5,6,7,8-hexahydro-3-(4-methoxyphenyl)-4-oxo[1]benzothieno[2,3-d]pyrimidin-2-yl]thio]-acetonitrile; CAS 337349-54-9), an inhibitor of RIP1 kinase31, are two inhibitors identified to be in this category. In such cases where CD69 upregulation and caspase-3 activation were not impaired, this can be due to the inhibitors not targeting a relevant kinase of the TCR signaling pathway.
As mentioned earlier, staurosporine was used in the screens, at a concentration that still induced apoptosis in the thymocytes. As expected, the staurosporine-treated sample showed high levels of caspase-3 activation (Figure 3B, bottom row, right column). The low levels of CD69 expression can be attributed to the staurosporine-mediated inhibition of PKC, as bisindolylmaleimide II, another pan-PKC inhibitor, also suppressed the expression of CD69. Alternatively, staurosporine induced apoptosis in the cells before they were able to upregulate the CD69 expression.
To increase the throughput and automation of the protocol, parallel protocols that involved the use of an automated plate washing system via laminar flow were prepared. Two separate protocols using this automated plate washing device were trialed and compared to the conventional method of culturing cells in 96-well plates and staining the cells in a centrifugation-dependent protocol. One method involved culturing the cells in 96-well plates, as per standard procedure, and then, transferring the cells to plates compatible with the automated plate washer for the staining steps (Figure 4, DA-Washing samples). The other method involved culturing the cells directly in the plate-washer-compatible plates and continuing with the staining protocol on the same plate (Figure 4, DA-Culture samples). The centrifugation-independent protocols do not give many perceivable differences in active caspase-3, CD69, or TCRβ staining across the different samples tested, as compared to the conventional centrifugation-dependent protocol (Figure 4). Differences in the staining intensity can be attributed to using antibodies at slightly different concentrations during the staining steps.
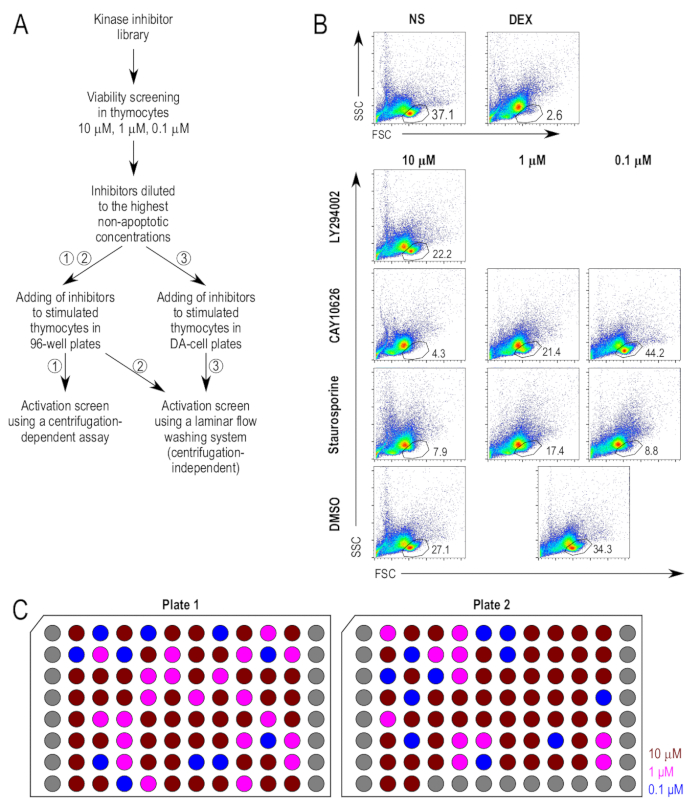
Figure 1: Thymocyte viability after treatment with inhibitors. (A) Experimental outline of the major steps in the screening assay. There are three proposed methods for the stimulation and staining of the thymocytes used in the activation assay, namely (1) the culturing of thymocytes in standard 96-well plates, followed by staining using a conventional centrifugation-based protocol, (2) the culturing of thymocytes in standard 96-well plates, followed by staining using a centrifugation-independent washing protocol, and (3) the culturing of thymocytes in small-volume plates, followed by staining in the same plates using a centrifugation-independent washing protocol. (B) Gating strategies used in the viability assays. The live cell gate was derived from the forward scatter (FSC) and side scatter (SSC) plots, as previously described17. Inhibitors that were deemed to be too toxic at the tested concentration were subject to further viability assays at 10-fold lower concentrations. Representative inhibitor-treated samples are shown. Note the common control (DMSO-treated [DMSO]) used for the 1 µM and 0.1 µM samples. (C) Plate layout of diluted inhibitors. A schematic representation of the plates of inhibitors diluted in DMSO to a concentration of 500x the intended final concentration. Each well represents one unique inhibitor; the grey wells are empty. The concentrations shown are the final concentration when added to the cell cultures, namely 10 µM (dark red), 1 µM (fuchsia), and 0.1 µM (blue). Please click here to view a larger version of this figure.
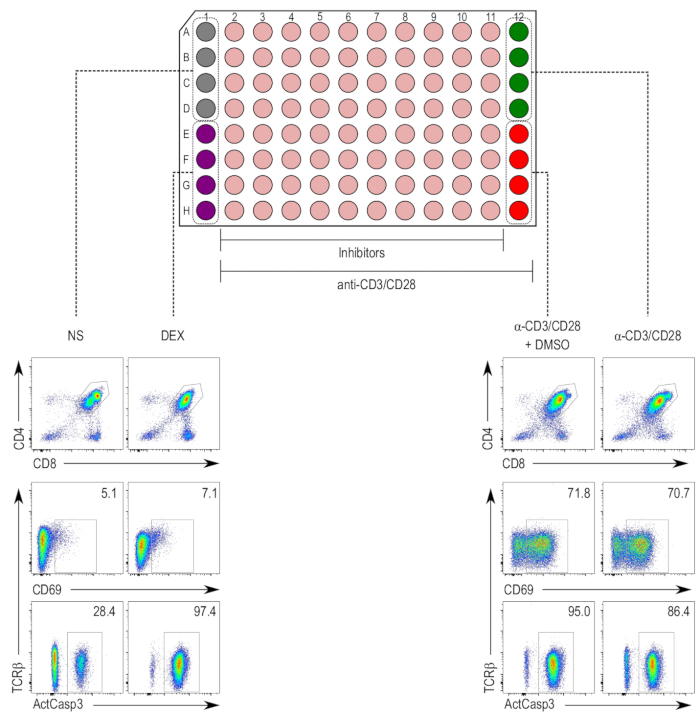
Figure 2: Plate layout of the thymocyte activation assay. (Top) Columns 1 and 12 are reserved for controls, while the columns 2 to 11 are inhibitor-treated samples (beige). The negative control (nonstimulated [NS]; grey) occupies wells A1 to D1, and the positive control for cell death (dexamethasone-treated [DEX]; purple) occupies wells E1 to H1. Columns 2 to 12 contain thymocytes stimulated with anti-CD3/CD28 beads. The positive control for thymocyte activation (stimulated samples [α-CD3/CD28]; green) occupies wells A12 to D12, and the vehicle control (stimulated and DMSO-treated [α-CD3/CD28 + DMSO]; red) occupies wells E12 to H12. (Bottom) Flow cytometry plots of active caspase-3 (ActCasp3), CD69, and TCRβ staining of thymocytes gated within the double-positive (DP) gate. Representative plots of the different controls are shown. NS = nonstimulated; DEX = dexamethasone-treated samples; α-CD3/CD28 + DMSO = samples stimulated with CD3/CD28-coated beads and treated with DMSO; α-CD3/CD28 = samples stimulated with CD3/CD28-coated beads. Please click here to view a larger version of this figure.
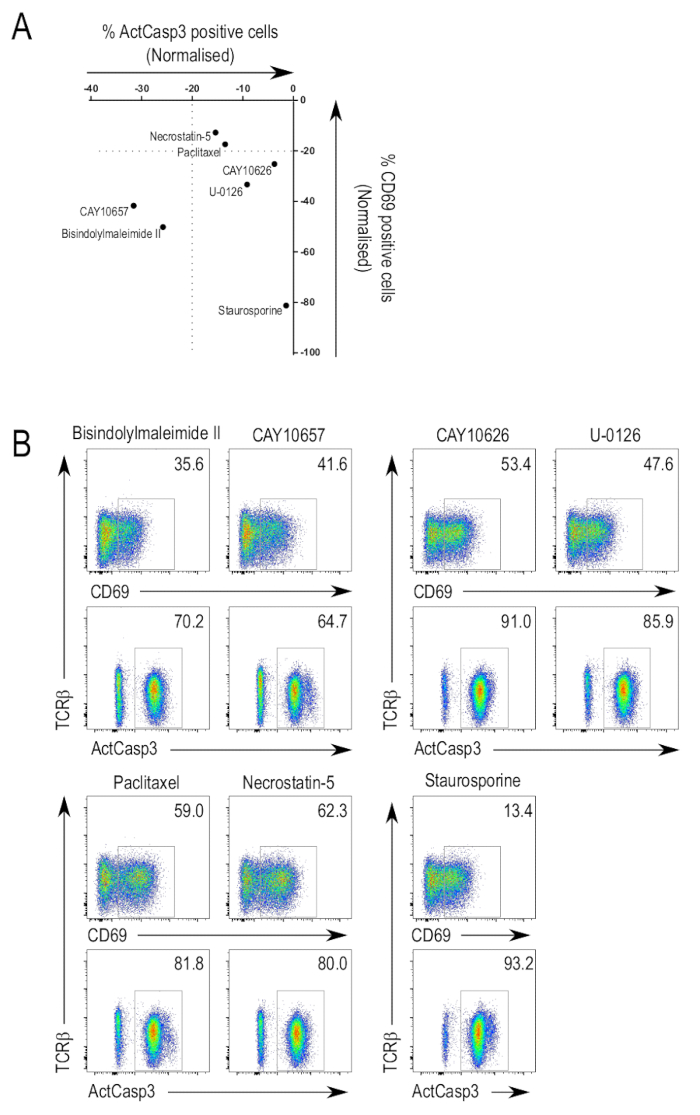
Figure 3: Screening of the inhibitor library on thymocyte activation. (A) Summarized data of the activation assay. These are the results of a representative experiment showing the normalized values of cells with activated caspase-3 and CD69 expression for selected inhibitors. Normalization was done by comparing the percentage of cells in the active-caspase-3-positive or CD69-positive gate to the value of the DMSO-treated control, which is set to a relative value of 0 in the graph. (B) Selected FACS plots. Flow cytometry plots of inhibitors that suppressed both caspase-3 activation and CD69 upregulation (top left), suppressed only CD69 upregulation (top right), or had no effect on caspase-3 activation and CD69 upregulation (bottom left). Plots of the staurosporine-treated sample are shown to illustrate the effects of using an inhibitor at toxic concentrations (bottom right). Please click here to view a larger version of this figure.
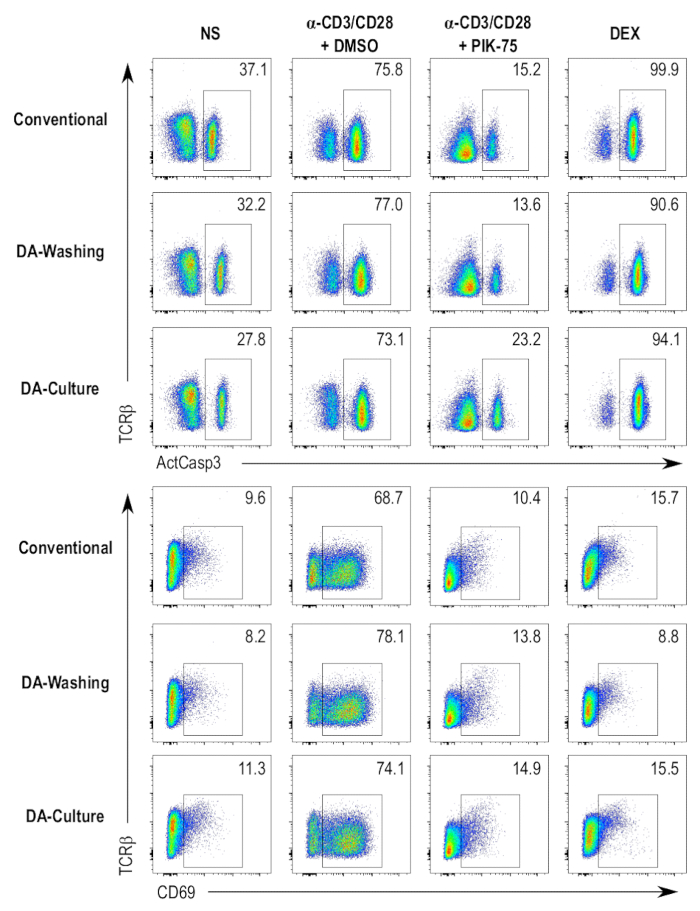
Figure 4: Comparison of the different assay protocols. Flow cytometry plots of active caspase-3 (ActCasp3), CD69, and TCRβ staining of DP thymocytes following the three different assay protocols. Four different conditions are tested, namely the negative control (nonstimulated [NS]), the positive control for cell death (dexamethasone-treated [DEX]), the vehicle control (stimulated and DMSO-treated [α-CD3/CD28 + DMSO]), and an inhibitor-treated sample (stimulated and PIK-75-treated [α-CD3/CD28 + PIK-75]). Conventional = the culturing of thymocytes in standard 96-well plates and staining with a conventional centrifugation-based protocol; DA-Washing = the culturing of thymocytes in standard 96-well plates and staining using a laminar flow washing protocol; DA-Culture = the culturing of thymocytes in small-volume plates and staining in the same plates using a laminar flow washing protocol. Please click here to view a larger version of this figure.
Discussion
The screening strategy proposed here evaluates the ability of small-molecule inhibitors to suppress the apoptotic effects in thymocytes after stimulation, in addition to more conventional markers of T-cell activation-CD69 upregulation and TCR downregulation. Additional markers can also be included to enable the analysis of different thymocyte subsets32. An interesting aspect of the current assay lies in the fact that inhibitors that impede TCR signaling would also dampen the induction of apoptosis, further highlighting the distinction of TCR-independent effects the inhibitors may have on inducing cell death. Furthermore, a flow-cytometry-based assay allows the use of multiple readouts as distinct activation markers, which could report the effects of the inhibitors on separate individual branches of TCR signaling. In the case presented here, there were inhibitors that showed a differential inhibition of caspase-3 activation and CD69 upregulation. Because some compounds may affect housekeeping functions such as protein synthesis or vesicular trafficking, it is not surprising to observe effects on the upregulation of de novo synthesized markers (e.g., CD69) but not on posttranslational modifications (e.g., the proteolytic activation of caspase-3).
As the assay presented here measures apoptosis as a readout, it is imperative that the latent toxic effects of the inhibitors do not obscure the results. For example, in the screen, we did not dilute staurosporine beyond 1 nM, despite it still being toxic to the cells at that concentration. The representative results are in agreement with staurosporine being a promiscuous kinase inhibitor and an inducer of apoptosis33. Without a sufficient dilution of the compounds tested to nontoxic concentrations, it is possible to overlook potential hits.
The screening strategy detailed here would be difficult to apply to humans due to the complications associated with obtaining sufficient numbers of thymocytes for high-throughput screening. However, it is possible to obtain human thymus samples from pediatric cardiac biopsies34,35 or from fetuses36,37. Nonetheless, as TCR signaling pathways and the amino acid sequences of signaling proteins are largely conserved between mice and humans, the thymocyte assay provides a useful preliminary screening strategy, and any results obtained with this assay using mouse thymocytes can, then, be verified in primary human lymphocytes.
One limitation of the conventional centrifugation-dependent protocol pertains to the prospect of cell loss, which can be attributed to the multistep nature of the process, which involves steps such as cell permeabilization and centrifugation. Each centrifugation and resuspension step inevitably results in the loss of cells. While such losses may not be critical for studies involving a limited number of samples, it could pose problems when applied in higher-throughput screening, in particular as the assay format progresses from 96- to 384- to 1536-well. One way to circumvent this problem is through the use of cell-permeable fluorescent caspase sensors38 that enable the detection of caspase activation while avoiding the complications of cell permeabilization and multiple washes5. Alternatively, employing a centrifugation-independent method of washing cells by laminar flow is also possible for minimizing cell loss. With an automated plate washing station in conjunction with a wall-less plate, cells are washed by laminar flow without the use of a centrifuge. The exponential dilution of reagents allows for the thorough and efficient rinsing of cells in less than 3 min, which represents an equivalent dilution to two rounds of centrifugal washing. Without external stresses due to centrifugation, the cells are more viable and cell losses are minimized.
We also explored the possibility of using the automated plate washing station after culturing the thymocytes in 96-well U-bottom plates and, also, the culturing of cells directly in wall-less plates compatible with the automated plate washing station. The culturing of cells in the wall-less plates enabled the elimination of all centrifugation steps and minimized cell loss by eliminating the need for a sample transfer across plates. Generally, the three different protocols are comparable in both stimulation efficiency and staining. The automated washing station provides the benefit of automation, speed, and efficiency, which makes it easier for higher-throughput analysis. Furthermore, with increased automation, the washing steps can be carried out faster, and there is a greater consistency between the experiments or experimenters. However, the washing station has certain drawbacks: large volumes of washing buffers are required for washer priming (150 mL per buffer change, of which 50 mL is used for washing); extra care is needed when handling the plate to avoid any cross-contamination of the wells due to limited partitioning between the wells of the small-volume plate; residual buffer of 25 µL in the wells after washing necessitates the use of reagents prepared at a higher than 1x concentration. To address the issues of residual volume and limited volume capacity of the plate, an accessory to expand the incubation volume from 70 µL to 150 µL can be added, facilitating the adoption of conventional protocols. While automated plate handling systems are currently available, they have a significant footprint compared to the laminar wash system, which is a small unit of ~1 cubic foot (~0.028 m3). Moreover, the integration of centrifugation in automated plate handling systems is challenging, limiting their use in cell washing. There are currently no other centrifuge-independent cell washing instruments available, as far as we know.
The screening strategy presented here is able to identify small molecules, and their purported target kinases, that affect TCR signaling and T-cell activation. The library used here comprises mainly small-molecule inhibitors of kinases and was able to generate a number of potentially interesting hits. The protocol can also be readily applied to inhibitor libraries of other enzyme classes or to other types of small molecules, as well as to libraries of other compounds (e.g., various macromolecules). The protocol can also be used to screen other cell types, such as peripheral T lymphocytes or immortalized cells, including those expressing transgenic TCRs or carrying reporter systems. Identifying and characterizing new mediators of T-cell signaling can improve our knowledge of the signaling pathway and also aid in the development of targeted therapy in immune diseases13,14,15,16. In all, this study adds to the range of available options for the detection of mediators of T-cell signaling via high-throughput screening assays.
Disclosures
The author Chyan Ying Ke is an employee of Curiox Biosystems, which produces the DA-cell washer and DA-cell plates used in this article.
Acknowledgements
This work was supported by grants from the Singapore Ministry of Health's National Medical Research Council, NMRC CBRG15may017, and the Singapore Ministry of Education, 2014-T2-1-136 (to N.R.J.G.).
Materials
| Name | Company | Catalog Number | Comments |
|---|---|---|---|
| RPMI | HyClone | SH30027FS | |
| FBS | HyClone | SH3007103 | |
| L-Glutamine | HyClone | SH3003401 | |
| Sodium pyruvate | HyClone | SH3023901 | |
| Penicillin/Streptomycin | HyClone | SV30010 | |
| b-mercaptoethanol | Sigma Aldrich | 516732 | |
| 10X PBS | Vivantis | PB0344 – 1L | |
| Kinase Screening Library (96-Well) | Cayman Chemical | 10505 | Exact contents of the library may vary |
| DMSO | Sigma Aldrich | D2650 | |
| Dexamethasone | Sigma Aldrich | D4902 | |
| anti-CD3/CD28 beads | Thermo Fisher Scientific | 11452D | |
| FITC Active Caspase-3 Apoptosis Kit | BD Pharmingen | 550480 | Contains Fixation/Permeabilisation buffer, 10X Perm/Wash buffer and anti-caspase 3 antibody |
| DA-Cell Washer | CURIOX | HT1000 | |
| 96-well DA-Cell Plate | CURIOX | 96-DC-CL-05 | |
| Antibodies | |||
| CD3e | BioLegend | 100236 | |
| TCRb | BD Biosciences | 553174 | |
| CD4 | BD Biosciences | 740007 | |
| CD8 | BD Biosciences | 563786 | |
| CD69 | eBioscience | 25-0699-42 | |
| Inhibitors | |||
| TG003 | Cayman Chemical | - | From the Kinase Screening Library |
| PKC 412 | Cayman Chemical | - | From the Kinase Screening Library |
| Doramapimod | Cayman Chemical | - | From the Kinase Screening Library |
| Paclitaxel | Cayman Chemical | - | From the Kinase Screening Library |
| Erlotinib | Cayman Chemical | - | From the Kinase Screening Library |
| Necrostatin-5 | Cayman Chemical | - | From the Kinase Screening Library |
| NVP-BEZ235 | Cayman Chemical | - | From the Kinase Screening Library |
| Phthalazinone pyrazole | Cayman Chemical | - | From the Kinase Screening Library |
| AG-879 | Cayman Chemical | - | From the Kinase Screening Library |
| 1-NA-PP1 | Cayman Chemical | - | From the Kinase Screening Library |
| Torin 1 | Cayman Chemical | - | From the Kinase Screening Library |
| Bisindolylmaleimide II | Cayman Chemical | - | From the Kinase Screening Library |
| BIBF 1120 | Cayman Chemical | - | From the Kinase Screening Library |
| SMI-4a | Cayman Chemical | - | From the Kinase Screening Library |
| Bisindolylmaleimide XI (hydrochloride) | Cayman Chemical | - | From the Kinase Screening Library |
| CAY10657 | Cayman Chemical | - | From the Kinase Screening Library |
| AS-703026 | Cayman Chemical | - | From the Kinase Screening Library |
| Chelerythrine chloride | Cayman Chemical | - | From the Kinase Screening Library |
| Tunicamycin | Cayman Chemical | - | From the Kinase Screening Library |
| GSK 1059615 | Cayman Chemical | - | From the Kinase Screening Library |
| Ruxolitinib | Cayman Chemical | - | From the Kinase Screening Library |
| Necrostatin-1 | Cayman Chemical | - | From the Kinase Screening Library |
| SB 505124 | Cayman Chemical | - | From the Kinase Screening Library |
| INK128 | Cayman Chemical | - | From the Kinase Screening Library |
| Canertinib (hydrochloride) | Cayman Chemical | - | From the Kinase Screening Library |
| SB 431542 | Cayman Chemical | - | From the Kinase Screening Library |
| PD 173074 | Cayman Chemical | - | From the Kinase Screening Library |
| Valproic Acid (sodium salt) | Cayman Chemical | - | From the Kinase Screening Library |
| PD 0325901 | Cayman Chemical | - | From the Kinase Screening Library |
| SB 203580 | Cayman Chemical | - | From the Kinase Screening Library |
| VX-702 | Cayman Chemical | - | From the Kinase Screening Library |
| Emodin | Cayman Chemical | - | From the Kinase Screening Library |
| CHIR99021 | Cayman Chemical | - | From the Kinase Screening Library |
| BIO | Cayman Chemical | - | From the Kinase Screening Library |
| Imatinib (mesylate) | Cayman Chemical | - | From the Kinase Screening Library |
| Sunitinib Malate | Cayman Chemical | - | From the Kinase Screening Library |
| Gefitinib | Cayman Chemical | - | From the Kinase Screening Library |
| PP2 | Cayman Chemical | - | From the Kinase Screening Library |
| 3-Methyladenine | Cayman Chemical | - | From the Kinase Screening Library |
| Bisindolylmaleimide I | Cayman Chemical | - | From the Kinase Screening Library |
| Bisindolylmaleimide IV | Cayman Chemical | - | From the Kinase Screening Library |
| Bisindolylmaleimide V | Cayman Chemical | - | From the Kinase Screening Library |
| NSC 663284 | Cayman Chemical | - | From the Kinase Screening Library |
| D 4476 | Cayman Chemical | - | From the Kinase Screening Library |
| NU 7026 | Cayman Chemical | - | From the Kinase Screening Library |
| H-9 (hydrochloride) | Cayman Chemical | - | From the Kinase Screening Library |
| Indirubin-3'-monoxime | Cayman Chemical | - | From the Kinase Screening Library |
| KN-62 | Cayman Chemical | - | From the Kinase Screening Library |
| KN-93 | Cayman Chemical | - | From the Kinase Screening Library |
| CGP 57380 | Cayman Chemical | - | From the Kinase Screening Library |
| Iso-Olomoucine | Cayman Chemical | - | From the Kinase Screening Library |
| (S)-Glycyl-H-1152 (hydrochloride) | Cayman Chemical | - | From the Kinase Screening Library |
| Bisindolylmaleimide VIII (acetate) | Cayman Chemical | - | From the Kinase Screening Library |
| ST638 | Cayman Chemical | - | From the Kinase Screening Library |
| SU 6656 | Cayman Chemical | - | From the Kinase Screening Library |
| LY364947 | Cayman Chemical | - | From the Kinase Screening Library |
| SB 203580 (hydrochloride) | Cayman Chemical | - | From the Kinase Screening Library |
| CAY10621 | Cayman Chemical | - | From the Kinase Screening Library |
| YM-201636 | Cayman Chemical | - | From the Kinase Screening Library |
| ZM 447439 | Cayman Chemical | - | From the Kinase Screening Library |
| AS-041164 | Cayman Chemical | - | From the Kinase Screening Library |
| NVP-AEW541 (hydrochloride) | Cayman Chemical | - | From the Kinase Screening Library |
| PP242 | Cayman Chemical | - | From the Kinase Screening Library |
| ABT-869 | Cayman Chemical | - | From the Kinase Screening Library |
| CAY10622 | Cayman Chemical | - | From the Kinase Screening Library |
| 17β-hydroxy Wortmannin | Cayman Chemical | - | From the Kinase Screening Library |
| CAY10626 | Cayman Chemical | - | From the Kinase Screening Library |
| SU 6668 | Cayman Chemical | - | From the Kinase Screening Library |
| CAY10572 | Cayman Chemical | - | From the Kinase Screening Library |
| N,N-Dimethylsphingosine | Cayman Chemical | - | From the Kinase Screening Library |
| LY294002 | Cayman Chemical | - | From the Kinase Screening Library |
| U-0126 | Cayman Chemical | - | From the Kinase Screening Library |
| Staurosporine | Cayman Chemical | - | From the Kinase Screening Library |
| KN-92 (hydrochloride) | Cayman Chemical | - | From the Kinase Screening Library |
| AS-605240 (potassium salt) | Cayman Chemical | - | From the Kinase Screening Library |
| O-1918 | Cayman Chemical | - | From the Kinase Screening Library |
| Y-27632 (hydrochloride) | Cayman Chemical | - | From the Kinase Screening Library |
| Leelamine | Cayman Chemical | - | From the Kinase Screening Library |
| PD 98059 | Cayman Chemical | - | From the Kinase Screening Library |
| PD 169316 | Cayman Chemical | - | From the Kinase Screening Library |
| TGX-221 | Cayman Chemical | - | From the Kinase Screening Library |
| (S)-H-1152 (hydrochloride) | Cayman Chemical | - | From the Kinase Screening Library |
| AS-605240 | Cayman Chemical | - | From the Kinase Screening Library |
| D-erythro-Sphingosine C-18 | Cayman Chemical | - | From the Kinase Screening Library |
| OSU03012 | Cayman Chemical | - | From the Kinase Screening Library |
| JNJ-10198409 | Cayman Chemical | - | From the Kinase Screening Library |
| Leelamine (hydrochloride) | Cayman Chemical | - | From the Kinase Screening Library |
| Arachidonic Acid Leelamide | Cayman Chemical | - | From the Kinase Screening Library |
| Lauric Acid Leelamide | Cayman Chemical | - | From the Kinase Screening Library |
| AS-252424 | Cayman Chemical | - | From the Kinase Screening Library |
| CAY10505 | Cayman Chemical | - | From the Kinase Screening Library |
| PI-103 | Cayman Chemical | - | From the Kinase Screening Library |
| PIK-75 (hydrochloride) | Cayman Chemical | - | From the Kinase Screening Library |
| Sphingosine Kinase Inhibitor 2 | Cayman Chemical | - | From the Kinase Screening Library |
| Piceatannol | Cayman Chemical | - | From the Kinase Screening Library |
| SC-1 | Cayman Chemical | - | From the Kinase Screening Library |
| (R)-Roscovitine | Cayman Chemical | - | From the Kinase Screening Library |
| BAY-43-9006 | Cayman Chemical | - | From the Kinase Screening Library |
| CAY10561 | Cayman Chemical | - | From the Kinase Screening Library |
| AS-604850 | Cayman Chemical | - | From the Kinase Screening Library |
| PI3-Kinase α Inhibitor 2 | Cayman Chemical | - | From the Kinase Screening Library |
| ML-9 | Cayman Chemical | - | From the Kinase Screening Library |
| Triciribine | Cayman Chemical | - | From the Kinase Screening Library |
| Erbstatin Analog | Cayman Chemical | - | From the Kinase Screening Library |
| Kenpaullone | Cayman Chemical | - | From the Kinase Screening Library |
| Olomoucine | Cayman Chemical | - | From the Kinase Screening Library |
| AG-494 | Cayman Chemical | - | From the Kinase Screening Library |
| AG-825 | Cayman Chemical | - | From the Kinase Screening Library |
| AG-1478 | Cayman Chemical | - | From the Kinase Screening Library |
| SB 216763 | Cayman Chemical | - | From the Kinase Screening Library |
| SB 415286 | Cayman Chemical | - | From the Kinase Screening Library |
| AG-17 | Cayman Chemical | - | From the Kinase Screening Library |
| H-8 (hydrochloride) | Cayman Chemical | - | From the Kinase Screening Library |
| LFM-A13 | Cayman Chemical | - | From the Kinase Screening Library |
| SC-514 | Cayman Chemical | - | From the Kinase Screening Library |
| Apigenin | Cayman Chemical | - | From the Kinase Screening Library |
| AG-18 | Cayman Chemical | - | From the Kinase Screening Library |
| CAY10554 | Cayman Chemical | - | From the Kinase Screening Library |
| DRB | Cayman Chemical | - | From the Kinase Screening Library |
| RG-13022 | Cayman Chemical | - | From the Kinase Screening Library |
| RG-14620 | Cayman Chemical | - | From the Kinase Screening Library |
| AG-490 | Cayman Chemical | - | From the Kinase Screening Library |
| AG-82 | Cayman Chemical | - | From the Kinase Screening Library |
| AG-99 | Cayman Chemical | - | From the Kinase Screening Library |
| AG-213 | Cayman Chemical | - | From the Kinase Screening Library |
| AG-183 | Cayman Chemical | - | From the Kinase Screening Library |
| Lavendustin C | Cayman Chemical | - | From the Kinase Screening Library |
| ZM 336372 | Cayman Chemical | - | From the Kinase Screening Library |
| 5-Iodotubercidin | Cayman Chemical | - | From the Kinase Screening Library |
| SB 202190 | Cayman Chemical | - | From the Kinase Screening Library |
| CAY10571 | Cayman Chemical | - | From the Kinase Screening Library |
| Nilotinib | Cayman Chemical | - | From the Kinase Screening Library |
| SP 600125 | Cayman Chemical | - | From the Kinase Screening Library |
| L-threo-Sphingosine C-18 | Cayman Chemical | - | From the Kinase Screening Library |
| H-89 | Cayman Chemical | - | From the Kinase Screening Library |
| HA-1077 (hydrochloride) | Cayman Chemical | - | From the Kinase Screening Library |
| AG-370 | Cayman Chemical | - | From the Kinase Screening Library |
| Wortmannin | Cayman Chemical | - | From the Kinase Screening Library |
| AG-1296 | Cayman Chemical | - | From the Kinase Screening Library |
| KT 5823 | Cayman Chemical | - | From the Kinase Screening Library |
| Janex 1 | Cayman Chemical | - | From the Kinase Screening Library |
| CAY10574 | Cayman Chemical | - | From the Kinase Screening Library |
| CAY10575 | Cayman Chemical | - | From the Kinase Screening Library |
| CAY10576 | Cayman Chemical | - | From the Kinase Screening Library |
| NH125 | Cayman Chemical | - | From the Kinase Screening Library |
| TWS119 | Cayman Chemical | - | From the Kinase Screening Library |
| NSC 210902 | Cayman Chemical | - | From the Kinase Screening Library |
| CAY10577 | Cayman Chemical | - | From the Kinase Screening Library |
| CAY10578 | Cayman Chemical | - | From the Kinase Screening Library |
| PD 184161 | Cayman Chemical | - | From the Kinase Screening Library |
| CCT018159 | Cayman Chemical | - | From the Kinase Screening Library |
| Myricetin | Cayman Chemical | - | From the Kinase Screening Library |
References
- Gascoigne, N. R., Rybakin, V., Acuto, O., Brzostek, J. TCR Signal Strength and T Cell Development. Annual Review of Cell and Developmental Biology. 32, 327-348 (2016).
- Rothenberg, E. V., Moore, J. E., Yui, M. A. Launching the T-cell-lineage developmental programme. Nature Reviews Immunology. 8 (1), 9-21 (2008).
- Klein, L., Hinterberger, M., Wirnsberger, G., Kyewski, B. Antigen presentation in the thymus for positive selection and central tolerance induction. Nature Reviews Immunology. 9 (12), 833-844 (2009).
- Starr, T. K., Jameson, S. C., Hogquist, K. A. Positive and negative selection of T cells. Annual Review of Immunology. 21, 139-176 (2003).
- Rybakin, V., Gascoigne, N. R. Negative selection assay based on stimulation of T cell receptor transgenic thymocytes with peptide-MHC tetramers. PLoS One. 7 (8), e43191(2012).
- Krogsgaard, M., Juang, J., Davis, M. M. A role for "self" in T-cell activation. Seminars in Immunology. 19 (4), 236-244 (2007).
- Nakayama, T., Yamashita, M. The TCR-mediated signaling pathways that control the direction of helper T cell differentiation. Seminars in Immunology. 22 (5), 303-309 (2010).
- Hoerter, J. A., et al. Coreceptor affinity for MHC defines peptide specificity requirements for TCR interaction with coagonist peptide-MHC. The Journal of Experimental Medicine. 210 (9), 1807-1821 (2013).
- Zhao, X., et al. Nonstimulatory peptide-MHC enhances human T-cell antigen-specific responses by amplifying proximal TCR signaling. Nature Communications. 9 (1), 2716(2018).
- Fu, G., et al. Fine-tuning T cell receptor signaling to control T cell development. Trends in Immunology. 35 (7), 311-318 (2014).
- Wang, D., et al. Tespa1 is involved in late thymocyte development through the regulation of TCR-mediated signaling. Nature Immunology. 13 (6), 560-568 (2012).
- Fu, G., et al. Themis sets the signal threshold for positive and negative selection in T-cell development. Nature. 504 (7480), 441-445 (2013).
- Rosenblum, M. D., Gratz, I. K., Paw, J. S., Abbas, A. K. Treating human autoimmunity: current practice and future prospects. Science Translational Medicine. 4 (125), (2012).
- Hebeisen, M., et al. SHP-1 phosphatase activity counteracts increased T cell receptor affinity. The Journal of Clinical Investigation. 123 (3), 1044-1056 (2013).
- Wang, R. E., et al. An immunosuppressive antibody-drug conjugate. Journal of the American Chemical Society. 137 (9), 3229-3232 (2015).
- Borroto, A., et al. First-in-class inhibitor of the T cell receptor for the treatment of autoimmune diseases. Science Translational Medicine. 8 (370), (2016).
- Chen, E. W., Brzostek, J., Gascoigne, N. R. J., Rybakin, V. Development of a screening strategy for new modulators of T cell receptor signaling and T cell activation. Scientific Reports. 8 (1), 10046(2018).
- Fouda, A., Tahsini, M., Khodayarian, F., Al-Nafisah, F., Rafei, M. A Fluorescence-based Lymphocyte Assay Suitable for High-throughput Screening of Small Molecules. Journal of Visualized Experiments. (121), e55199(2017).
- Zhao, Z., et al. A high-throughput phenotypic screen of cytotoxic T lymphocyte lytic granule exocytosis reveals candidate immunosuppressants. Journal of Biomolecular Screening. 20 (3), 359-371 (2015).
- Florian, A. E., et al. Flow cytometry enables a high-throughput homogeneous fluorescent antibody-binding assay for cytotoxic T cell lytic granule exocytosis. Journal of Biomolecular Screening. 18 (4), 420-429 (2013).
- Krutzik, P. O., Crane, J. M., Clutter, M. R., Nolan, G. P. High-content single-cell drug screening with phosphospecific flow cytometry. Nature Chemical Biology. 4 (2), 132-142 (2008).
- Vlahos, C. J., Matter, W. F., Hui, K. Y., Brown, R. F. A specific inhibitor of phosphatidylinositol 3-kinase, 2-(4-morpholinyl)-8-phenyl-4H-1-benzopyran-4-one (LY294002). The Journal of Biological Chemistry. 269 (7), 5241-5248 (1994).
- Chen, Z., et al. Synthesis and SAR of novel 4-morpholinopyrrolopyrimidine derivatives as potent phosphatidylinositol 3-kinase inhibitors. Journal of Medicinal Chemistry. 53 (8), 3169-3182 (2010).
- Ruegg, U. T., Burgess, G. M. Staurosporine, K-252 and UCN-01: potent but nonspecific inhibitors of protein kinases. Trends in Pharmacological Sciences. 10 (6), 218-220 (1989).
- Davis, P. D., et al. Inhibitors of protein kinase C. 1. 2,3-Bisarylmaleimides. Journal of Medicinal Chemistry. 35 (1), 177-184 (1992).
- Komander, D., et al. Interactions of LY333531 and other bisindolyl maleimide inhibitors with PDK1. Structure (London, England: 1993). 12 (2), 215-226 (2004).
- Gassel, M., et al. The protein kinase C inhibitor bisindolyl maleimide 2 binds with reversed orientations to different conformations of protein kinase A. The Journal of Biological Chemistry. 279 (22), 23679-23690 (2004).
- Faull, A., Johnstone, C., Morley, A., et al. Novel compounds. , (2003).
- Favata, M. F., et al. Identification of a novel inhibitor of mitogen-activated protein kinase kinase. The Journal of Biological Chemistry. 273 (29), 18623-18632 (1998).
- Woods, C. M., Zhu, J., McQueney, P. A., Bollag, D., Lazarides, E. Taxol-induced mitotic block triggers rapid onset of a p53-independent apoptotic pathway. Molecular Medicine (Cambridge, MA). 1 (5), 506-526 (1995).
- Teng, X., et al. Structure-activity relationship study of novel necroptosis inhibitors. Bioorganic & Medicinal Chemistry Letters. 15 (22), 5039-5044 (2005).
- Saini, M., et al. Regulation of Zap70 expression during thymocyte development enables temporal separation of CD4 and CD8 repertoire selection at different signaling thresholds. Science Signaling. 3 (114), ra23(2010).
- Chae, H. J., et al. Molecular mechanism of staurosporine-induced apoptosis in osteoblasts. Pharmacological Research. 42 (4), 373-381 (2000).
- Varas, A., et al. Analysis of the human neonatal thymus: evidence for a transient thymic involution. Journal of Immunology (Baltimore, MD:1950). 164 (12), 6260-6267 (2000).
- Verstichel, G., et al. The checkpoint for agonist selection precedes conventional selection in human thymus. Science Immunology. 2 (8), (2017).
- Yamaguchi, E., de Vries, J., Yssel, H. Differentiation of human single-positive fetal thymocytes in vitro into IL-4- and/or IFN-gamma-producing CD4+ and CD8+ T cells. International Immunology. 11 (4), 593-603 (1999).
- Farley, A. M., et al. Dynamics of thymus organogenesis and colonization in early human development. Development (Cambridge, UK). 140 (9), 2015-2026 (2013).
- Cali, J. J., et al. Bioluminescent assays for ADMET. Expert Opinion on Drug Metabolism & Toxicology. 4 (1), 103-120 (2008).
Reprints and Permissions
