1. Experimental set-up
- Patient recruitment
NOTE: All procedures were reviewed and approved by the Seoul National University Bundang Hospital Institutional Review Board. These subjects were inpatients or outpatients with stroke diagnoses from four rehabilitation hospitals in the region.- Perform the screening process using the following inclusion criteria: (1) upper extremity hemiparesis due to stroke; (2) over the age of 20 years; (3) mild elbow joint spasticity of MAS 1-2; (4) no previous disease affecting function of the hemiparetic arm, except for stroke; (5) free from hemodynamic instability; (6) no severe elbow contracture; (7) possibility for the shoulder to be abducted 90° and forearm to be in the neutral position without any joint pain; and (8) normal cognitive, language, visuospatial, or attention ability to follow experimental procedures.
NOTE: The criteria are designed to screen patients who are able to participate in the experiment and regulate factors affecting the results. - Recruit subjects who are provided with a detailed explanation of the entire study and expected clinical issues. Consent must be obtained prior to inclusion.
- Demographics and baseline characteristics of the recruited subjects are shown in Table 1.
- Perform the screening process using the following inclusion criteria: (1) upper extremity hemiparesis due to stroke; (2) over the age of 20 years; (3) mild elbow joint spasticity of MAS 1-2; (4) no previous disease affecting function of the hemiparetic arm, except for stroke; (5) free from hemodynamic instability; (6) no severe elbow contracture; (7) possibility for the shoulder to be abducted 90° and forearm to be in the neutral position without any joint pain; and (8) normal cognitive, language, visuospatial, or attention ability to follow experimental procedures.
- Experimental system
NOTE: A customized robotic device is used to produce standardized motion and measure the quantitative data simultaneously. The robotic system consists of a robotic part, control system, and measurement units. The overall configuration is shown in Figure 2.- Robotic part
- For the robotic part, use a one-degree-of-freedom planar robot consisting of a motor and a forearm manipulandum, with three other components for adjusting the robot height and installing the device to various desks. The overall composition is shown in Figure 2A.
- For the forearm manipulandum, use an elbow joint connected to the motor, a linear slider with a fixation block to adjust the overall length and two cuff units for fixating the forearm and hand (as shown in Figure 3). The elbow joint has a rotating plate and a thrust bearing to prevent chafing during the experiment, and the cuff units were curved similar to that of a human forearm and were made using a 3D printer. The handle unit is designed to accommodate both left and right handed individuals, making it available to any subjects.
- Use a motor with a low gear ratio of 51:1, which should have back-drivable characteristics and the ability to produce a nominal speed of 315°/s and a continuous torque of 42.33 Nm.
- Use a lab jack unit that is attached to the bottom of the motor to adjust the height of the motor unit. The height of the robot will be able to be adjusted to the sitting height of various subjects.
- Place a fixation arm for mounting the device to the desk on the front part of the robot. The fixation arm will be movable up and down through a linear shaft and has clamps for securing to the desk.
- Place casters with stopper on the bottom of the robot, making the robot movable and grounded during the experiment.
- Control system
- Use a personal computer (PC), real-time processor, and motor driver for the central control system. The detailed control architecture block diagram is shown in Figure 4.
- Use a graphic user interface (GUI) to control the experiment mode (maximum ROM measurement, Isokinetic MTS, and manual MTS measurement modes) and store robot motion data. It contains a control panel and a monitoring panel (Figure 5). Details on the GUI configuration are included in the appendix.
- Implement the robot control algorithm using a real-time processor. The control algorithm consists of three control loops. The first loop is a data input/output loop that runs at 1 MHz from the FPGA module of the sbRIO. The second is a robot motion control loop that runs at 1 kHz from the real-time VI level. The last is a data communication loop that runs at 250 Hz. This loop transmits robot data (time, angle, torque and trigger signal for matching with EMG data).
NOTE: The real-time processor has two communication modules: NI-9237 and NI-9853. The NI-9237 is an analog input device for receiving torque sensor data, and the NI-9853 is a CAN communication module for communicating with the motor driver.
- Measurement units
- Mount a torque sensor between the manipulandum and the motor to measure the reaction force. The torque data is transferred to the real-time processor via NI-9237. The NI-9237 has its own passband, stopband, and alias-free bandwidth filter. The filtered data enters the FPGA module and is processed again at 100 Hz with a low-pass filter to remove noises.
- Measure the joint angle by an encoder (HEDL 9140, Maxon, Switzerland) attached to the motor. The angle data is transferred to the real-time processor via the motor driver.
- Measure muscle activity with an eight-channel surface EMG device. The EMG data was collected at a sampling rate of 1024 Hz, and initially processed with a bandpass filter (20–450 Hz) and a notch filter (60 Hz). The measured EMG data is transferred to the PC directly.
- Robotic part
2. Experimental set-up
NOTE: Two raters should participate in this experiment. In our case, the first rater was a physiatrist with more than 6 years of experience in rehabilitation, and the second rater was an occupational therapist with more than 3 years of experience in stroke rehabilitation.
- Initial posture setting
- Place the patient in a chair with his/her back in a straight posture.
- Secure both sides of the shoulder and abdomen with seatbelts to keep the shoulder position stable throughout the experiment.
- Place the subject’s hemiparetic arm lightly on the robot manipulandum without fastening the strap.
- Unfasten the fixation block of the linear slider so that the cuff can be moved freely on the slider and allow the subject’s hemiparetic arm to be placed on the robot manipulandum without fastening the straps.
- Adjust the height of the robot using the lab jack until the patient’s shoulder is abducted 90°. Confirm the abduction angle using a goniometer.
- Instruct the subject to hold the handle and fasten the hand to the handle with straps. Align the rotation axis of the robot and anatomical axis of the elbow joint.
- Flex and extend the elbow joint so that the position of the cuff can be readjusted naturally in an optimal position without generating resistance during the elbow movement. Then, fasten the fixation block to fix the position of the cuff and fasten the straps of the forearm cuff.
- Attach the surface EMG electrodes on the biceps brachii muscle in the hemiparetic arm.
- Passive ROM measurement
NOTE: Passive ROM is used as a boundary ROM in the following experiments to prevent problems caused by movement outside the patient’s operation range.- Input the patient's hemiparetic side information into the program GUI (right or left).
- Set the elbow 90° flexed using a goniometer. Press the 90 deg set button on the GUI panel. This process matches the angle recognized by the robot with the actual human joint angle.
- Press the Finish set button on the GUI to switch the robot to the actuating state.
- Click the buttons on the Motor run panel on the left side of the GUI in order from top to bottom.
- Turn on the Angle set button and set the speed to 1°/s. Then click the run button. The robot will extend the elbow slowly at 1°/s from a 90° flexed posture until the reaction torque reaches a certain threshold level or extends by 170°.
NOTE: In this experiment, the torque threshold was set to 0.6 Nm. This value is determined experimentally via a pilot study. - The maximum extended angle is automatically stored as the maximum ROM.
- Change the speed to -1°/s and click the run button again. The robot flexes the elbow slowly until the reaction torque reaches the threshold level.
- The maximum flexed angle is automatically stored as the minimum ROM.
3. MTS measurement
NOTE: The time required for each step is shown in Figure 1. The total time taken by one subject to perform all the experiment is about 50 min (including the experiment set-up step), but most of the time should be spent resting to maintain consistency of fatigue.
- Inertia effect compensation
NOTE: Theoretically, there should be no inertia effect during the isokinetic motion. However, there may be an inertia effect at the beginning of the motion. The inertial force should be compensated to measure only the reaction force generated by a stretch reflex. Since the magnitude of the inertial force is different for each subject, a preliminary test for the inertial force compensation should be performed before the actual MTS measurement. An example result is shown in Figure 6.- Click the Back button on the control panel. The robot will flex the elbow to minimum angle posture (maximally flexed posture).
- Set the speed to 150°/s and turn on the Inertia test button then the Run button. The robot will apply a short perturbation of 5° to the patient at a rate of 150°/s. The peak torque and period value of each trial are automatically stacked and displayed on the GUI panel.
- Repeat steps 3.1.2–3.1.3 two more times. Determine a proper peak torque value and period value from the measured data and enter the value on the program GUI. The compensation torque profile (τcomp) is automatically generated based on Equation 1 below, where: a, represents the determined amplitude and λ represents the period.

NOTE: The shape of the inertial torque is modeled as a raised cosine shape to reduce the calculation load. The compensation torque, which is designed for two periods due to the inertia effect, almost disappears after the second period. The amplitude of the second period is designed to be 15% of the first period.
- Familiarization step
- Prior to the actual experiment, perform three training operations to familiarize the patient with sudden movements.
- Click the Back button on the panel. The robot will flex the elbow to the minimum angle posture.
- Click the Run button after informing the subject. The robot will extend the patient’s elbow at a rate of 150°/s, until the angle reaches to a maximum angle or the reaction torque reaches the threshold level.
- Repeat steps 3.2.2–3.2.3 two more times and take a 5 min rest before starting the test.
- Isokinetic MTS measurement
NOTE: The isokinetic MTS measurement is designed to implement an ideal MTS measurement condition. The robot produces accurate constant velocity motion at a predetermined speed (150°/s) until reaching the maximum ROM or until reaching a certain threshold of the reaction torque. The maximum ROM value is determined in step 2.2, and the torque threshold value is determined as 0.6 via previous pilot studies, which is sufficient for detecting stretch reflexes.- Click the Back button to flex the elbow to the minimum angle posture.
- Click the Run button without informing the subject. The robot will extend the patient’s elbow at a rate of 150°/s until the angle reaches the maximum angle or the reaction torque reaches a certain threshold level. Time, angle, reaction torque, and trigger signal data are stored during the test.
- Take a 2 min break between sets and repeat steps 3.3.1–3.3.3 two more times.
- Take a 5 min rest after performing three sets.
- Manual MTS measurement
NOTE: The manual MTS measurement is designed to simulate the MTS measurement normally performed at actual medical sites. To compare the results of isokinetic MTS, the robotic device is used only as a quantitative measuring tool that removes the measurement error, and actual measurement operation is performed by a human rater. For this purpose, the robot only compensates the friction of the robot itself. Details of the friction removal is in the appendix.- Click the Back button to flex the elbow to the minimum angle posture.
- Click the Free run button, and the robot operation will change to manual operation mode.
- Hold the handle of the manipulandum and stretch the subject’s arm. During operation, the rater should generate a constant speed of 150°/s.
- Turn off the Free run mode and take a 2 min break.
- Repeat steps 3.4.1–3.4.4 two more times.
- Repeat MTS measurement
- Take a 10 min rest after finishing the whole experiment with the first rater.
- Change the rater (to the second rater) and repeat steps 3.3–3.4.
4. Quantifying the AoC
NOTE: AoC is determined based on two data: EMG and torque. AoC is determined by manual analysis due to the noisy characteristics of the EMG data and variability of individual characteristics. The AoC selection is carried out by a third rater, who is blind to the order of raters.
- Isokinetic MTS experiment data analysis
- AoC evaluation using EMG data
NOTE: Generally, AoC is determined as the angle at which the maximum peak value of the EMG occurs. However, a stretch reflex duration is different for each patient; thus, using the EMG maximum peak point as an AoC is expected to have low reliability. The time difference may not be large; however, the AoC error can be significant due to the fast assessment speed of the MTS method. Therefore, the angle at the start of EMG upsurge point is selected as the AoC.- Process the raw EMG data using the root mean square (RMS) to smooth the data and amplify it 50x.
- Synchronize the EMG data and robot angle data using the trigger signals of each data set.
NOTE: In this system, the EMG data is measured by an independent device, unlike other data; therefore, the reference time may be different. The EMG device has a trigger interrupt marking function, which obtains the trigger signal from a real-time processor at the onset of MTS assessment. - Determine the AoC manually as the starting point of the RMS EMG upsurge. The example is shown in Figure 7.
NOTE: The RMS EMG of <0.1 is ignored here because it appears frequently even without the stretch reflex. Thus, a clear upsurge point at the start of the peak is selected as the AoC.
- AoC evaluation using the torque data
NOTE: Muscles have passive mechanical characteristics that acts like a spring-damper system. Even if the muscle does not exert any force, the reaction force can increase as the muscles stretch. Because the intensity of the passive mechanical property and stretch reflex varies from patient to patient, it is difficult to identify the catch using only the absolute value of the reaction force. Instead, in this study, the catch is determined by changing the passive property due to spasticity rather than the absolute value of the reaction force. The change of the passive property is manually determined by the change in the slope of the regression line of the reaction torque.- Draw one regression line from the point where the trigger signal goes up and draw another regression line from the point where the trigger signal goes down.
- Compare the slopes of the two regression lines. If the gradients of two regression lines show a significant difference, AoC can be determined at the intersection of two regression lines. The example is shown in Figure 8.
- AoC evaluation using EMG data
- Manual MTS experiment data analysis
NOTE: In the case of manual MTS, it is difficult to separate the force exerted by the subject and that applied by the rater using only one torque sensor. Therefore, in the case of manual MTS, only an AoC analysis using EMG data is performed without performing AoC analysis using the torque data.- AoC evaluation using EMG data
NOTE: The method to determining AoC evaluation using EMG is basically the same as for the isokinetic MTS case.- Process the raw EMG data using the RMS method to smooth the data and amplify it 50x.
- Synchronize the EMG data and the robot angle data using the trigger signals of each data set.
- Determine the AoC manually as the starting point of the RMS EMG upsurge. An example is shown in Figure 9.
- AoC evaluation using EMG data
5. Data analysis
- Normalized assessment motion index (NAMI)
NOTE: The AoC of MTS can be affected by various motion factors, such as assessment speed, acceleration, etc. Therefore, the assessment motion should be as isokinetic as possible. The NAMI is proposed to evaluate the ideality of the assessment motion. The proposed index is a non-dimensional index that can be used to evaluate the consistency of the assessment motion assigned to the subjects in each trial.- Calculate the ROM, maximum velocity and assessment time from each assessment trial.
NOTE: The angle is measured by the encoder; thus, the calculated velocity is noisy. Therefore, the maximum velocity is determined as the maximum velocity of the trend line, not the peak point. - Calculate the NAMI value for each trial during the whole experiment using Equation 3:

Where: ϑmax and ϑmin represent maximum and minimum angles, respectively, measured during the experiment; ωmax is the maximum assessment speed; and Δt is the total time spent for one assessment. Figure 10 shows an example of each variable.
NOTE: The proposed index gives a score close to 1 if the assessment motion is close to completely isokinetic and a score close to 0 if the velocity of the motion is inconsistent.
- Calculate the ROM, maximum velocity and assessment time from each assessment trial.
- Statistical analysis
NOTE: All statistical analyses are performed using the PASW statistical package (SPSS version 18.0). The intraclass correlation coefficient (ICC) method is used to identify the test-retest reliability and inter-rater reliability. Only results from the second and third tests are used to calculate the ICC.- To verify test-retest reliability, calculate the ICC from the measured AoC data and NAMI result.
- To verify inter-rater reliability, calculate the ICC from the average of AoC and NAMI data.
- Calculate the p-value of the AoC results using paired sample t-tests to evaluate the differences between each rater or each assessment trial.
NOTE: P-values of <0.05 are considered statistically significant. - Calculate the Pearson correlation coefficient between AoC based on EMG criteria and torque criteria to verify a correlation between the two methods.
The reliability is divided into four grades according to the ICC value: extremely excellent (>0.90), excellent (0.75 < ICC ≤ 0.90), fair to good (0.40 < ICC ≤ 0.75), and poor (<0.40). The standard error of measurements (SEM) was calculated to determine the error component of the variance. The smallest detectable difference (SDD) was calculated from the SEM of test-retest data.
Normalized assessment motion index (NAMI): the NAMI score during an isokinetic motion was always 1, which means that the isokinetic device always generated a uniform constant input velocity. However, the test-retest reliability of the NAMI during a manual motion was poor for both rater 1 (ICC [95% CI] = -0.035 [-0.495–0.441]) and rater 2 (ICC [95%CI] = 0.438 [-0.038–0.752]). Moreover, the inter-rater reliability of the NAMI during manual motion was also poor (ICC [95% CI] = 0.148 [-0.344–0.576]). Conversely, the results of the two human raters showed almost equal averaged NAMI values (0.68 and 0.67 for each rater). The consistency error of the two human raters was larger than that of the isokinetic device, showing a large difference between the two raters. These results indicate that an assessment motion by a human rater is lacking in the isokinetic characteristics and that motion is inconsistent depending on the subject.
Test-retest reliability: Table 2 shows test-retest reliability for the AoC results in three conditions (isokinetic-EMG, isokinetic-torque, manual-EMG). The test-retest reliability for manual MTS was excellent (ICC = 0.804 and 0.840). However, the isokinetic MTS measurement improved test-retest reliability to the extremely excellent grade on both the EMG and torque criteria (Table 2)
Inter-rater reliability: Table 3 shows inter-rater reliability for the AoC measurement performance in three conditions. The ICC of the inter-rater reliability of the manual MTS was 0.788, which was near the lower limit of the excellent grade. The isokinetic MTS improved inter-rater reliability to the ICC of 0.890 based on EMG data and to the ICC of 0.931 based on torque data.
Correlations and consistency of timing of AoC between the EMG and torque criteria: the two AoC results calculated from the EMG data and torque data during the isokinetic MTS show a significantly high correlation in both rater 1 (Pearson correlation coefficient = 0.937, p < 0.001) and rater 2 (Pearson correlation coefficient = 0.957, p < 0.001). Moreover, the timing of AoC between the two results was highly consistent with an ICC of 1 (p < 0.001).

Figure 1: Experiment flow chart.
This figure is modified from Sin et al.10. Please click here to view a larger version of this figure.
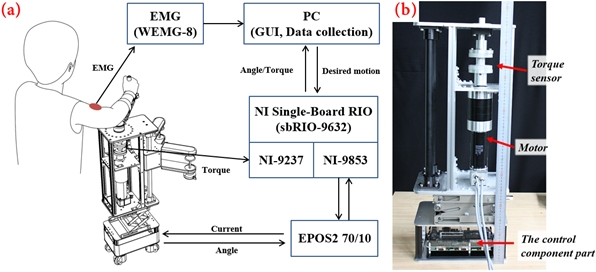
Figure 2: Isokinetic MTS test robot.
(A) Configuration of the isokinetic robot device. (B) Inside configuration of the device. The control system includes a real-time processor and motor driver. (B) was previously published by Sin et al.10. Please click here to view a larger version of this figure.

Figure 3: Composition of the manipulandum.
Two cuffs for the wrist and forearm are connected to the linear slider through a fixation block, making the position of the cuff adjustable. A handle and hand strap are switchable from left-to-right. Please click here to view a larger version of this figure.

Figure 4: Control system Configuration.
The right three blocks show the hierarchy of the control system and arrows show the data flow between each unit. Please click here to view a larger version of this figure.

Figure 5: Graphic user interface (GUI).
The left side is the controller panel, which contains the various buttons or numeric controls required for robot control. The right side is a monitoring panel that shows the angle, interaction torque, and trigger signal in real-time. Please click here to view a larger version of this figure.

Figure 6: Example of inertia effect compensation.
The green line indicates the raw torque; the blue dotted line indicates the inertial force model; and the red line indicates the inertial torque compensation result. This figure was previously published by Sin et al.10. Please click here to view a larger version of this figure.

Figure 7: Example of AoC evaluation using EMG data (isokinetic MTS case).
An RMS EMG value of less than 0.1 is regarded as normal. Selection of the starting point of the clear EMG upsurge point is performed, and the angle value at that time is determined as AoC. This figure was previously published by Sin et al.10. Please click here to view a larger version of this figure.

Figure 8: Example of AoC evaluation using torque data (isokinetic MTS case).
Evaluation involves the following steps: draw two lines connecting the torque of the assessment starting point and the end point with an arbitrary torque data, respectively; find the point where the two lines become the regression line of the torque data before and after the selected point; if there is a significant difference between the gradient of two regression line, it is judged that a stretch reflex occurs at this point. This figure was previously published by Sin et al.10. Please click here to view a larger version of this figure.

Figure 9: Example of AoC evaluation using EMG data (manual MTS case).
As done in the isokinetic case (Figure 7), the AoC is determined as the angle when a clear upsurge of the EMG occurs. This figure was previously published by Sin et al.10. Please click here to view a larger version of this figure.

Figure 10: Variables for the normalized assessment motion index (NAMI).
Intuitively, the NAMI value is the ratio of the area under the velocity graph to the area of the gray box. More isokinetic movements show values closer to 1. This figure is previously published by Sin et al.10. Please click here to view a larger version of this figure.
| Variable | Result |
| Age, years, mean (SD) | 54.6 (12.2) |
| Gender, n (%) | |
| Men | 14 (82.4) |
| Women | 3 (17.6)) |
| Days from stroke onset, median (IQR) | 722 (1226) |
| Hemiplegic side, n (%) | |
| Right | 10 (58.8) |
| Left | 7 (41.2) |
| Stroke type, n (%) | |
| Ischemic | 11 (64.7) |
| Hemorrhagic | 6 (35.3) |
| Stroke lesion, n (%) | |
| Cortical | 4 (23.5) |
| Subcortical | 13 (76.5) |
| Brunnstrom stage, median (IQR) | |
| Arm | 4 (1) |
| Hand | 3 (1) |
| Leg | 4 (1) |
| Muscle Power, median (IQR) | |
| Elbow flexor | 4 (1) |
| Elbow extensor | 4 (1) |
| MAS, elbow flexor, n (%) | |
| 1 | 7 (41.2) |
| 1+ | 5 (29.4) |
| 2 | 5 (29.4) |
Table 1: Subjects demographics and baseline characteristics.
| Test | Retest | p | SEM | SDD | ICC (2,1) (95% CI) | |
| Mean (SD) | Mean (SD) | |||||
| Rater 1 | ||||||
| Isokinetic (150°/s) motion with EMG | 93.74 (28.35) | 90.93 (25.44) | 0.216 | 12.12 | 33.59 | 0.948 (0.857-0.981) |
| Isokinetic (150°/s) motion with torque | 90.30 (27.93) | 89.61 (27.25) | 0.201 | 3.02 | 8.37 | 0.997 (0.992-0.996) |
| Manual motion with EMG | 82.67 (19.11) | 82.03 (21.73) | 0.838 | 17.21 | 47.7 | 0.804 (0.538-0924) |
| Rater 2 | ||||||
| Isokinetic (150°/s) motion with EMG | 90.77 (28.69) | 88.14 (28.34) | 0.123 | 15.1 | 41.86 | 0.929 (0.929-0.991) |
| Isokinetic (150°/s) motion with torque | 97.06 (23.47) | 94.37 (25.86) | 0.192 | 9.9 | 27.44 | 0.959 (0.873-0.987) |
| Manual motion with EMG | 80.96 (21.30) | 80.46 (22.81) | 0.875 | 16.94 | 46.96 | 0.840 (0.601-0.941) |
Table 2: Test-retest reliability results for the angle of catch measured with isokinetic robotic devices and robotic devices with manual motion.
This table was published by Sin et al.10 (p-values are calculated by paired sample t-test). SEM: standard error of measurement, SDD: smallest detectable difference, ICC: intraclass correlation coefficient, EMG: electromyography.
| Rater 1 | Rater 2 | p | SEM | ICC (2,1) (95% CI) | |
| Mean (SD) | Mean (SD) | ||||
| Isokinetic (150°/s) motion with EMG | 88.16 (28.24) | 89.46 (28.33) | 0.973 | 17.81 | 0.890 (0.685-0.961) |
| Isokinetic (150°/s) motion with torque | 94.32 (240.13) | 95.71 (24.44) | 0.775 | 12.54 | 0.931 (0.791-0.978) |
| Manual motion with EMG | 80.81 (18.98) | 80.71 (21.17) | 0.586 | 17.5 | 0.788 (0.493-0.920) |
Table 3: Inter-rater reliability results for the angle of catch measured with isokinetic robotic devices and robotic devices with manual motion.
This table was published by Sin et al.10 (p-values are calculated by paired sample t-test). SEM: standard error of measurement, ICC: intraclass correlation coefficient, EMG: electromyography.
Appendix. Please click here to download this file.
