A novel three-dimensional spheroid model based on the heterotypic interaction of tumor cells and stromal fibroblasts is established. Here, we present coculture of tumor cells and stromal fibroblasts, time-lapse imaging, and confocal microscopy to visualize the formation of spheroids. This three-dimensional model offers a pertinent platform to study tumor-stroma interactions and test cancer therapeutics.
Method Article
A Novel Stromal Fibroblast-Modulated 3D Tumor Spheroid Model for Studying Tumor-Stroma Interaction and Drug Discovery
In This Article
Summary
Abstract
Tumor-stroma interactions play an important role in cancer progression. Three-dimensional (3D) tumor spheroid models are the most widely used in vitro model in the study of cancer stem/initiating cells, preclinical cancer research, and drug screening. The 3D spheroid models are superior to conventional tumor cell culture and reproduce some important characters of real solid tumors. However, conventional 3D tumor spheroids are made up exclusively of tumor cells. They lack the participation of tumor stromal cells and have insufficient extracellular matrix (ECM) deposition, thus only partially mimicking the in vivo conditions of tumor tissues. We established a new multicellular 3D spheroid model composed of tumor cells and stromal fibroblasts that better mimics the in vivo heterogeneous tumor microenvironment and its native desmoplasia. The formation of spheroids is strictly regulated by the tumor stromal fibroblasts and is determined by the activity of certain crucial intracellular signaling pathways (e.g., Notch signaling) in stromal fibroblasts. In this article, we present the techniques for coculture of tumor cells-stromal fibroblasts, time-lapse imaging to visualize cell-cell interactions, and confocal microscopy to display the 3D architectural features of the spheroids. We also show two examples of the practical application of this 3D spheroid model. This novel multicellular 3D spheroid model offers a useful platform for studying tumor-stroma interaction, elucidating how stromal fibroblasts regulate cancer stem/initiating cells, which determine tumor progression and aggressiveness, and exploring involvement of stromal reaction in cancer drug sensitivity and resistance. This platform can also be a pertinent in vitro model for drug discovery.
Introduction
Solid tumors represent complex tissues composed of neoplastic cells and a large variety of stromal cells1,2,3,4. Stromal fibroblasts, or cancer-associated fibroblasts (CAF), are one of the prominent stromal cell populations in most types of solid tumors. They are critically involved in regulating tumor growth, stemness, metastasis, angiogenesis, and drug resistance through the production of growth factors, cytokines/chemokines, synthesis of ECM and remodeling enzymes (e.g., collagen, fibronectin, and matrix metalloproteases), release of exosomes, and direct heterotypic cell-cell interaction5,6,7,8,9,10,11. CAF also take part in determining cancer organ-specific metastasis by preselecting a subset of tumor clones from heterogeneous tumor cell populations in the primary lesion and fostering these selected clones to be primed for metastasis to a specific distant organ whose microenvironment is optimal for recolonization of selected clones12. Moreover, fibroblasts and their secreted soluble factors and ECM participate in the modulation of tumor angiogenesis13,14, anti-tumor immune response15, and are even involved in drug resistance and tumor recurrence16,17.
In vitro 3D tumor spheroid models have been developed and used in cancer research as an intermediate model between in vitro cancer cell cultures and in vivo tumor models18,19,20,21. The 3D tumor spheroid models have gained popularity in cancer stem cell research, preclinical cancer research, and drug screening because these models reproduce some important features of real tumors that are absent in traditional 2D monolayers22. Many existing 3D tumor spheroid models are solely constituted of tumor cells and lack the participation of tumor stromal cells. This often results in tumor spheroids having insufficient ECM deposition and absence of heterotypic cell-cell interactions. Conventional 3D spheroids formed exclusively by cancer cells and homotypic cell-cell adhesion may only partially mimic the in vivo conditions of tumor tissues. To overcome some of these limitations, investigators have proposed incorporating multiple types of stromal cells in 3D cocultures and developed several heterotype 3D tumor spheroid models23,24,25,26,27. In addition, investigators have employed exogenous 3D matrices, including natural hydrogels or synthetic polymers such as polyethylene glycol, poly(lactide-co-glycolide), and poly(N-isopropylacrylamide), to embed monocellular and multicellular spheroid models, creating a cell-supportive environment and reproducing cell-matrix interactions28,29, thereby making these systems more biologically relevant30. However, incorporation of certain types of stromal cells, such as endothelial cells, in 3D cocultures brings about additional complexity for an in vitro system and makes it difficult to study heterotypic cell-cell interactions between two specific types of cells, such as cancer cell-fibroblast interactions. Moreover, endothelial cells in real tissues do not always directly interact with cancer cells and other stromal cells because there is a layer of basement membrane wrapped outside of the capillaries that prevents endothelial cells from directly interacting with cancer cells and other stromal cells. In those 3D spheroid models, incorporated endothelial cells do not actually form blood vessels, yet interact directly with cancer cells and other stromal cells, something that rarely occurs in vivo. Similarly, exogenous matrices employed in some of the 3D spheroid models are not identical to the ECM in real tumor tissues in terms of structure and composition. All of these artificial conditions may result in misleading data.
We have recently created a new multicellular 3D spheroid model composed of tumor cells and CAF. In our model, the formation of 3D tumor spheroids is entirely determined by CAF. CAF induce and regulate the phenotype of tumor stem/initiating cells. The ECM produced by CAF is natural and allows the desmoplastic structure to better mimic the in vivo tumor microenvironment. This novel 3D model can be a useful tool for cancer drug screening and offers a unique platform to study tumor-stroma interaction, elucidate how CAF regulate cancer stem/initiating cells, and explore the involvement of stromal interactions in cancer drug sensitivity and resistance.
Protocol
1. Culturing Melanoma Cells and Skin Fibroblasts
- Culturing human melanoma cells
- Culture human melanoma cells, C816131 under conventional adherent cell culture conditions in complete W489 medium (see step 1.2) in a 37 °C incubator supplied with 5% CO2 as described previously32. Split the cells at a 1:5 ratio when they reach ~90% confluency.
- Melanoma cell culture medium (W489)
- For complete W489 medium, use 80% MCDB153 medium, 20% L-15 medium (see Table of Materials), 2% fetal bovine serum (FBS), 5 μg/mL insulin, 1.68 mM CaCl2, and 0.11% sodium bicarbonate. For coculture, do not add FBS, insulin, and CaCl2.
- Mouse skin fibroblast isolation
- Cut a 1 cm x 1 cm skin fragment from a mouse in accordance with the relevant guidelines and regulations of the institution's Animal Care and Use Committee (IACUC).
- Digest the skin by dispase (see Table of Materials) at 4 °C overnight. Strip the dermis from the epidermis and further digest with collagenase (1 mg/mL in DMEM, see Table of Materials) at room temperature (RT) overnight.
- Mouse skin fibroblast culturing
- Wash the tissue pellets with PBS and culture them in DMEM with 10% FBS and 1% penicillin-streptomycin in 37 °C/5% CO2. Split the cells at a 1:2 ratio when they reach ~90% confluency.
- Transduce the skin fibroblasts with GFP/lentivirus using standard methods before coculture.
- Characterization of mouse skin fibroblasts by immunostaining
- Cell preparation for staining
- Seed the skin fibroblasts in 24 well plate at a density of 2 x 10⁴ cells/well. On day 2, wash the cells with PBS 2x and fix them in 2% neutral buffered formalin for 10 min. Remove the formalin and wash the fixed cells with PBS twice.
- Immunostaining
- Add 200 μL of blocking solution to each well and incubate the plate for 30 min at RT, then add mouse anti-α-SMA diluted at 1:200 and incubate at 37 °C for 1 h. Wash with PBS 3x, 5 min each.
- Add Alex Fluor 488 goat anti-mouse IgG at 1:400 dilution and incubate at RT for 1 h. Wash out the antibodies 3x with PBS, 5 min each.
- Add 1 μg/mL DAPI and incubate at RT for 2 min. Remove DAPI solution and add 500 μL of PBS into each well.
- Observe the cells and take images using an inverted fluorescence microscope.
- Cell preparation for staining
- Prelabelling fibroblasts and melanoma cells
- Seed fibroblasts into a 100 mm dish on day 1 so that the cell confluency reaches ~60% the next day. On day 2, remove the culture medium and add GFP/lentivirus (~1:3–1:5 diluted from stock) into regular culture medium with 4 μg/mL of polybrene. Incubate cells in a 37 °C incubator for 6 h, remove the medium and replace with fresh regular culture medium. After 2 days, observe the GFP signal from the cells using a fluorescence microscope. Transduce C8161 cells with DsRed/lentivirus under similar conditions. Protocols for the preparation of GFP/lentivirus and DsRed/lentivirus have been described previously14,34.
2. Cell Coculture
- Seed the C8161-fibroblast coculture.
- On day 0 of the spheroid formation assay, detach both the C8161 and the skin fibroblasts using 0.25% trypsin-EDTA. Spin down the cells at 250 g for 5 min at RT and wash once with PBS.
- Resuspend the cells in cell coculture medium (serum free, insulin free, and calcium free W489 medium mixed with serum free DMEM at a 1:1 ratio). Adjust the cell concentration to 2 x 10⁴ cells/mL.
- Mix the C8161 cells with the fibroblasts at a 1:1 ratio and add 2 mL of the cell mixtures to each well of a 24 well plate. Each well should contain 2 x 10⁴ of each type of cells. Each condition should be done in triplicate.
NOTE: It is important to use a non-tissue culture treated plate (see Table of Materials). Otherwise, the cells will strongly attach to a plate and be unable to from suspending spheroids.
- Incubate cells at 37 °C for 4 h until the cells attach to the plate, and then perform time-lapse imaging or confocal scanning at the indicated time points for each assay.
3. Live Cell Time-lapse Imaging
- Before coculture, turn on the time-lapse imaging system (see Table of Materials) following the manufacturer's instructions and let the incubator reach 37 °C and 5% CO2. It usually takes 1 h for the system to reach equilibrium. Carefully place the culture plate on the stage of the microscope inside the incubator and securely lock the door.
- Open the software of time-lapse imaging system (see Table of Materials) and choose the plate type and manufacturer so the microscope can locate the scanning area accurately. Choose the wells of interest and a 10x objective lens. Choose the settings for the scanning area, the interval time between the scans, and a starting as well as an ending time. In this protocol, the maximum format number for the scanning area for 1 well is 36 and the interval time is 1 h.
- Record time-lapse imaging from 4–52 h.
NOTE: The starting time, ending time, and duration should be optimized by cell type and the purpose of the experiment. - When completing the image recording, use the time-lapse imaging system software to retrieve the data and export videos or image sets.
4. Confocal Microscopy and 3D Movies
- Place the cell coculture plate on the stage of an inverted fluorescence microscope (see Table of Materials) and use red and green laser beams. Observe the cells under a 5x or 10x objective lens and choose a spheroid to start scanning.
- Use a 1 µm z-step to scan from the bottom to top of the spheroid. Process the data using image processing software (see Table of Materials) to reconstruct a 3D image that can be further rotated and saved as a 3D movie.
5. Solo Culture of Melanoma Cells and Formation of 2D Clusters/Aggregates
- Seed 2 x 10⁴ C8161 melanoma cells into each well of a 24 well plate as described in section 2.1. Culture the cells for 7–10 days and photograph them using an inverted fluorescence microscope.
6. Checking if 3D Spheroids and 2D Cell Clusters/Aggregates are Suspended in the Medium or Attached to the Plates
- For cell coculture, check the 3D spheroids formed on day 7. For single cell culture, check the 2D clusters/aggregates formed on day 10.
- Set cell culture plates on the platform of an inverted fluorescence microscope. Put a bent needle with a syringe into a well and gently aspirate the culture medium in and out to disturb the culture medium in the wells. Record this process using the movie mode of the movie software (see Table of Materials). The 3D spheroids will be mobile, but the 2D cell clusters/aggregates will remain steadfast.
7. Confocal Image of 3D Spheroids
NOTE: Cocultured cells start to form spheroids from 48–72 h depending on the type of fibroblasts used. Generally, spheroids enlarge gradually with time. Small spheroids can fuse to form larger spheroids until day 7. After spheroids are stabilized in size, they can last more than 10 days. After that, the spheroids often detach from the bottom of the culture plate and congregate in the center of the wells. During the enlargement of the spheroids, the cells in the center usually die due to insufficient nutrition and/or a toxic microenvironment. Hence, the peak of 3D spheroid formation and timing to image the matured spheroids should be optimized using pilot experiments. For this protocol, confocal microscopy was performed around day 7 when the spheroids were mature and the cells in the center of spheroids were still alive according to the fluorescence and morphology of the cells in the center.
- To do confocal microscopy, use a green and red laser to scan the spheroids. Determine the scanning area under a 10x objective and move from the bottom to top of the spheroid with a 1 µm z-step.
- Generate the 3D spheroid formation and rotation videos using the 3D-projection function of the image processing software (e.g., ImageJ).
8. Intracellular Notch1 Signaling Pathway Activity in Determining Stromal Regulation of Cancer Stem/Initiating Cells
- Isolation and characterization of skin fibroblasts from gain- and loss-of-function Notch1 mice
- Isolate skin fibroblasts from two pairs of genetically modified mice: Gain-Of-Function Notch1 (GOFNotch1: Fsp1.Cre+/-;ROSALSL-N1IC+/+) mice versus their counterpart control (GOFctrl : FSP1.Cre-/-;ROSALSL-N1IC+/+) mice and Loss-Of-Function Notch1 (LOFNotch1: Fsp1.Cre+/-;Notch1LoxP/LoxP+/+) mice versus their counterpart control (LOFctrl : FSP1.Cre-/-; Notch1LoxP/LoxP+/+) mice31, respectively. Isolate and characterize skin fibroblasts using the protocol described in sections 1.3-1.5.
- Transduce the mouse skin fibroblasts with GFP/lentivirus.
- See section 1 for the method to transduce the cells with the lentiviral vector.
- Coculture of fibroblasts and melanoma cells
- Conduct the cell coculture experiment as described in section 2.
- Assessing the effect of intracellular Notch1 pathway activity in the fibroblasts on determining stromal regulation of cancer stem/initiating cells by measuring the sizes of the 3D spheroids
- Carry out the quantification of spheroid formation under each condition by photographing the spheroids at the time when spheroids are mature (indicated by the stop of growth around day 5–7 depending upon the types of fibroblasts). Measure the sizes of the 3D spheroids using the image processing software.
9. Testing the Drug Response of Cancer Stem/Initiating Cells Using the 3D Spheroid Assay
NOTE: CAF can regulate cancer heterogenicity and induce phenotype of cancer stem/initiating cells. CAF also support cancer stem/initiating cells to endure clinical treatments. Cancer stem cells have been shown to be responsible for drug resistance. Therefore, we used this 3D spheroid model to evaluate the drug response of cancer stem/initiating cells. The outcome can assess potential clinical efficacy of anti-cancer medication well.
- Drug administration
- Right after coculturing the cells in a 24 well plate, prepare the drugs in a serial dilution in culture medium to reach 5x of a desired range of concentrations based on pilot experiments (i.e., 1 nM, 2.5 nM, 5 nM, 10 nM, and 25 nM).
Add 0.5 mL of corresponding drug solutions to each well of the cocultured cells. Treat the control group with regular coculture media as mentioned above. - NOTE: MEK inhibitor is soluble in cell culture media. Therefore, blank controls are 2.5 mL of cell culture medium. However, if the drug is not soluble in aqueous solution and requires solvents such as DMSO, then cell culture media with the same concentration of DMSO should be applied to the control group.
- Right after coculturing the cells in a 24 well plate, prepare the drugs in a serial dilution in culture medium to reach 5x of a desired range of concentrations based on pilot experiments (i.e., 1 nM, 2.5 nM, 5 nM, 10 nM, and 25 nM).
- Quantification of drug response by counting spheroids
- Observe the treated cells and untreated cells using a fluorescence microscope and photograph the cells every day. Quantify the spheroid formation in the different experimental groups and compare the spheroid-forming ability of the cell cultures under different drug concentrations.
NOTE: The spheroids tend to appear ~5−7 days after the coculture. The drug effects will become noticeable at that time point. - Use fluorescence microscope to image/photograph the spheroids and cells in the wells and then use the image software to calculate the average size of the spheroids and the numbers of spheroids formed per low power field (LPF x 4) in each treatment group over time.
NOTE: Cells that receive effective drug treatment should form fewer or no spheroids compared to the control group. This is an indication of the tested drug's effectiveness on suppressing cancer stem cells.
- Observe the treated cells and untreated cells using a fluorescence microscope and photograph the cells every day. Quantify the spheroid formation in the different experimental groups and compare the spheroid-forming ability of the cell cultures under different drug concentrations.
Results
We developed a novel method to generate 3D spheroids with an in vitro heterotypic cell coculture system that mimics the in vivo tumor microenvironment. Fibroblasts are derived from mouse skin fibroblasts. Skin fibroblasts were generated as described above and were characterized as α-SMA+/Vimentin+/FSP-1+ cells. Human metastatic melanoma cells (C8161) were cultured in W489 medium as described32. To visualize and distinguish fibroblasts from tumor cells, fibroblasts and melanoma cells were pretransduced with GFP/lentivirus and DsRed/lentivirus, respectively34,36, before cell coculture.
Figure 1 shows an example of multicellular 3D spheroids formed by coculturing melanoma cells and fibroblasts. Melanoma cells cultured in the absence of fibroblasts did not form typical 3D spheroids, although some melanoma cells form 2D clusters/aggregates with the extended culture. The average size of the spheroids was approximately 170–360 μm in diameter (mean = 275, SD = 37) on day ~5−7. Using time-lapse imaging, we observed that fibroblasts and tumor cells interacted in coculture and started to form 3D spheroids at around 36 h of coculture as shown in Video 1. Time-lapse imaging recorded the dynamic process of cell-cell interaction and the initial phase of spheroid formation at ~4–52 h of coculture. The peak of 3D spheroid formation occurred around day ~5−7. The formed 3D spheroids were composed of fibroblasts and melanoma cells, where the majority (~80%) were tumor cells. Video 2 shows the dynamic process of single cultured melanoma cells (DsRed+/C8161) in the formation of cell cluster/aggregates starting from ~4–52 h in single culture. The formation of 2D clusters/aggregates peaked around day ~7–10. Video 3 and Video 4 show the structures of a 3D spheroid and a 2D tumor cell cluster visualized by confocal microscopy, respectively. The 3D spheroid and the 2D tumor cell clusters were examined by confocal microscopy on day 7 of cell coculture. Video 5 shows that the 3D spheroids were suspended in the culture medium and mobile, while Video 6 shows that the 2D tumor cell cluster was attached to the culture plate and immobile. Suspension in the medium is a feature of 3D spheroids that distinguishes them from 2D clusters. When the medium in the cell culture dish or well is disturbed by either dropping or gently pipetting the culture medium, the suspended 3D spheroids move, whereas 2D cell clusters are immobile. Only a few single dead cells are mobile.
Figure 2A shows an example of this 3D model serving as a unique platform to study tumor-stroma interactions and to elucidate how intracellular Notch1 signaling pathway activity in CAF regulates cancer stem/initiating cells and spheroid formation. Two pairs of fibroblasts (Fb) isolated from the skin of Gain-Of-Function Notch1 (GOFNotch1: Fsp1.Cre+/-;ROSALSL-N1IC+/+) mice versus their counterpart control (GOFctrl : FSP1.Cre-/-;ROSALSL-N1IC+/+) mice and Loss-Of-Function Notch1 (LOFNotch1: Fsp1.Cre+/-;Notch1LoxP/LoxP+/+) mice versus their counterpart control (LOFctrl : FSP1.Cre-/-; Notch1LoxP/LoxP+/+) mice35, respectively. All fibroblasts were transduced by GFP/lentivirus and cocultured with C8161 melanoma cells pretransduced with DsRed/lentivirus. Time-lapse imaging shows that Fb-GOFNotch1 stopped C8161 melanoma cells from forming 3D spheroids compared to Fb-GOFctrl during the first ~4-52 h of cell coculture. In contrast, Fb-LOFNotch1 promoted formation of 3D spheroids by C8161 melanoma cells compared to Fb-LOFctrl. Figure 2B, top, shows representative images of 3D spheroids formed on day 7 of cell coculture with different fibroblasts carrying out varied Notch pathway activities. Figure 2B, bottom, shows the quantitative data on the average size of 3D spheroids formed on day 7 of cell coculture with different fibroblasts carrying varied Notch pathway activities.
Figure 3 shows an example of this 3D model being used to test the drug response of cancer stem/initiating cells. Cancer stem/initiating cells have been shown to be responsible for drug resistance and cancer recurrence. Therefore, evaluating drug response using this 3D model can better reveal a potential drug's clinical efficacy for cancer treatment. The C8161 melanoma cells rely on active MAPK signaling for cell growth and invasion. They also express high levels of CDK4/Kit, but do not carry a BRAF mutation. To test the drug response of cancer stem/initiating cells towards the MAPK inhibitor using this 3D model, we cocultured C8161 melanoma cells and fibroblasts in 24 well plates. PD0325901 (see Table of Materials), a MAPK inhibitor, was prepared in a serial dilution at a range of concentrations from 1 nM, 2.5 nM, 5 nM, 10 nM, and 25 nM. The PD0325901 was added to the cell cocultures when cell mixtures were plated. Untreated cocultured cells were used as control. We evaluated the spheroid-forming ability of the cell cocultures under different drug concentrations and compared it with the untreated control. Figure 3A shows representative images of 3D spheroids formed on day 5 of cell coculture under different drug concentrations. Figure 3B is the quantitative data of the average size per spheroid and numbers of 3D spheroids formed per low power field (LPF x 4) on day 5 of cell coculture under different drug concentrations.

Figure 1: Formation of 3D spheroids and 2D clusters. (A) Representative image of 3D spheroids formed by coculture of human C8161 melanoma cells and mouse skin fibroblasts. The 3D spheroids were photographed on day 7 of the coculture of melanoma cells and fibroblasts. The average sizes of the spheroids was ~170–360 μm in diameter (mean = 275, SD = 37) on day ~5−7. The average number of spheroids was 18–26 (20.5 ± 3.6) per low power field (LPF x4). (B) Representative image of 2D tumor cell clusters formed by single culture of C8161 melanoma cells. The 2D melanoma cell clusters were photographed on day 7 of single culture of melanoma cells. Please click here to view a larger version of this figure.
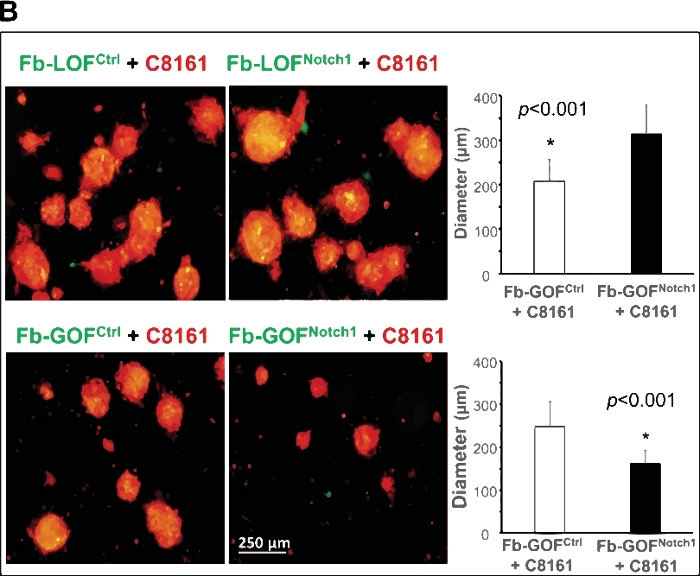
Figure 2: Elucidation of role of intracellular Notch1 signaling pathway activity in CAF in regulating cancer stem/initiating cells using the 3D spheroid model. (A) Intracellular Notch1 signaling pathway activity in CAF determined the formation of spheroids by melanoma cells in cell coculture. Time-lapse video shows that Fb-GOFNotch1 stopped the formation of 3D spheroids by the C8161 melanoma cells, while Fb-LOFNotch1 promoted the formation of more 3D spheroids by the C8161 melanoma cells during the first 4–52 h of cell coculture. (B) Top: Representative images of 3D spheroids formed on day 7 of cell coculture with different fibroblasts carrying varied Notch pathway functions. Bottom: The quantitative data of the average size (diameter [μm]/spheroid) of the 3D spheroids formed on day 7 of cell coculture with different fibroblasts carrying varied Notch pathway activities. The two-tail student's t-test was used for statistical analysis. Data are expressed as mean ± standard deviation (SD). Please click here to view a larger version of this figure.

Figure 3: Assessment of drug response of cancer stem/initiating cells using the 3D spheroid model. (A) Representative images of 3D spheroids formed on day 5 of cell coculture under different drug concentrations. (B) The quantitative data of the average size (diameter [μm]/spheroid) and the number of 3D spheroids per low power field (LPF x 4) formed on day 5 of cell coculture under different drug concentrations. Quantitative data are expressed as mean ± standard deviation (SD). Please click here to view a larger version of this figure.
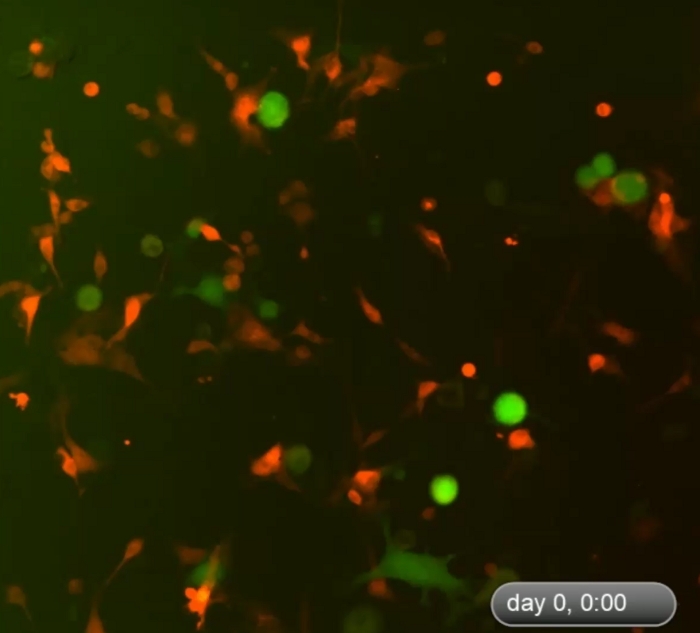
Video 1: Dynamic process of formation of 3D spheroids in the early phase of cell coculture. Time-lapse imaging shows dynamic cell-cell interactions between fibroblasts and tumor cells in the coculture and formation of 3D spheroids during the first ~4–52 h of cell coculture. The cells started to form 3D spheroids around 48 h after the start of coculture. The peak of 3D spheroid formation occurred on day ~5−7 (not displayed here). The 3D spheroids were composed of fibroblasts and melanoma cells, where the majority (~80%) were tumor cells. Please click here to download this video.
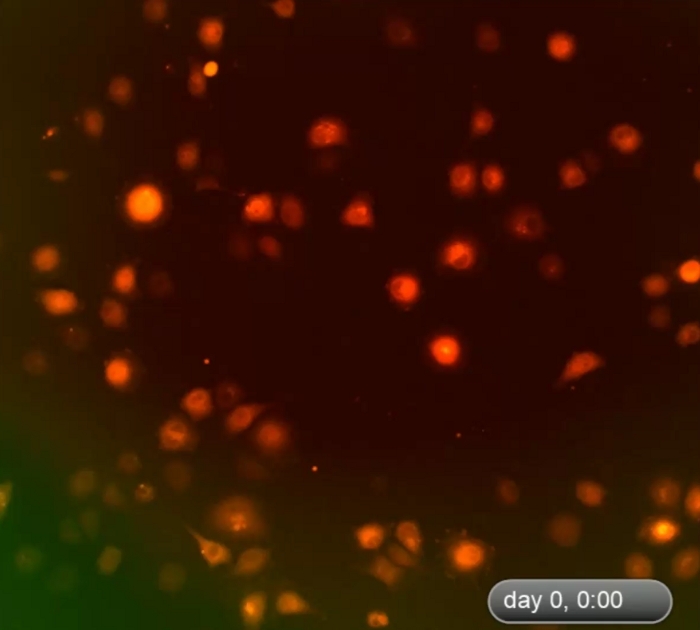
Video 2: Dynamic process of formation of 2D clusters in the early phase of cell coculture. Time-lapse imaging shows the dynamic process of 2D clusters formed by C8161melanoma cells in single culture. Formation of 2D clusters occurred around day ~7–10. Time-lapse imaging records the period of ~4–52 h in single culture of DsRed+/C8161 melanoma cells. Please click here to download this video.

Video 3: Architecture and rotation of a 3D spheroid as visualized by confocal microscopy. Architecture and rotation of a 3D spheroid. Green and red lasers were used to scan the spheroids formed on day 7 in cell coculture. The scan area was determined under a 10x objective. The scan starts from the bottom to the top of the spheroid at a 1 µm z-step. The 3D spheroid rotation movie was created using Fiji software. Please click here to download this video.
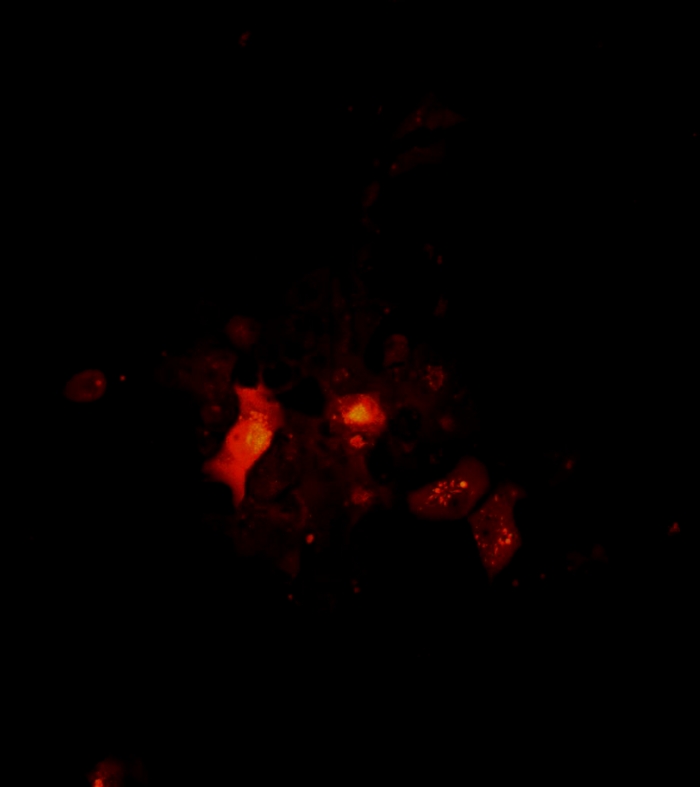
Video 4: Architecture and rotation a 2D tumor cell cluster as visualized by confocal microscopy. Architecture and rotation of a 2D cluster. Confocal images of cell clusters were taken on day 7 of melanoma cell single culture. The scan area was determined under a 10x objective. The scan starts from the bottom to the top of the spheroid at a 1 µm z-step. The 2D cluster rotation movie was created using Fiji software. Please click here to download this video.

Video 5: Movement of 3D spheroids. The 3D spheroids were suspended in the culture medium and did not adhere to the culture dish/well. When still medium in the cell culture well was disturbed by gentle pipetting, the suspended 3D spheroids moved. Please click here to download this video.
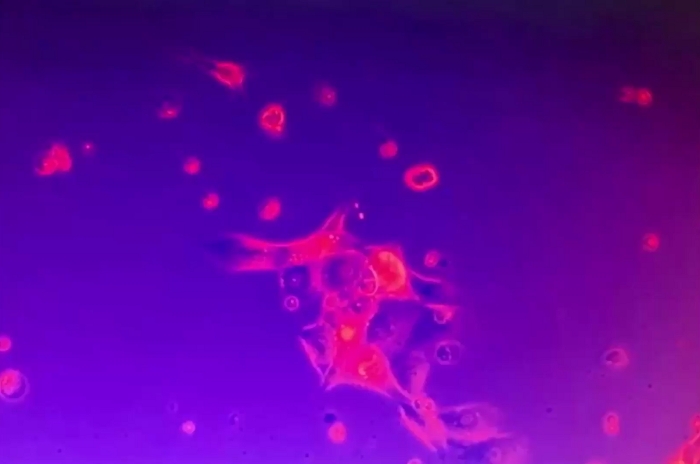
Video 6: Steadfastness of 2D tumor cell clusters. The 2D tumor cell cluster was anchored to the culture plate and immobile in spite of disturbance of the culture medium. A few single dead cells were mobile. Please click here to download this video.
Discussion
In vitro 3D cell culture techniques have been widely employed for decades in cancer research. Compared to conventional 2D cell culture systems, the 3D microenvironment recapitulates the cell-cell and/or cell-matrix interactions and enables mimicking the genuine conditions observed in tumor tissues. However, a 3D system formed only by cancer cells and homotypic cell-cell interactions does not take into account the importance of heterotypic cross talk and may provide inaccurate results in research. We have recently developed a novel 3D system combining cancer cells and CAF to better mimic in vivo heterogeneous tumor microenvironment and its native and stiff desmoplastic reaction.
Fibroblasts are major components of tumor stroma. CAF are involved in regulating tumor progression by eliciting soluble factors, ECM/remodeling enzymes10,11, and exosomes. Additionally, CAF play a part in drug resistance and tumor recurrence16,17. Our multicellular 3D spheroid system can be utilized to explore molecular mechanisms of tumor-stromal interactions and to address drug resistance and tumor recurrence. CAF are primarily derived from activated local quiescent fibroblasts and recruited circulating bone marrow MSC, which undergo in situ differentiation into CAF in tumor tissue37,38,39. In the current study, we used skin fibroblasts to create a multicellular 3D spheroid model. However, other type of fibroblasts (e.g., MSC-DF), also work in a very similar way as skin fibroblasts to regulate tumor cell 3D spheroid formation34. MSC-DF can be generated from murine bone marrow MSC, which is enriched by culturing bone marrow mononuclear cells in MSC cell culture medium for about 10 days with periodic medium changes every 3 days. These MSC are characterized as CD73+/CD105+/Lin-. To differentiate MSC into fibroblasts, MSC are subsequently cultured with complete DMEM for an additional 2 weeks. MSC-DF are characterized as α-SMA+/Vimentin+/FSP-1+ cells36. MSC-DF can be important tumor regulators. Because a fraction of CAF in many types of solid tumors are differentiated from recruited circulating MSC released from bone marrow36, MSC-DF can be promising treatment targets. They are also much more easily therapeutically manipulated or targeted before they are recruited to tumor tissues and differentiated into CAF. Thus, our 3D model offers an ideal system to study and test not only cancer cells, but also different fractions or subpopulations of CAF. The method for 3D spheroid formation is straightforward. The critical steps include using serum free medium for coculture, applying the right ratio of fibroblasts to tumor cells, and using the right culture plates for coculture. The potential limitation of our method is that the formation of 3D spheroids is largely cancer cell line-dependent. Our spheroid formation protocol may require optimization of the ratio between fibroblasts and cancer cells if different cancer cell lines are employed. It should be noted that we used a human melanoma cell and mouse fibroblast cell coculture model for the formation of 3D spheroids, because it is much easier to create GOF or LOF cells in mouse fibroblasts for the study of the role of a molecule or signaling pathway in regulating tumor spheroid formation. The capability of human melanoma cells and mouse fibroblasts to form spheroids indicates that molecules required for cell-cell communications work cross-species. We have recently tested coculture of human fibroblasts with human melanoma cells and found that human fibroblasts can also regulate human melanoma cells to form 3D spheroids.
We employed human metastatic melanoma cells, C8161, in our multicellular 3D spheroid model. We also tested other human melanoma cells, for example, 1205Lu32, which carries the BRAFV600E mutation, and MeWo, which expresses high levels of CDK4/Kit (ATCC HTB-65), and found that they are also able to form 3D spheroids in coculture. This indicates that formation of 3D spheroids by tumor cells is independent of the types of oncogenic mutations. Although we have not tested whether other types of non-melanoma tumor cells are capable of forming 3D spheroids with fibroblasts, our findings indicate that formation of 3D spheroids is not limited to a melanoma cell line and may not depend upon a specific cancer cell line.
We showed two examples of practical applications of our 3D spheroid model. One example was to elucidate the intracellular Notch signaling pathway activity in regulating the cancer stem/initiating cell phenotype and 3D spheroid formation. We demonstrated that the intracellular Notch signaling pathway in CAF is a molecular switch controlling the phenotype of cancer stem/initiating cells using this 3D spheroid model. Our findings not only uncover a molecular mechanism underlying stromal regulation of cancer stem/initiating cells and cancer heterogenicity, but also highlight that the Notch pathway in CAF is a critical target for melanoma therapeutics. This example indicates that our 3D spheroid model is very useful to study the mechanisms for cancer cell-stromal fibroblast interactions and identify potential therapeutic targets. Another example was to test the drug response of cancer stem/initiating cells in the presence of CAF. It is well known that the drug response of cancer cells, including cancer stem/initiating cells, varies in the presence and absence of CAF. Presence of CAF in this in vitro system makes this model more clinically relevant and generated test results more reliable. Furthermore, our 3D spheroid system is versatile. It can be used for various purposes. For example, if drug resistant cancer cells are employed in this 3D model, it can be changed to address drug resistance and maybe tumor recurrence. It can also be modified to test or screen drugs that primarily target CAF for cancer treatment. CAF have recently become promising therapeutic targets. There are advantages to targeting CAF. First, as compared with tumor cells that are abnormal (often with genetic alterations) and smart (easily gain resistance to chemo- and radiotherapies), CAF in tumor tissue are normal cells and genetically more stable, so they are less likely to develop resistance to the treatments. Second, targeting CAF does not depend on the type of oncogenic mutations in the tumor cells. Third, targeting CAF may achieve multiple hit effects through fibroblasts-dependent anti-tumor, anti-angiogenesis, and/or the modulating cancer immune response. Our 3D spheroid model is a powerful tool for discovery of diverse sets of cancer therapeutic strategies.
Disclosures
The authors declare they have no competing financial interests.
Acknowledgements
We thank Dr. Omaida C. Velazquez (University of Miami) for helpful collaboration, consultation, and discussion; Dr. Jie Li (University of Miami) for providing MeWo cells; and Dr. Meenhard Herlyn (The Wistar Institute) for providing all other melanoma cells. We also thank Dr. Marcia Boulina, Director of Analytical Imaging Core Facility, University of Miami, for imaging analysis. Zhao-Jun Liu was supported by grants from Bankhead-Coley Cancer Research Program (Award# 09BN-11), Women's Cancer Association (the 53rd annual grant) and internal funds from the University of Miami.
Materials
| Name | Company | Catalog Number | Comments |
|---|---|---|---|
| 0.25% Trypsin-EDTA | Corning | 25-253-CI | |
| 24-well plate | Corning | 351147 | Non-tissue culture treated plate, 24-well, flat bottom with low evaporation lid |
| Alex Fluor 488 goat anti-mouse IgG | Life Technology | A21202 | |
| CaCl2 1.5 M | Sigma-Aldrich | C5670-500G | |
| Collagenase, Type 1A | Sigma-Aldrich | C-2674 | 500 mg, 1 mg/mL concentration in DMEM. |
| DakoCytomation | Dako | x0909 | |
| DAPI | |||
| Dispase Grade II | Roche Diagnostics | 165859 | |
| Dulbecco's Modified Eagle's Medium(DMEM) | Corning | 10-013-CV | |
| Fetal Bovine Serum | VMR | 97068-085 | Premium Grade |
| Fiji (ImageJ) | NIH | Free for downloading, no license needed. | |
| IncuCyte Zoom 2016A | Essen Bioscience | ||
| IncuCyte Zoom System | Essen Bioscience | ||
| Insulin | Sigma-Aldrich | I1882 | |
| L-15 Medium (Leibovitz) | Sigma-Aldrich | L1518 | |
| Leica SP5 Inverted Confocal Microscope | Leica | ||
| MCDB 153 Medium | Sigma-Aldrich | M7403-10X1L | |
| Mouse anti α-SMA (smooth muscle actin), monoclone | Abcam | ab18640 | |
| Olympus IX51 Inverted Fluorescence Microscope | Olympus | IX51 | |
| Olymupus CellSens | Olympus | ||
| PD0325901 | Selleckchem Chemicals | S1036 | |
| Penicillin Streptomycin Solution | Corning | 30-002- CI | 100 X |
| Sodium Bicarbonate 7.5% | Corning | 25-035-CI |
References
- Lorusso, G., Ruegg, C. The tumor microenvironment and its contribution to tumor evolution toward metastasis. Histochemistry and Cell Biology. 130, 1091-1103 (2008).
- Anton, K., Glod, J. Targeting the tumor stroma in cancer therapy. Current Pharmaceutical Biotechnology. 10, 185-191 (2009).
- Hanahan, D., Weinberg, R. A. Hallmarks of cancer: the next generation. Cell. 144, 646-674 (2011).
- Junttila, M. R., de Sauvage, F. J. Influence of tumour micro-environment heterogeneity on therapeutic response. Nature. 501, 346-354 (2013).
- Allinen, M., et al. Molecular characterization of the tumor microenvironment in breast cancer. Cancer Cell. 6, 17-32 (2004).
- Bhowmick, N. A., Neilson, E. G., Moses, H. L. Stromal fibroblasts in cancer initiation and progression. Nature. 432, 332-337 (2004).
- Lynch, C. C., Matrisian, L. M. Matrix metalloproteinases in tumor-host cell communication. Differentiation. 70, 561-573 (2002).
- Midwood, K. S., Williams, L. V., Schwarzbauer, J. E. Tissue repair and the dynamics of the extracellular matrix. The International Journal of Biochemistry & Cell Biology. 36, 1031-1037 (2004).
- Olumi, A. F., et al. Carcinoma-associated fibroblasts direct tumor progression of initiated human prostatic epithelium. Cancer Research. 59, 5002-5011 (1999).
- Orimo, A., Weinberg, R. A. Stromal fibroblasts in cancer: a novel tumor-promoting cell type. Cell Cycle. 5, 1597-1601 (2006).
- Luga, V., et al. Exosomes mediate stromal mobilization of autocrine Wnt-PCP signaling in breast cancer cell migration. Cell. 151, 1542-1556 (2012).
- Zhang, X. H., et al. Selection of bone metastasis seeds by mesenchymal signals in the primary tumor stroma. Cell. 154, 1060-1073 (2013).
- Orimo, A., et al. Stromal fibroblasts present in invasive human breast carcinomas promote tumor growth and angiogenesis through elevated SDF-1/CXCL12 secretion. Cell. 121, 335-348 (2005).
- Shao, H., et al. Activation of Notch1 signaling in stromal fibroblasts inhibits melanoma growth by upregulating WISP-1. Oncogene. 30, 4316(2011).
- Ziani, L., Chouaib, S., Thiery, J. Alteration of the Antitumor Immune Response by Cancer-Associated Fibroblasts. Frontier in Immunology. 9, 414(2018).
- Kraman, M., et al. Suppression of antitumor immunity by stromal cells expressing fibroblast activation protein-alpha. Science. 330, 827-830 (2010).
- Straussman, R., et al. Tumour micro-environment elicits innate resistance to RAF inhibitors through HGF secretion. Nature. 487, 500-504 (2012).
- Smalley, K. S., Lioni, M., Noma, K., Haass, N. K., Herlyn, M. In vitro three-dimensional tumor microenvironment models for anticancer drug discovery. Expert Opinion on Drug Discovery. 3 (1), 1-10 (2007).
- Santiago-Walker, A., Li, L., Haass, N. K., Herlyn, M. Melanocytes: from morphology to application. Skin Pharmacology and Physiology. 22, 114-121 (2009).
- Beaumont, K. A., Mohana-Kumaran, N., Haass, N. K. Modeling melanoma in vitro and in vivo. Healthcare (basel). 2, 27-46 (2013).
- Beaumont, K. A., Anfosso, A., Ahmed, F., Weninger, W., Haass, N. K. Imaging- and flow cytometry-based analysis of cell position and the cell cycle in 3D melanoma spheroids. Journal of Visualized Experiments. (106), e53486(2015).
- Weiswald, L. B., Bellet, D., Dangles-Marie, V. Spherical cancer models in tumor biology. Neoplasia. 17, 1-15 (2015).
- Cui, X., Hartanto, Y., Zhang, H. Advances in multicellular spheroids formation. Journal of the Royal Society Interface. 14, (2017).
- Fennema, E., Rivron, N., Rouwkema, J., van Blitterswijk, C., de Boer, J. Spheroid culture as a tool for creating 3D complex tissues. Trends in Biotechnology. 31, 108-115 (2013).
- Thoma, C. R., Zimmermann, M., Agarkova, I., Kelm, J. M., Krek, W. 3D cell culture systems modeling tumor growth determinants in cancer target discovery. Advanced Drug Delivery Review. 69-70, 29-41 (2014).
- Bulin, A. L., Broekgaarden, M., Hasan, T. Comprehensive high-throughput image analysis for therapeutic efficacy of architecturally complex heterotypic organoids. Scientific Reports. 7, 16645(2017).
- Lazzari, G., et al. Multicellular spheroid based on a triple coculture: A novel 3D model to mimic pancreatic tumor complexity. Acta Biomaterialia. 78, 296-307 (2018).
- Fong, E. L., Harrington, D. A., Farach-Carson, M. C., Yu, H. Heralding a new paradigm in 3D tumor modeling. Biomaterials. 108, 197-213 (2016).
- Gu, L., Mooney, D. J. Biomaterials and emerging anticancer therapeutics: engineering the microenvironment. Nature Reviews Cancer. 16, 56-66 (2016).
- Tevis, K. M., Colson, Y. L., Grinstaff, M. W. Embedded Spheroids as Models of the Cancer Microenvironment. Advanced Biosystems. 1, (2017).
- Welch, D. R., et al. Characterization of a highly invasive and spontaneously metastatic human malignant melanoma cell line. International Journal of Cancer. 47, 227-237 (1991).
- Balint, K., et al. Activation of Notch1 signaling is required for beta-catenin-mediated human primary melanoma progression. Journal of Clinical Investigation. 115, 3166-3176 (2005).
- Meier, F., et al. Human melanoma progression in skin reconstructs : biological significance of bFGF. the American Journal of Pathology. 156, 193-200 (2000).
- Du, Y., et al. Intracellular Notch1 Signaling in Cancer-Associated Fibroblasts Dictates the Plasticity and Stemness of Melanoma Stem/Initiating Cells. Stem Cells. 37, 865-875 (2019).
- Shao, H., et al. Notch1 Pathway Activity Determines the Regulatory Role of Cancer-Associated Fibroblasts in Melanoma Growth and Invasion. PLoS One. 10, 0142815(2015).
- Shao, H., et al. Notch1-WISP-1 axis determines the regulatory role of mesenchymal stem cell-derived stromal fibroblasts in melanoma metastasis. Oncotarget. 7, 79262-79273 (2016).
- Kalluri, R., Neilson, E. G. Epithelial-mesenchymal transition and its implications for fibrosis. Journal of Clinical Investigation. 112, 1776-1784 (2003).
- Price, J. E. Xenograft models in immunodeficient animals : I. Nude mice: spontaneous and experimental metastasis models. Methods in Molecular Medicine. 58, 205-213 (2001).
- Spaeth, E. L., et al. Mesenchymal stem cell transition to tumor-associated fibroblasts contributes to fibrovascular network expansion and tumor progression. PLoS One. 4, 4992(2009).
Reprints and Permissions
