Presented here is a protocol to assess biventricular heart function in mice by generating pressure-volume (PV) loops from the right and left ventricle in the same animal using closed chest catheterization. The focus is on the technical aspect of surgery and data acquisition.
Method Article
Biventricular Assessment of Cardiac Function and Pressure-Volume Loops by Closed-Chest Catheterization in Mice
In This Article
Summary
Abstract
Assessment of cardiac function is essential to conduct cardiovascular and pulmonary-vascular preclinical research. Pressure-volume loops (PV loops) generated by recording both pressure and volume during cardiac catheterization are vital when assessing both systolic and diastolic cardiac function. Left and right heart function are closely related, reflected in ventricular interdependence. Thus, recording biventricular function in the same animal is important to get a complete assessment of cardiac function. In this protocol, a closed chest approach to cardiac catheterization consistent with the way catheterization is performed in patients is adopted in mice. While challenging, the closed chest strategy is a more physiological approach, because opening the chest results in major changes in preload and afterload that create artifacts, most notably a fall in systemic blood pressure. While high-resolution echocardiography is used to assess rodents, cardiac catheterization is invaluable, particularly when assessing diastolic pressures in both ventricles.
Described here is a procedure to perform invasive, closed chest, sequential left and right ventricular pressure-volume (PV) loops in the same animal. PV loops are acquired using admittance technology with a mouse pressure-volume catheter and pressure-volume system acquisition. The procedure is described, beginning with the neck dissection, which is required to access the right jugular vein and the right carotid artery, to the insertion and positioning of the catheter, and finally the data acquisition. Then, the criteria required to ensure the acquisition of high-quality PV loops are discussed. Finally, the analysis of the left and right ventricular PV loops and the different hemodynamic parameters available to quantify systolic and diastolic ventricular function are briefly described.
Introduction
According to the world health organization (WHO), heart disease is the leading cause of death worldwide for both men and women1,2,3. Many studies focus on diagnosing and improving impaired cardiac function4. For these applications high-quality and reproducible evaluation of cardiac function is critical. High fidelity and reproducible catheter data are required to assess both etiological and therapeutic responses. For example, the assessment of cardiac function is essential to evaluate the efficacy of drugs and other treatments in preclinical models of myocardial infarction5. While many cardiovascular studies focus on left ventricular function, right ventricular function is also a critical determinant of functional capacity and prognosis in patients with pulmonary-vascular disease6,7. In patients with advanced heart failure, persistently elevated right-sided and left-sided filling pressures are predictive of the combined risk of death, cardiovascular hospitalization, and heart transplantation8. In combined aortic and mitral valve disease, preoperative myocardial function (reflected in parameters such as cardiac index and left ventricular ejection fraction) is the main predictor of long-term survival9. Right ventricular function is the major predictor of both morbidity and mortality in pulmonary arterial hypertension10,11. Thus, assessment of the right ventricular function is a necessary component of a comprehensive preclinical study using models of pulmonary arterial hypertension12,13,14.
Left and right ventricular function are often studied independently. However, because the functions of the left and right ventricles are intimately linked, it is ideal to obtain a biventricular assessment of systolic and diastolic function from a single test15. For example, the right ventricle shares oblique fibers in the interventricular septum with the left ventricle, which constitutes one of the mechanical links between the left and right ventricular contractile function16,17. This phenomenon, known as systolic ventricular interaction, allows left ventricular contraction to augment the right ventricular contraction. Ventricular interactions during diastole are also important. During diastole, the volume of one ventricle influences the volume of the opposite ventricle, and thereby alters diastolic compliance and preload18,19. In pathological conditions, decreased function of one ventricle, or impaired volume loading, can directly or indirectly impair the function of the other ventricle20. As a consequence of systolic ventricular interaction, a global decrease in left ventricular function may reduce right ventricular contractile performance15. In patients with heart failure due to left ventricular systolic function and increased end diastolic pressure, pulmonary artery pressure is elevated, indirectly increasing right ventricle afterload21,22. Conversely, increased right ventricular pressure and volume overload in severe pulmonary hypertension exerts a mechanical compression on the left heart. This D-shaped flattening of the left ventricle, caused by a leftward shift in the interventricular septum, reduces left ventricular volumes and impaired systolic and diastolic function23,24,25,26,27. Thus, the assessment of both left and right ventricles is essential to evaluate global cardiac function in preclinical models of human disease.
Cardiac function can also be assessed by noninvasive echocardiography, magnetic resonance imaging (MRI), and invasive catheterization28,29,30. Echocardiography is the most commonly used imaging modality in cardiovascular research because it is relatively inexpensive and accessible31. However, echocardiography has several technical limitations, including indirect measurement of filling pressure and limited ability to quantify diastolic function. In addition, the quality of the data obtained by echocardiography is highly operator dependent. Cardiac MRI is a relatively new addition to preclinical imaging armamentarium that has great potential for quantitative assessment of biventricular function. Quantification with cardiac MRI is accurate, as it does not make geometric assumptions of ventricular shape, unlike echocardiography32. However, the MRI imaging platform is expensive, and is rarely available. Moreover, the processing of MRI data requires skilled support by a physicist or equivalent scientist, which is lacking in many preclinical laboratories33. Similarly, the use of microcomputed tomography (MicroCT) in preclinical studies provides quantitative high-resolution three-dimensional (3D) anatomical data that can be obtained noninvasively, allowing longitudinal studies34. However, MicroCT imaging requires the injection of contrast agents, which are often expensive. The MicroCT imaging platform, like MRI, is also expensive and also requires a skilled technician.
In contrast, catheterization is an invasive technique that consists of the introduction of a catheter in the right and/or left ventricle to measure pressure and/or volume. The tools required to perform cardiac catheterization are not as expensive as echocardiography, CT, or MRI. Substantial technical proficiency for catheterization and small animal anesthesia is required, however. Catheterization allows direct and accurate assessments of cardiac function28. In this protocol, an admittance PV catheter is used to assess cardiac function. This technology, based on the distinct electrical conductance properties of blood and cardiac muscle, allows for the simultaneous recording of pressure and volume within the cardiac cavity and generation of PV loops in real time5,35. Briefly, the catheter is comprised of both excitation electrodes and recording electrodes. The excitation electrodes generate an electrical field inside the right or left ventricle. The inner recording electrode measures voltage change, which is proportional to a change in resistance. Deriving ventricular volume is based on Ohm’s law (voltage = current x resistance) from which conductance (i.e., the inverse of resistance) is calculated. In this setting, the measured conductance value is a combination of blood conductance and muscle conductance. In the electric field, blood is purely resistive while muscle has both capacitive and resistive properties. The capacitive property of muscle causes a time delay in the measured signal. Tracking this delay, known as the “phase” angle, reports heart tissue intrusion into the field as the heart contracts. This measurement is greatest at systole and lowest at diastole. This property allows the separation of the muscle component of the conductance from that of blood and allows a close approximation of absolute systolic and diastolic volumes. Pressure-volume loops provide a range of hemodynamic parameters that are not readily measurable by other methods, such as simple retrograde catheterization using fluid filled catheters to measure cardiac pressures. Pressure-volume loops measure ventricular pressures but also provide data about contractility, elastance, power, energetics, and efficiency. In addition, PV loops provide robust quantitative measurements36. Thus, assessment of cardiac function by PV loops generated by catheterization has emerged as the gold standard in preclinical research37. In addition, preclinical techniques are relevant to human disease where cardiac catheterization, albeit with fluid filled catheters, is common. However, cardiac catheterization in rodents requires impeccable anesthesia and excellent technique to prevent excessive loss of blood, hypoventilation, or changes in body temperature.
In human patients, cardiac catheterization is performed in closed chest configuration and vascular access is achieved via the jugular or subclavian vein for the right ventricle and the radial or femoral artery for the left ventricle. Due to the small size of mice, the closed chest approach is often challenging. Thus, studies conducted in mice commonly adopt an open chest approach. This technique involves opening the thorax, thereby exposing the heart, and facilitating the insertion of the catheter via puncture of the left and/or right ventricular apex38. While this approach is technically less challenging and fairly reproducible, its major limitations include hemorrhage and other complications of apical insertion of catheters, and a marked drop in intracardiac pressure resulting from opening the thoracic cavity to atmospheric pressure. Opening the thorax in a ventilated rodent induces a 5–10 mm Hg decrease in left ventricular systolic pressure and 2–5 mm Hg decrease in right ventricular pressure39. Therefore, a closed chest approach that is less traumatic for the heart and yields more physiologically relevant measurements that are more easily translated to clinical assessment of cardiac function was developed.
Protocol
All experiments were performed in accordance with Queen’s University biosafety and ethical guidelines (ROMEO/TRAQ#6016826). The procedures followed were performed in accordance with institutional guidelines. This is a terminal procedure. Due to the invasiveness of the right and left catheterization, the animals should be euthanized immediately after data acquisition. Euthanasia should be performed according to the institution’s animal studies guidelines.
1. Experimental preparation and setup
- Put the catheter in a 10 mL syringe with saline/heparin, at room temperature 30 min before starting the experiment (Figure 1A).
- After 30 min, calibrate the catheter (e.g., baseline and acquisition system) according to the manufacturer's recommendations. The acquisition system displays high and low calibration values that are used to calibrate the acquisition system before starting an experiment. Output these values and make sure that they match.
- Use the button “Pressure Balance Control”, “Coarse +/- “, or “Fine +/-“ to set up the baseline pressure value at zero.
- Perform a two point calibration for high and low signal.
- On the control console press “System Setting” in the “Catheter Menu”.
- Press “Send Calibration Signal” in the “System Setting Menu” to send the low signal. Ensure that the pressure, volume, phase, and magnitude are at 0 mm Hg, 0 µL, 0˚, and 0 µs respectively.
- Press “Enter” to send the high signal. Ensure that pressure, volume, phase, and magnitude are at 100 mm Hg, 150 µL, 20˚ and 5,000 µs respectively.
- Press “Enter” to return to the “System Setting Menu”.
- Press “6” to return to the “Catheter Menu”. Then press “Acquire Data”.
- Bend a 30 G needle to approximately 90˚ (Figure 1B,C). This bent needle will be used to puncture the jugular and carotid vessels.
2. Anesthesia and body temperature control
- Place the mouse (28 g, C57BL/6 in this protocol) into an anesthesia chamber containing anesthetic gas (i.e., oxygen 100%, isoflurane 3–4% for induction).
- When the animal is anesthetized, not responding to paw or tail pinch, place the mouse supine on the heating pad set at 37 ˚C.
- Connect the mouse to the respirator through a nose cone providing a mixture of 100% oxygen and 2% of isoflurane. To automatically calculate the recommended ventilation settings, enter the animal’s weight into the ventilator’s proprietary software using the touch screen. The calculations use the following formula:
Tidal volume = 6.2 x animal mass1.01 (kg),
Respiration rate = 53.5 x animal mass-0.26 (kg). - Turn on the anesthetic line from the anesthesia chamber to the nose cone.
- Insert the temperature feedback probe into the rectum, and the pad probe between the pad and the back of the mouse, setting the desired body temperature to 37 °C–37.5 °C. Control the animal’s temperature on the monitor screen (Figure 2A,B).
- Tape down the front paws and one distal paw of the mouse to the heating blanket using surgical tape, leaving one hind paw free to monitor the depth of anesthesia.
3. Surgical Site Access
- Perform a 2 cm H-shape ventral midline cervical incision from the manubrium to the level of the hyoid bone.
- Reflect the skin away from the underlying muscles. If needed, these muscles can be excised for better visualization.
- Gently move the submandibular gland aside.
- Dissect the cervical soft tissue and expose the sternocleidomastoid and the sternohyoid muscle with forceps using the blunt dissection method.
- Split the fascia in the middle, overlying the paired sternohyoid. Allow the paired sternohyoid to retract laterally to expose the trachea. Be careful to not damage the carotid arteries and the vagus nerves, which run alongside the trachea.
- Pass forceps underneath the trachea to elevate it. Then, pass a 4.0 surgical silk suture underneath the trachea and make a potential knot in the middle of the suture, which will later be tightened to secure the endotracheal tube (Figure 3A).
- Using scissors, make a small cut between the cartilage rings of the trachea below the level of the larynx. Insert the endotracheal tube (Figure 3B).
- Connect the tracheostomy tube to the respirator and begin ventilation with 100% oxygen and 2% isoflurane. Tighten the knot around the trachea to secure the endotracheal tube and tape the respirator tubing to the operative table. Ensure that the trachea is not obstructed or collapsed (Figure 3C).
4. Right jugular and right carotid isolation
- Right carotid isolation
- Using blunt dissection, displace the sternohyoid muscle laterally to expose and isolate the right carotid artery.
- Isolate the carotid artery from the vagus nerve by blunt dissection using forceps.
- Pass three surgical sutures (4.0) underneath the carotid artery, excluding the vagus nerve.
- Right jugular vein isolation
- Displace the submandibular and parotid gland laterally to visualize the right jugular vein. Bluntly dissect and expose the right jugular vein using forceps. Carefully dissect the vein and remove the surrounding fascia.
- Pass forceps underneath the jugular vein.
- Pass one surgical suture underneath the jugular vein, then tie it at the cranial side of the vein. Apply gentle traction on this suture in the direction of the head using a hemostatic clamp.
- Pass two additional sutures underneath the jugular vein. Gently pull the most distal suture in a caudal direction using a hemostatic clamp. Make a loose, potential knot in the middle suture.
- Put several drops of warmed, physiological saline on the vessel at the site of anticipated venotomy.
5. Surgical procedures for right ventricular and left ventricular catheterization
- Right ventricular catheterization (Figure 4 A–D).
- Using the stereomicroscope, identify the jugular vein.
- Gently apply superior traction on the vein. Perform a venotomy by inserting a 30 G curved needle between the cranial suture and the middle suture. Insert the needle at a 140˚ angle relative to the vein to ensure it enters in a coaxial manner.
- When inserted, dilate the venotomy by moving the needle. Insert the catheter tip in the venotomy, underneath the needle. Then gently tie the middle suture, securing the catheter.
NOTE: Take extreme care not to tie the suture too tightly, because excess force can damage the catheter. - Release the caudal suture, and advance the catheter into the right ventricle, detecting the classical right ventricular pressure waveform on a continuous monitor.
- Stabilize the right ventricular pressure. Ensure the correct positioning of the catheter in the right ventricle to generate an optimal PV loop.
- Stabilize the magnitude, which reflects the blood and muscle, to generate pressure-magnitude loops (i.e., Y axis pressure, X axis magnitude). If required, gently rotate the catheter shaft to achieve optimal placement of the catheter along the axis of the right ventricle.
NOTE: The maximal phase value, which reflects the muscle, should be below 7°.
- Stabilize the magnitude, which reflects the blood and muscle, to generate pressure-magnitude loops (i.e., Y axis pressure, X axis magnitude). If required, gently rotate the catheter shaft to achieve optimal placement of the catheter along the axis of the right ventricle.
- When the pressure-magnitude loop signal is optimal, press “Enter” on the console during the acquisition to perform a baseline scan. Ensure that the heart rate reported on the monitor screen in beats per minute (bpm) is in a physiologic range (i.e., 400–600 bpm).
- Generate the PV loops. Change “Magnitude” to “Volume” as a parameter for the X axis and keep the pressure as the Y axis. When the PV loops signal is optimal, record for 30 s.
- Stop the recording. Pull back the catheter and gently wipe with gauze. Put the catheter in heparin/sodium chloride solution and tie the caudal suture to stop bleeding from the jugular vein.
- Left ventricular catheterization (Figure 5 A–D).
- Gently elevate the right carotid, which was previously isolated (5A) by sliding curved forceps underneath the artery.
- Tie the previous suture, thereby occluding the artery. Then, gently apply cranially directed traction using a hemostatic clamp.
- Pull the most distal suture in a caudal direction using a hemostatic clamp. Make a loose potential knot on the middle suture.
- Put several drops of warmed, physiological saline on the vessel at the site of the anticipated arteriotomy. Focus on the cranial section, between the caudal and the middle suture, using the stereotaxic microscope.
- Gently apply superior traction on the artery. Perform an arteriotomy, by inserting a 30 G curved needle between the cranial suture and the middle suture. Insert the needle at 140˚ relative to the artery to ensure it enters in a coaxial manner.
- Insert the catheter tip into the arteriotomy and then tighten the middle suture to secure the catheter. Simultaneously, release the distal suture and advance the catheter into the aorta to start recording. Ensure that the pressure channel shows a typical aorta trace.
- Advance the catheter retrograde across the aortic valve into the left ventricle. Entry into the left ventricle will be evident from the sudden marked drop in diastolic pressure from the aorta.
- Stabilize the left ventricular pressure. Ensure the correct positioning of the catheter in the left ventricle to generate an optimal PV loop.
- Stabilize the magnitude, which reflects the blood and muscle, to generate pressure-magnitude loops (i.e., Y axis pressure, X axis magnitude). If required, gently rotate the catheter shaft to achieve optimal placement of the catheter along the axis of the left ventricle.
NOTE: The maximal phase value, which reflects the muscle, should be below 7°.
- Stabilize the magnitude, which reflects the blood and muscle, to generate pressure-magnitude loops (i.e., Y axis pressure, X axis magnitude). If required, gently rotate the catheter shaft to achieve optimal placement of the catheter along the axis of the left ventricle.
- Stop the recording. Pull back the catheter and put it in heparin/sodium chloride solution. Then tie the caudal suture.
- Clean the catheter with an enzymatic detergent (e.g., endozime).
NOTE: After the surgery, euthanize the animal according to the institution’s animal studies guidelines.
6. Data analysis
- Perform the PV loop analysis according to established recommendations.
- Select the optimal pressure-volume trace (ideally an entire, stable 30 s recording). On the software, click “Advance”, click “Loops”, and then click “Offline Calculation”.
- Select volume as a volume channel and pressure as pressure channel.
- For consistent results a minimum of 20 loops is necessary.
Results
The catheter was placed in a 10 mL syringe containing a solution of heparinized saline at room temperature 30 min before the catheterization (Figure 1A). A 30 G needle was bent ~90˚ (Figure 1B, C), and a 1.45 mm diameter tracheotomy canula was prepared (Figure 1C).
Maintenance of physiologic body temperature is critical. The mouse was taped down and connected to the respirator through a nose cone. The feedback probe was placed between the pad and the back of the mouse. A rectal probe was inserted to monitor the animal’s body temperature (Figure 2A). Body temperature (37.1 ˚C) and pad (40.7 ˚C) temperature were monitored (Figure 2B).
Photographs of the critical steps of the intubation procedure are displayed in Figure 3A–C. Successful and unobstructed intubation resulted in a regular respiratory rate with stable peak pressure (Figure 2B).
Pictures of the critical steps of right heart catheterization, from the isolation of the jugular vein (Figure 4A–C) to the insertion of the catheter in the jugular vein are shown in Figure 4D. Figure 5 shows the critical steps of left heart catheterization, including right carotid artery isolation (Figure 5 A,B) and catheter insertion (Figure 5 C,D)
The catheter was introduced into the jugular vein and advanced into the right ventricle. Then the right ventricular pressure was stabilized, and the correct positioning verified. All the catheter’s electrodes (6 mm long axis length) needed to be within the right ventricle chambers and not in contact with the ventricle walls. Optimal positioning of the catheter as schematically represented in Figure 6A generated optimal PV loops (i.e., triangular, regular). Improper positioning as schematically represented in Figure 6B (i.e., contact with the ventricular wall) will result in flawed PV loops (i.e., collapsed and irregular loops).
The catheter was introduced into the carotid, advanced into the aorta, then advanced retrograde across the aortic valve into the left ventricle. The left ventricular pressure was stabilized and right positioning verified. All the catheter’s electrodes (6 mm long axis length) should be within the left ventricle chambers and not in contact with the ventricle walls. Optimal positioning of the catheter as schematically represented in Figure 6C generated optimal PV loops (i.e., rectangular, regular). Improper positioning as schematically represented in Figure 6D (i.e., contact with the ventricular wall) resulted in flawed PV loops (i.e., collapsed, non-rectangular, and irregular loops).
Representative hemodynamics generated by left and right PV loops showed a heart rate of 410 bpm, cardiac output of 9,107 µL/min, and stroke volume of 24.5 µL. Specific right ventricular parameters showed a right ventricular systolic pressure of 21.9 mm Hg, right ventricular end diastolic pressure 1.049 mm Hg, ejection fraction of 56.1%, dp/dt max of 1,469 mm Hg/s, dp/dt max of -1,504 mm Hg/s, end diastolic volume of 38.4 µL, stroke work of 0.068 mJ, pressure-volume area of 0.089 mJ, pulmonary arterial elastance (Ea) of 0.83 mm Hg/µL, and Tau factor of 12.8 ms. Specific left ventricular parameters showed a left ventricular systolic pressure of 77.1 mm Hg, left ventricular end diastolic pressure of 2.33 mm Hg, ejection fraction of 59.1%, dp/dt max of 4,695 mm Hg/s, dp/dt max of -3,553 mm Hg/s, end diastolic volume of 36.9 µL, stroke work of 0.14 mJ, pressure-volume area of 0.22 mJ, arterial elastance (Ea) of 5.37 mm Hg/µL, and Tau factor of 15.1 ms (Table 1).
| Haemodynamic parameters | |
| HR (BPM) | 410.6 ± 23.3 |
| CO (μL/min) | 9107 ± 1016 |
| SV (μL) | 24.5 ± 2.3 |
| RV function | |
| RVSP (mmHg) | 21.9 ± 2.15 |
| RVEDP (mmHg) | 1.042 ± 0.12 |
| EF (%) | 56.1 ± 4.4 |
| dP/dt max (mmHg/s) | 1469 ± 170 |
| dP/dt max (- mmHg/s) | 1504 ± 215 |
| EDV (μL) | 38.4 ± 3.7 |
| SW (mJoules) | 0.068 ± 0.008 |
| PVA (mJoules) | 0.084 ± 0.009 |
| Ea (mmHg/μL) | 0.83 ± 0.09 |
| Tau factor (ms) | 12.8 ± 0.8 |
| LV function | |
| LVSP (mmHg) | 77.1 ± 2.4 |
| LVEDP (mmHg) | 2.33 ± 0.17 |
| EF (%) | 59.1 ± 3.6 |
| dP/dt max (mmHg/s) | 4695 ± 355 |
| dP/dt max (- mmHg/s) | 3553 ± 373 |
| EDV (μL) | 36.9 ± 4.8 |
| SW (mJoules) | 0.14 ± 0.013 |
| PVA (mJoules) | 0.22 ± 0.03 |
| Ea (mmHg/μL) | 5.37 ± 0.9 |
| Tau factor (ms) | 15.07 ± 1.7 |
| CO, cardiac output; Ea, arterial elastance; EDV, end diastolic volume; HR, heart rate; LVEDP, left ventricular end diastolic volume; LVSP, left ventricular systolic pressure; PVA, pressure volume area; RVEDP, right ventricular end diastolic pressure; RVSP, right ventricular systolic pressure; SV, stroke volume; SW, stroke work; Tau factor, Tau Mirsky. N= 6 mice. Values are expressed ± SEM | |
Table 1: Table of hemodynamic parameters. Left and right ventricular hemodynamic parameter measured in six mice.

Figure 1: Experimental preparation and setup. (A) Catheter in a 10 mL syringe of saline/heparin, (B), (C) 30 G needle bent to approximately 90°, (D) tracheotomy canula, 1.45 mm diameter. Please click here to view a larger version of this figure.
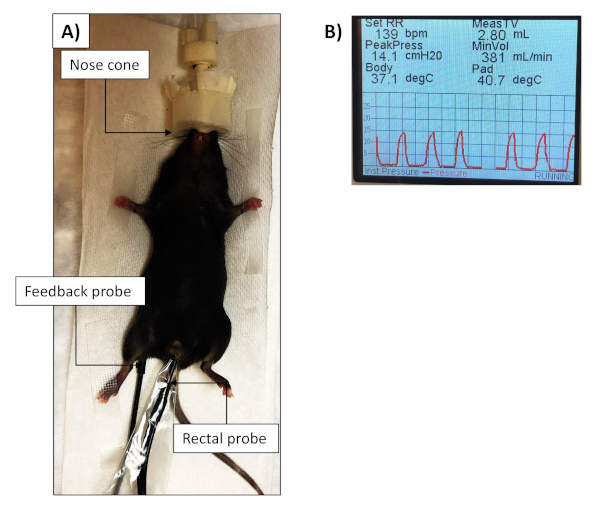
Figure 2: Anesthesia, body temperature control. (A) Mouse with three paws taped, connected to respirator through a nose cone, with feedback and rectal probes inserted. Note that the warming pad is below the surgical blanket. (B) Temperature monitor control showing body (rectal) and pad (feedback) temperature and the ventilation parameters: respiratory rate (set RR), mean tidal volume (Meas TV), peak pressure (PeakPress), and the minute ventilation (MinVol). Please click here to view a larger version of this figure.
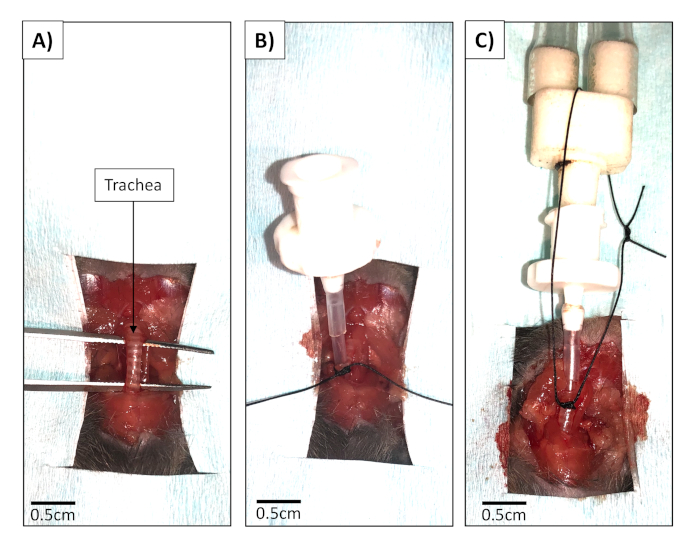
Figure 3: Intubation procedure. (A) The skin was pulled away and cut. The submandibular gland was gently moved aside. The sternocleidomastoid and the sternohyoid muscle were pulled apart and then forceps were passed underneath the trachea, using gentle, blunt dissection. (B) Surgical silk (4.0) was passed underneath the trachea and a small cut was made anteriorly between two cartilage rings of the trachea. The tracheostomy was inserted and tied. (C) The tracheostomy tube was connected to the ventilator, and the suture was tied around the tubing. Please click here to view a larger version of this figure.
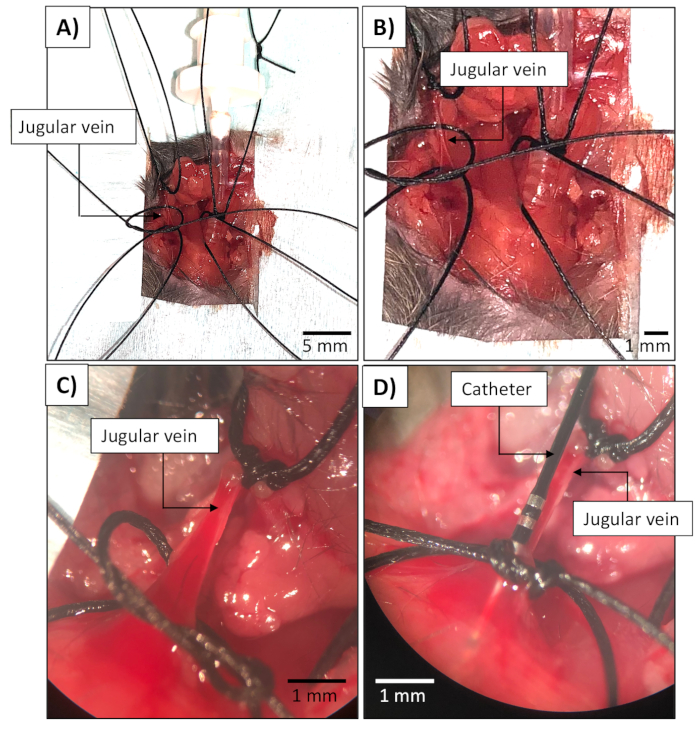
Figure 4: Right ventricular catheterization. (A), (B), (C) The right jugular vein was isolated, then one surgical suture was passed underneath and tied at the cranial side of the vein. Gentle traction was applied on this suture in the direction of the head using a hemostatic clamp. Two additional sutures were passed distally, underneath the jugular vein. The most distal suture was pulled gently in a caudal direction using a hemostatic clamp. A loose, potential knot was made in the middle suture. (D) The catheter was inserted in the jugular vein, the middle suture was tied to the catheter. The images in (C) and (D) are magnified through a stereomicroscope. Please click here to view a larger version of this figure.
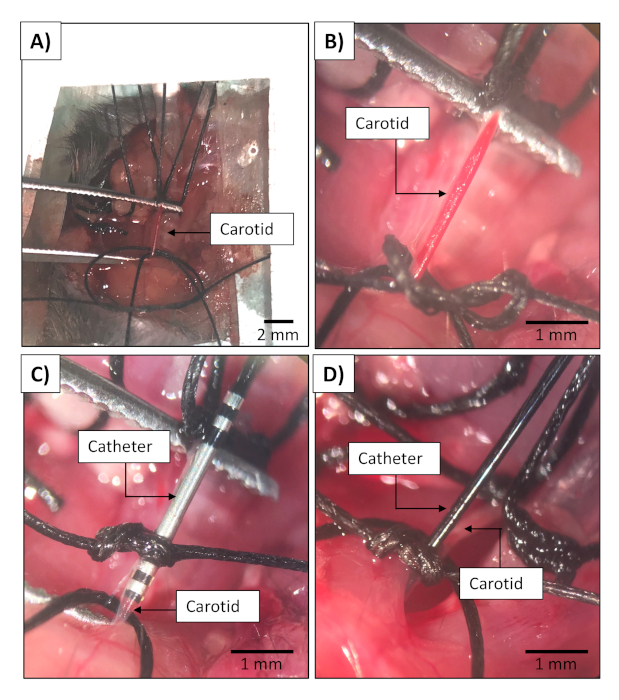
Figure 5: Left ventricular catheterization. (A), (B) The right carotid was isolated, then one surgical suture was passed underneath the jugular vein and tied at the cranial side of the vein. Gentle traction was applied on this suture in the direction of the head using a hemostatic clamp. Two additional sutures were passed underneath the carotid artery. The most distal suture was gently pulled in a caudal direction using a hemostatic clamp. A loose, potential knot in the middle suture was made. (C) The catheter tip was inserted into the carotid artery, and then the middle suture tied to the catheter to secure it. (D) The catheter was gently advanced retrograde down the carotid toward the aorta. The images in (B), (C), (D) are magnified through a stereomicroscope. Please click here to view a larger version of this figure.

Figure 6: Schematic representation of catheter positioning and resulting PV loops. (A) Optimal catheter positioning in the right ventricle. The tip of the catheter is in the middle of the ventricle, isolated from the ventricle walls. Representative PV loops resulting from an optimal catheter positioning in the right ventricle (i.e., stable, triangular). (B) Improper catheter positioning in the right ventricle. The tip of the catheter is in contact with the ventricular walls. Representative PV loops noise resulting from a suboptimal catheter positioning in the right ventricle (i.e., collapsed, irregular). (C) Optimal catheter positioning in the left ventricle. The tip of the catheter is in the middle of the ventricle, isolated from the ventricle walls. Representative PV loops resulting from optimal catheter positioning in the left ventricle (i.e., stable, rectangular). (D) Improper catheter positioning in the left ventricle. The tip of the catheter is in contact with the ventricular walls. Representative PV loops resulting from a suboptimal catheter positioning in the left ventricle (i.e., collapsed, irregular). A 50 Hz FIR noise filter was applied to generate the PV loops. Please click here to view a larger version of this figure.
Discussion
Assessment of cardiac function is a critical step for preclinical cardiovascular and pulmonary-vascular research. In this work, we proposed a protocol for a closed chest biventricular assessment of cardiac function in mice. Through this approach, one can generate the right ventricle and left ventricle PV loops in the same mouse. This approach provides a robust and complete assessment of cardiac function, allowing measurement of systolic and diastolic function, as well as stroke volume and cardiac output. Unlike the open chest approach classically used for rodent catheterization, this closed chest technique results in more stable physiology and more physiologically relevant data. While technically more challenging and dependent on operator skills to successfully position the catheter in the right and left ventricle, the closed chest approach limits the trauma and hemorrhage associated with open chest surgery and reduces the drastic pressure changes associated with exposing the lungs to atmospheric pressure. The closed chest approach also better emulates the cardiac catheterization procedure performed in patients, which enhances the relevance of using this technique in preclinical research.
The surgical procedure is the critical step of the protocol. Even when using a surgical microscope for catheter insertion in the jugular vein or carotid artery, which is recommended, this procedure requires practice and technical skill. Careful dissection of the vessels free from surrounding fascia by means of gentle, blunt dissection will increase the success of cannulation while minimizing the risk of hemorrhage. To minimize blood loss, it is crucial to cannulate the carotid in sequential steps: 1) introduce the catheter tip in the carotid artery; 2) gently tie the suture around the portion of the artery that contains the catheter; 3) release the secure suture, allowing catheter movement while maintaining gentle upward traction to minimize bleeding; and 4) advance the catheter to the aorta. Positioning the catheter in the ventricle, as determined by real-time waveform monitoring, is the most challenging part of this protocol. All the catheter's electrodes should be within the ventricular cavity and none should be touching the wall. Any improper positioning of the catheter will result in irregular PV loops and will adversely affect or preclude data acquisition. Recognizing the characteristic pressure-volume waveform that results from having all electrodes within the ventricle allows one to be confident of an appropriate catheter position. It is critical to obtain a stable ventricular pressure waveform and stable pressure-magnitude loops before shifting to the PV mode and volume acquisition. Proper knowledge of cardiac physiology and anatomy is essential for the success of this procedure. Online reading of the PV traces, from the atrium, the tricuspid valve area, and right ventricle, will show the advancing of the catheter and help achieve proper positioning. It is critical to know the normal heart rate (400–600 bpm), and waveforms and pressures expected (e.g., right ventricular systolic pressure, 18–25 mm Hg, diastolic pressure <5 mm Hg; left ventricular systolic pressure 60–120 mm Hg40, diastolic pressure <8 mmHg) in mice to allow the operator to evaluate the veracity of the observed data.
The quality and reproducibility of the data will depend on the speed of the procedure and blood loss or hemorrhage. The procedure from anesthesia to completion of data acquisition takes on average ~30–40 min/mouse. Right heart catheterization from the insertion of the catheter to data acquisition takes 5–10 min, left heart catheterization from the insertion of the catheter to the data acquisition takes another 10–15 min. Publication-quality data is obtained in ~75% of cases. The sequence of steps in the cardiac catheterization should be kept constant between the animals. In this procedure, the mice are intubated first, followed by the right ventricular catheterization, and finally the left ventricular catheterization. The decision to proceed in this order is based on the greater difficulty and bleeding risk of left heart versus right heart catheterization. A nonspecific 50 Hz noise recording artifact can be observed. This noise could be diminished using an FIR filter with a high cutoff at 50 Hz and a low cutoff of 0 on the software. For the volume channel create a new channel/filter/FIR filter. A notch filter of 50 Hz could also be applied during data acquisition to eliminate mains noise and remove any radiofrequency interference.
The faster the catheterization is done, the better the quality of the data. Based on previous experience, it is recommended to acquire the data within 15 min. Increased catheterization time increases the physiologic stress on the animal and increases the risk of arrhythmia due to the presence of the catheter in the cavity. These forces can reduce stroke volume and impair the reproducibility and interpretability of the waveforms. In addition, the tip of the catheter is sharp and can damage or puncture the ventricle. This is particularly important for the right ventricle, which is ~ 1/3rd the thickness of the left ventricle.
Invasive tracheostomy and positive pressure mechanical ventilation result in stable and controlled breathing of the mice and decrease the variability of the PV loops acquisition. However, positive end expiratory pressure (PEEP) is a marked contrast to normal ventilation, which is a negative pressure phenomenon. Together, positive pressure ventilation and PEEP lower cardiac output and reduce right heart pressure. Thus, while required for acquisition of stable data, mechanical ventilation as well as cardiodepressive effects of the anesthesia will affect the PV loops and should be considered as a limitation. Transiently stopping mechanical ventilation during the brief recording of PV loops is used to eliminate this potential source of artifacts. Note that ventilation efficiency can be confirmed by the capnography monitoring of carbon dioxide.
The technical skills required for the closed-chest approach may be a limitation of this technique. Likewise, it is challenging to obtain proper, stable positioning of the catheter in the ventricle. The odds of success increase with operator experience and with the size and weight of the mice. Catheterization of mice below 20 g is extremely challenging. The unique chamber geometry of the right ventricle might affect volume measurement and should be considered. The anesthetic used, heart rates, temperatures, and animal strain could affect the hemodynamic parameters and should be carefully reported and monitored.
In conclusion, in this protocol both right and left ventricular catheterization are performed in the same mouse. Depending on a scientist’s specific aims, left or right ventricular catheterization can be performed independently, using the relevant portion of the biventricular procedure. However, the approach presented is optimal for complete assessment of cardiac function.
Acknowledgements
The authors would like to acknowledge the help and collaboration of Queen’s University animal facility personal. The authors would like to acknowledge the help of Austin Read, TMED MSc candidate.
This study was supported in part by U.S. National Institutes of Health (NIH) grants NIH 1R01HL113003-01A1 (S.L.A.), NIH 2R01HL071115-06A1 (S.L.A), Canada Foundation for Innovation and the Queen’s Cardiopulmonary Unit (QCPU) 229252 and 33012 (S.L.A.), Tier 1 Canada Research Chair in Mitochondrial Dynamics and Translational Medicine 950-229252 (S.L.A.), Canadian Institutes of Health Research (CIHR) Foundation Grant CIHR FDN 143261, the William J. Henderson Foundation (S.L.A.), Canadian Vascular Network Scholar Award (F.P.), and the Paroian Family scholarship from the pulmonary hypertension association of Canada (F.P.)
Materials
| Name | Company | Catalog Number | Comments |
|---|---|---|---|
| ADVantage Pressure-Volume System (ADV500) | Transonic | FY097B | |
| Endozime AW triple plus | Ruhof | 34521 | |
| Fiber optic dual Gooseneck | Volpi Intralux | # 6000-1 | |
| Forceps | F.S.T | 11052-10 | |
| Forceps | F.S.T | 11251-20 | |
| Gauze sponges | Dermacea | 441400 | |
| Hemostatic clamp | F.S.T | 13003-10 | |
| Hemostatic clamp | F.S.T | 13018-14 | |
| Heparin sodium | Sandoz | 023-3086 | 100 U/L |
| High-fidelity admittance catheter | Scisence; Transonic | FTH-1212B-3518 | |
| Isofluorane | Baxter | CA2L9108 | |
| labScribe v4 software | iworx | LS-30PVL | |
| Needle (30 gauge) | BD | 305106 | |
| sodium chloride injection | Baxter | JB1309M | 0.9%(wt/vol) |
| Stereo microscope | Cole-Parmer | OF-48920-10 | |
| Surgical suture | SERAFLEX | ID158000 | black braided silk, 4.0 |
| Surgical tape | 3M, Transpore | SN770 | |
| Tabletop Single Animal Anesthesia Systems | Harvard apparatus | 72-6468 | |
| Tracheotomy canula 1.45 mm diameter | Harvard apparatus | 72-1410 | |
| Ventilator, far infrared warming pad for mice and rats PhysioSuite | Kent scientific corporation | # PS-02 |
References
- Nowbar, A. N., Howard, J. P., Finegold, J. A., Asaria, P., Francis, D. P. 2014 Global geographic analysis of mortality from ischaemic heart disease by country, age and income: Statistics from World Health Organisation and United Nations. International Journal of Cardiology. 174 (2), 293-298 (2014).
- Nowbar, A. N., Gitto, M., Howard, J. P., Francis, D. P., Al-Lamee, R. Mortality From Ischemic Heart Disease. Circulation. Cardiovascular quality and outcomes. 12 (6), 005375(2019).
- Finegold, J. A., Asaria, P., Francis, D. P. Mortality from ischaemic heart disease by country, region, and age: Statistics from World Health Organisation and United Nations. International Journal of Cardiology. 168 (2), 934-945 (2013).
- McClellan, M., Brown, N., Califf, R. M., Warner, J. J. Call to Action: Urgent Challenges in Cardiovascular Disease: A Presidential Advisory From the American Heart Association. Circulation. 139 (9), 44-54 (2019).
- Clark, J. E., Marber, M. S. Advancements in pressure-volume catheter technology - stress remodelling after infarction. Experimental Physiology. 98 (3), 614-621 (2013).
- Price, L. C., Wort, S. J., Finney, S. J., Marino, P. S., Brett, S. J. Pulmonary vascular and right ventricular dysfunction in adult critical care: current and emerging options for management: a systematic literature review. Critical Care. 14 (5), London, England. 169(2010).
- Ryan, J. J., et al. Right Ventricular Adaptation and Failure in Pulmonary Arterial Hypertension. The Canadian Journal of Cardiology. 31 (4), 391-406 (2015).
- Cooper, L. B., et al. Hemodynamic Predictors of Heart Failure Morbidity and Mortality: Fluid or Flow. Journal of cardiac failure. 22 (3), 182-189 (2016).
- Turina, J., Stark, T., Seifert, B., Turina, M. Predictors of the long-term outcome after combined aortic and mitral valve surgery. Circulation. 100 (19), Suppl 48-53 (1999).
- Vonk Noordegraaf, A., Galiè, N. The role of the right ventricle in pulmonary arterial hypertension. European Respiratory Review : An Official Journal of the European Respiratory Society. 20 (122), 243-253 (2011).
- Vonk-Noordegraaf, A., et al. Right heart adaptation to pulmonary arterial hypertension: physiology and pathobiology. Journal of the American College of Cardiology. 62 (25), Suppl 22-33 (2013).
- Potus, F., et al. Downregulation of miR-126 Contributes to the Failing Right Ventricle in Pulmonary Arterial Hypertension. Circulation. 132 (10), 932-943 (2015).
- Potus, F., Hindmarch, C., Dunham-Snary, K., Stafford, J., Archer, S. Transcriptomic Signature of Right Ventricular Failure in Experimental Pulmonary Arterial Hypertension: Deep Sequencing Demonstrates Mitochondrial, Fibrotic, Inflammatory and Angiogenic Abnormalities. International Journal of Molecular Sciences. 19 (9), 2730(2018).
- Xiong, P. Y., et al. Biventricular Increases in Mitochondrial Fission Mediator (MiD51) and Proglycolytic Pyruvate Kinase (PKM2) Isoform in Experimental Group 2 Pulmonary Hypertension-Novel Mitochondrial Abnormalities. Frontiers in Cardiovascular Medicine. 5, 195(2019).
- Schwarz, K., Singh, S., Dawson, D., Frenneaux, M. P. Right Ventricular Function in Left Ventricular Disease: Pathophysiology and Implications. Heart, Lung and Circulation. 22 (7), 507-511 (2013).
- Buckberg, G., Hoffman, J. I. E. Right ventricular architecture responsible for mechanical performance: Unifying role of ventricular septum. The Journal of Thoracic and Cardiovascular Surgery. 148 (6), 3166-3171 (2014).
- Buckberg, G. D. The ventricular septum: the lion of right ventricular function, and its impact on right ventricular restoration. European Journal of Cardio-Thoracic Surgery. 29, Supplement_1 272-278 (2006).
- Farrar, D. J., Chow, E., Brown, C. D. Isolated Systolic and Diastolic Ventricular Interactions in Pacing-Induced Dilated Cardiomyopathy and Effects of Volume Loading and Pericardium. Circulation. 92 (5), 1284-1290 (1995).
- Dickstein, M. L., Todaka, K., Burkhoff, D. Left-to-right systolic and diastolic ventricular interactions are dependent on right ventricular volume. The American Journal of Physiology. 272 (6), Pt 2 2869-2874 (1997).
- Slater, J. P., et al. Systolic ventricular interaction in normal and diseased explanted human hearts. The Journal of Thoracic and Cardiovascular Surgery. 113 (6), 1091-1099 (1997).
- Rosenkranz, S., et al. Pulmonary hypertension due to left heart disease: Updated Recommendations of the Cologne Consensus Conference 2011. International Journal of Cardiology. 154, 34-44 (2011).
- Ranchoux, B., et al. Metabolic Syndrome Exacerbates Pulmonary Hypertension due to Left Heart Disease. Circulation Research. 125 (4), 449-466 (2019).
- Habib, G., Torbicki, A. The role of echocardiography in the diagnosis and management of patients with pulmonary hypertension. European Respiratory Review : An official Journal of the European Respiratory Society. 19 (118), 288-299 (2010).
- Brierre, G., et al. New echocardiographic prognostic factors for mortality in pulmonary arterial hypertension. European Journal of Echocardiography. 11 (6), 516-522 (2010).
- Badano, L. P., et al. Right ventricle in pulmonary arterial hypertension: haemodynamics, structural changes, imaging, and proposal of a study protocol aimed to assess remodelling and treatment effects. European Journal of Echocardiography: the Journal of the Working Group on Echocardiography of the European Society of Cardiology. 11 (1), 27-37 (2010).
- Ibrahim, E. -S. H., Bajwa, A. A. Severe Pulmonary Arterial Hypertension: Comprehensive Evaluation by Magnetic Resonance Imaging. Case Reports in Radiology. 2015, 946920(2015).
- Pinsky, M. R. The right ventricle: interaction with the pulmonary circulation. Critical Care. 20 (1), London, England. 266(2016).
- Kosova, E., Ricciardi, M. Cardiac Catheterization. JAMA. 317 (22), 2344(2017).
- Lindqvist, P., Calcutteea, A., Henein, M. Echocardiography in the assessment of right heart function. European Journal of Echocardiography. 9 (2), 225-234 (2007).
- Fogel, M. A. Assessment of Cardiac Function by Magnetic Resonance Imaging. Pediatric Cardiology. 21 (1), 59-69 (2000).
- Janardhanan, R., Kramer, C. M. Imaging in hypertensive heart disease. Expert Review of Cardiovascular Therapy. 9 (2), 199-209 (2011).
- Attili, A. K., Schuster, A., Nagel, E., Reiber, J. H. C., vander Geest, R. J. Quantification in cardiac MRI: advances in image acquisition and processing. The International Journal of Cardiovascular Imaging. 26 (1), 27-40 (2010).
- Urboniene, D., Haber, I., Fang, Y. -H., Thenappan, T., Archer, S. L. Validation of high-resolution echocardiography and magnetic resonance imaging vs. high-fidelity catheterization in experimental pulmonary hypertension. American Journal of Physiology-Lung Cellular and Molecular Physiology. 299 (3), 401-412 (2010).
- Ashton, J. R., et al. Anatomical and functional imaging of myocardial infarction in mice using micro-CT and eXIA 160 contrast agent. Contrast Media & Molecular Imaging. 9 (2), 161(2014).
- Larson, E. R., Feldman, M. D., Valvano, J. W., Pearce, J. A. Analysis of the Spatial Sensitivity of Conductance/Admittance Catheter Ventricular Volume Estimation. IEEE Transactions on Biomedical Engineering. 60 (8), 2316-2324 (2013).
- Sasayama, S., et al. Assessment of cardiac function by left heart catheterization: an analysis of left ventricular pressure-volume (length) loops. Journal of Cardiography. Supplement. (1), 25-34 (1984).
- Lindsey, M. L., Kassiri, Z., Virag, J. A. I., de Castro Brás, L. E., Scherrer-Crosbie, M. Guidelines for measuring cardiac physiology in mice. American Journal of Physiology-Heart and Circulatory Physiology. 314 (4), 733-752 (2018).
- Townsend, D. Measuring Pressure Volume Loops in the Mouse. Journal of Visualized Experiments JoVE. (111), e53810(2016).
- Provencher, S., et al. Standards and Methodological Rigor in Pulmonary Arterial Hypertension Preclinical and Translational Research. Circulation Research. 122 (7), 1021-1032 (2018).
- Lips, D. J., et al. Left Ventricular Pressure-Volume Measurements in Mice: Comparison of Closed-Chest Versus Open-Chest Approach. Basic Res Cardiol. 99 (5), 351-359 (2004).
Reprints and Permissions
