The following protocol describes the development and optimization of a high-throughput workflow for worm culturing, fluorescence imaging, and automated image processing to quantify polyglutamine aggregates as an assessment of changes in proteostasis.
Method Article
Automating Aggregate Quantification in Caenorhabditis elegans
In This Article
Summary
Abstract
A rise in the prevalence of neurodegenerative protein conformational diseases (PCDs) has fostered a great interest in this subject over the years. This increased attention has called for the diversification and improvement of animal models capable of reproducing disease phenotypes observed in humans with PCDs. Though murine models have proven invaluable, they are expensive and are associated with laborious, low-throughput methods. Use of the Caenorhabditis elegans nematode model to study PCDs has been justified by its relative ease of maintenance, low cost, and rapid generation time, which allow for high-throughput applications. Additionally, high conservation between the C. elegans and human genomes makes this model an invaluable discovery tool. Nematodes that express fluorescently tagged tissue-specific polyglutamine (polyQ) tracts exhibit age- and polyQ length-dependent aggregation characterized by fluorescent foci. Such reporters are often employed as proxies to monitor changes in proteostasis across tissues. Manual aggregate quantification is time-consuming, limiting experimental throughput. Furthermore, manual foci quantification can introduce bias, as aggregate identification can be highly subjective. Herein, a protocol consisting of worm culturing, image acquisition, and data processing was standardized to support high-throughput aggregate quantification using C. elegans that express intestine-specific polyQ. By implementing a C. elegans-based image processing pipeline using CellProfiler, an image analysis software, this method has been optimized to separate and identify individual worms and enumerate their respective aggregates. Though the concept of automation is not entirely unique, the need to standardize such procedures for reproducibility, elimination of bias from manual counting, and increase throughput is high. It is anticipated that these methods can drastically simplify the screening process of large bacterial, genomic, or drug libraries using the C. elegans model.
Introduction
Age-dependent neurodegenerative protein conformational diseases (PCDs) such as Alzheimer's, Parkinson's, and Huntington's diseases, or amyotrophic lateral sclerosis, are characterized by protein misfolding that leads to aggregation, cell death, and tissue degeneration1. While protein misfolding is recognized as the culprit, the etiology of these diseases is not clear. As such, the development of effective therapies has been hindered by the lack of knowledge regarding the factors and conditions that contribute to disease onset and progression. Recent studies suggest that changes in the microbiome influence the onset, progression, and severity of PCDs2,3,4. However, the complexity of the human, or even murine, microbiome makes it difficult to conduct studies that would reveal the exact influence of microbes on their host. Therefore, simpler organisms, such as Caenorhabditis elegans, are often used as a discovery tool5,6,7,8. Recent studies have employed C. elegans to investigate the effect of bacteria on host proteostasis and disease pathogenesis9,10. Bacterial colonization, hormesis, and genomic changes are among exemplar conditions that affect the aggregation of polyglutamine (polyQ) tracts9,11,12. Additionally, these misfolded protein clusters exhibit polyQ length- and age-dependent accumulation within the host and are associated with impaired motility9,13. The relatively simple approach of quantifying fluorescently labeled puncta can generate important data on conditions, factors, or drugs that affect protein folding and aggregation.
Though quantification of fluorescent puncta has proven to be a reliable and relatively simple procedure, the challenge remains to develop a protocol that would facilitate large-scale screening of compounds, bacteria, or conditions that affect protein aggregation. The concept of automated C. elegans image processing and puncta quantification is not entirely novel, as a number of practical support tools have been developed14,15. However, the integration of culturing, image acquisition, and a processing pipeline are essential in eliminating variability in results and allowing for higher-throughput screens.
As such, the intent of this manuscript is to standardize the procedure used to quantify polyQ aggregation in C. elegans as a proxy to detect changes in proteostasis. This task was accomplished by employing CellProfiler, an open-source image analysis software16 capable of automated worm and aggregate identification, and is integrated into a larger protocol for culturing worms, acquiring images, and processing data.
Protocol
All procedures followed the safety guidelines that were reviewed and approved by the Institutional Biosafety Committee of the University of Florida. Appropriate biosafety measures were taken to mitigate the risk of exposure to Biological Safety Level-2 bacteria.
NOTE: For all experiments, C. elegans must be propagated and maintained on nematode growth media (NGM) plates seeded with Escherichia coli OP50.
1. Preparation of 10 cm NGM plates
- Combine 3 g of NaCl, 2.5 g of trypticase-peptone, and 17 g of agar into a 2 L flask, and fill to 1 L with double distilled water (ddH2O). Add magnetic stir bar prior to autoclaving.
- Autoclave the mixture for 45 min at 121 °C and a pressure of 21 psi. Let the mixture cool to 50 °C in a water bath.
- Using aseptic techniques, add the following sterile solutions: 1 mL of 1 M CaCl2·2H2O, 1 mL of 1 M MgSO4·7H2O, 1 mL of 5 mg/mL cholesterol dissolved in 100% ethanol (warmed to room temperature), and 25 mL of 1 M KH2PO4 (pH = 6.0). Mix using a magnetic stir plate. Mixing may be performed for 1 min at 700 RPM.
- Pour until the mixture fills the entire 10 cm plate. Alternatively, use a graduated serological pipette to add approximately 20 mL of mixture per plate.
- Allow the plates to dry for 24 h at room temperature prior to seeding with bacteria or store the plain plates at 4 °C after drying.
NOTE: All media components are handled using aseptic techniques. Steps 1.3-1.4 should be performed in a laminar flow hood.
2. Preparation of NGM agar with FUDR in 24-well plates
- Follow steps 1.1-1.3.
- Supplement NGM with 5-Fluoro-2′-deoxyuridine (FUDR) and mix to achieve a final concentration of 100 µg/mL.
NOTE: FUDR inhibits DNA replication and, as a result, blocks C. elegans reproduction by targeting germline and embryogenesis, ultimately affecting lifespan. Therefore, it is important to allow worms to fully develop into young adults before transferring onto FUDR-containing plates.
CAUTION: FUDR is toxic and should be handled according to the manufacturer's Safety Data Sheet. - Using a pipette gun, dispense 1 mL of NGM-FUDR into each well.
NOTE: This process can be facilitated by the use of an automated plate pouring system. - Let the plate dry for 24 h at room temperature prior to seeding with bacteria or storing plain plates at 4 °C.
3. Seeding of plates: OP50 and additional test bacteria
- To prepare an overnight E. coli OP50 culture, add 200 µL of a bacterial aliquot from a frozen stock into a 500 mL Erlenmeyer flask containing 250 mL of fresh, sterile Luria broth (LB).
NOTE: The volume of the media depends on the number of plates that need to be seeded. To prepare other bacterial cultures, inoculate a 16-mL culture tube containing 5 mL of growth medium with bacteria from frozen stock using a sterile micropipette tip. - Incubate overnight in a 37 °C incubator, shaking at 220 RPM (rotations per minute).
NOTE: Use sterilized flasks with at least twice the working volume of media and seal with autoclaved aluminum foil. Perform the inoculation step and bacterial dispensing using aseptic techniques. - Dispense 1-2 mL of the overnight E. coli OP50 culture onto the center of each 10 cm NGM plate. This culture does not need to be spread around the NGM plate.
- Allow the plates to dry at room temperature prior to use/storage.
NOTE: Seeded plates with lids on can be placed in a hood with airflow to facilitate drying.
4. Culturing and seeding of plates: 24-well plates
- Prepare an overnight culture of desired bacterial strains, adhering to culturing instructions found in steps 3.1-3.2.
- Transfer 200 µL of each bacterial culture into each well of a 24-well plate containing NGM agar. A 200 µL volume of bacteria will cover the entire agar area, maximizing the amount of food to ensure that worms will not avoid the bacterial lawn.
- Leave the plates cracked open in a biological safety cabinet (BSC) to facilitate drying. Check the plates periodically to prevent excessive dehydration and change plate orientation to promote even airflow and drying. The plates should dry within 5 h.
NOTE: Any work with Biological Safety Level-2 bacteria must be performed in certified BSCs and approved by the Institutional Biosafety Committee.
5. Age synchronization
NOTE: All steps should be performed using proper aseptic techniques (i.e., working close to a flame or inside a BSC).
- Wash gravid hermaphrodites off 10 cm OP50 plates using filter-sterilized M9 solution (5.8 g of Na2HPO4·7H2O, 3.0 g of KH2PO4, 5 g of NaCl, 0.25 g of MgSO4·7H2O, in 1 L of ddH2O).
- Pipette M9 solution onto the plate several times using a sterile glass or plastic serological pipet to lift worms from the bacterial lawn.
- Collect the worm suspension and transfer the solution into a 15 mL polystyrene conical tube.
- Centrifuge at 270 x g, room temperature (RT, ~23 °C), for 2 min.
- Aspirate using a vacuum trap flask and discard the supernatant, leaving the worm pellet undisturbed.
- Resuspend the pellet in 5-10 mL of M9 to wash the worms and repeat steps 5.2-5.3 twice.
- Add 5 mL of 20% bleaching solution (8.25 mL of ddH2O, 3.75 mL of 1M NaOH, 3.0 mL of non-germicidal bleach) to the tube and invert continuously to dissolve the worms. Worms are ready to centrifuge once they have almost completely dissolved.
NOTE: Bleaching times and volume of bleaching solution will depend on the size of the sample. Over and under-bleaching are common errors. As such, this process generally requires optimization to determine when the sample is ready for centrifugation. - Centrifuge for 2 min at 423 x g and discard the supernatant.
- Add 10 mL of sterile M9 to resuspend the egg pellet.
- Centrifuge the tube for 2 min at 423 x g to pellet the eggs. Remove the supernatant with an aspirator flask.
- Repeat steps 5.6-5.6.1.
- Resuspend the egg pellet in 5 mL of sterile M9 and place it on a nutator overnight at the desired temperature.
NOTE: Age-synchronized L1 larvae will be ready to transfer to plates the following day.
6. Worm preparation post age-synchronization
- Centrifuge the age-synchronized worms at 270 x g for 3 min at RT (~23 °C).
- Aspirate the supernatant in a clean environment, such as a flow hood or next to a Bunsen burner. Leave approximately 200 µL of the supernatant and resuspend the worms.
- Using a micropipette, transfer the concentrated worm suspension to 10 cm NGM plates that have been previously seeded with OP50.
NOTE: Each plate can support 1,500 worms without running out of food; however, this concentration may require adjustment depending on the density of the bacterial lawn and growth temperature. It is recommended to use multiple plates to prevent worms from starving. It is important to note that these plates must not contain FUDR. - Allow the plates to dry; then invert and store at 25 °C for 48 h.
NOTE: Depending on the condition of the screen, worms from step 6.1 can be placed directly onto test plates (containing bacteria, drugs, or test compounds). If the desired test condition affects development, worms should be cultured on NGM containing OP50 until young adults (~48 h) before exposing them to test conditions. - Following the 48 h incubation, wash the worms from the plates with sterile M9 solution and place them into conical tubes.
NOTE: Adult worms will sink to the bottom of the tube. The exact time will vary according to the number of worms recovered from 10 cm plates. Under these conditions, the worms settle down within 10 min. - Perform visual inspection to determine the duration of the settling time such that any residual eggs or hatched larvae are removed.
- Add an additional 10 mL of M9 to rinse the residual bacteria from worm bodies.
- Centrifuge the worms for 2-3 min at 270 x g at 23 °C.
- Perform the washing step an additional 3 times. For best results, leave about 1-1.5 mL of M9 solution in the tube after the final wash.
- Transfer 10 µL of the worm suspension onto a glass slide and count the number of worms.
- Adjust the worm density to approximately 150 worms per 10 µL of M9. The concentration of worms in suspension can be adjusted by either removing or adding M9 solution after centrifugation.
- Confirm that the desired concentration has been established by averaging counts from several different drops. It is recommended to average counts from at least three drops.
- Using aseptic techniques, transfer 10 µL of the worm suspension containing approximately 150 worms into each well of the test plate.
- Inspect the wells under a microscope to ensure that each has a sufficient number of worms. Additional worms can be added prior to incubation.
- Allow the plates to dry for approximately 10 min; and then invert and transfer to a 25 °C incubator for 72 h.
NOTE: The final incubation period can be adjusted to accommodate the needs of the experiment. The 72 h incubation time is sufficient to support the growth of 150 animals feeding on 200 µL bacteria in a 24-well plate at 25 °C.
7. Preparing worms for imaging
- To facilitate more effective settling and minimize sample loss, immobilize the worms prior to washing to prevent swimming.
NOTE: If working with few samples, this can be achieved through exposure to levamisole (100 µM). However, if working with a large number of samples, worms can be immobilized by freezing. Additionally, extended freezing (18-24 h) will prevent the further development of polyQ aggregates during preparation.- Place multi-well plates at -20 °C for 15-20 min or until worms no longer move.
- Remove the samples from the freezer and let them sit for 5 min.
- Using a micropipette, add 1 mL of M9, chilled to 4 °C, to a well of interest, repeatedly press and depress the plunger 4-6 times to wash the worms in each well.
NOTE: Sometimes, worms can stick to micropipette tips. As such, different tips should be used between each well to prevent the mixing of worms. - Transfer the worm suspension to a microcentrifuge tube and allow the worms to sink to the bottom.
- Aspirate and discard the supernatant. Wash the sample a total of three times.
- After worms have settled to the bottom during the final wash, aspirate 500 µL of supernatant, leaving 500 µL to resuspend worms.
- Transfer the remaining worm suspension to a new flat-bottom 24-well plate and place it in a -20 °C freezer for 48 h.
NOTE: Freezing worms reduces background fluorescence and allows better visualization of aggregates.
8. Imaging
- Remove the plates from the freezer and let thaw, wipe away excess condensation, and remove the lid prior to imaging.
NOTE: The details of image capture will vary according to the equipment and software used. Protocols for this section should only serve as a guide, and modifications are to be expected. It is also required to capture images in the tiff file format. - During image capture, use the following microscope settings: Exposure time, 500 ms; 40x magnification with 0.63x camera adapter (25.2x), GFP intensity set to 100%.
NOTE: Various microscope configurations and systems could acquire images different from the ones provided in the results section. To achieve a more universal description of the images required, more objective details regarding images are provided. Aggregates must be between 1.0-10.0 pixels in diameter with a fluorescent intensity of 0.10-1.0 (arbitrary units, scale 0-1) to be properly identified by the CellProfiler. The fluorescent background for these aggregate images is generally below the 0.10 threshold. For brightfield images, worm intensity ranges from 0.7-1.0 with a background intensity of 0.1-0.2. The average length of worms in brightfield images ranges from 250 pixels to 350 pixels in length from head to tail. - Adjust transmitted light controls until the worms appear brightly illuminated in comparison to the dark background. Avoid overexposure; it will increase worm size.
- It may be necessary to alter the positions of worms within the well to prevent excessive clumping. Disperse clumped worms using a pipette tip.
- Set the channel to GFP to establish a focal plane for both images.
NOTE: It is essential that the focal plane be determined in the GFP channel. Any change in focus made while capturing brightfield images will result in the misalignment of aggregates and worms during image analysis. - Capture a brightfield image and immediately take its corresponding fluorescent image without disturbing the plate.
- Run test images through the pipeline to determine intensity and size values for objects in the image according to the "NOTE" after step 8.2.
NOTE: CellProfiler can provide all necessary information regarding the intensity and length of objects prior to analysis. - To assess images, first, download CellProfiler17. Open the software and drag and drop images of interest into the Images box.
- Click on the images in the file list to open them.
- In the top left corner of the screen are several icons; use them to measure the size of the objects or magnify a specific region. Select the magnifier glass to highlight a region of interest.
- Select the arrow icon to measure the length of both worms and aggregates.
- Hover over the desired object to determine its intensity value which can be seen on the bottom portion of the screen.
NOTE: Since all images are taken in grayscale, all red, blue, and green pixel values will be identical.
9. Image analysis
- To utilize the CellProfiler image analysis pipeline, name the image pairs properly. Use the following format: P1_A01_S1_C1, where P1 refers to the specific plate and its respective numeric designation; "A", refers to the row and "01" to the column; "S" refers to a specific image pair for a single well; "C" refers to the channel, where "1" is used to denote brightfield images and "2" for fluorescent images.
- Download CellProfiler (version 4.1.3 or higher) from the official website17.
- Download the pipeline (Supplemental File 1). Upload the pipeline (Pipeline) into CellProfiler by selecting File > Import > Pipeline from File.
NOTE: Modules 2 and 3 have been disabled as they have been deemed unnecessary. Their function can be restored if image analysis does not yield satisfactory separation and identification of worms; however, modification of the pipeline is required. - To incorporate these modules, select the boxes located to the left of each module. Rename the input binary image for the "UntangleWorms" module to the output image from the "convertobjectstoimage" module.
- An error message may appear during initial use related to Module 2. If this occurs, proceed with the analysis.
- Upload a training set used to identify worms to the "UntangleWorms" module. This training set can be found in Supplemental File 2.
- Select the UntangleWorms module to open its settings.
- Identify Training Set File name and select the upload file icon.
- Upload Supplemental File 2 (training set).
- Upload images by selecting the Images module in the top left corner. Drag and drop properly named images as described in step 9.1.
- Prior to analyzing images, select the desired output folder that will be used to store the results.
- Click on the Output Settings button located near the bottom left-hand corner of the program.
- Select the folder icon to the right of Default Output to choose the desired output location.
- Select the Analyze Images icon to begin image analysis.
- If the analysis takes too long to complete and is stuck processing a single image, it is likely due to issues from image acquisition. If this occurs, abort the run and proceed to identify the unprocessed image(s) by sorting through the output folder and noting which image names are not found.
NOTE: The images may require additional processing to remove large or intensely lit artifacts that cannot be processed by the pipeline. In some cases, such images may need to be excluded from the analysis. - Following complete analysis, the software will organize the results into an excel spreadsheet containing individual worms (column N) and their respective number of aggregates (column K).
NOTE: A successful run will produce an excel spreadsheet containing the number of aggregates per identified worm for each well. These data can be manipulated in a manner determined by the experimenter. - Download metadata organizer (Graphical User Interface) from Supplemental File 3 (Windows) or Supplemental File 4 (Mac) to conveniently organize data from the output CSV file from CellProfiler.
NOTE: This software does not have an official license and will not automatically be opened after downloading. - Follow steps 9.14-9.17 if using Windows OS 64-bit. The software will not work on Windows 32-bit. Follow steps 9.18-9.20 if using Mac OS. Steps 9.21-9.22 are the same for both operating systems.
- For Windows OS, locate the downloaded file and extract it to the desired location.
- Locate and open the extracted folder named gui_windowsOS_64x and launch the application by clicking on the "gui" application icon.
- A prompt may open requesting permission to run. Select More Info and then click Trust Anyway.
- The metadata organizer is ready to drag and drop CellProfiler output CSV files. Continue to Step 9.21.
- For Mac OS, locate the downloaded file and open gui_macOS_64x.zip. This step should automatically extract all files.
- Open the extracted folder found in "Downloads".
- Right-click on the "gui" application and select Open. A prompt will appear asking for permission to open due to the lack of an official license. Select Open and continue to step 9.21.
- Click on Upload Your Files Here or drag and drop the desired CellProfiler CSV files.
- Click the Organize button, which will bring the user to a new screen with a Download Files button. Click on the button and select the desired location to save the output file. The output file will appear as the original filename with "_organized" extension added to the filename.
Results
Described herein is a C. elegans workflow that includes culturing, image acquisition, and processing protocols that allow assessment of polyQ aggregation in the presence of various bacteria using a 24-well plate format as the culturing and imaging platform (Figure 1). This protocol can be adjusted to study the effect of bacteria, specific conditions, small molecules, drugs, or genomic manipulations on host proteostasis. The described method has been optimized using worms that constitutively express intestinal polyQ fused to a yellow fluorescent protein (vha6p::polyQ44::YFP); however, other models that report on proteostasis in muscle or neurons can also be used with further optimization. For example, preliminary experiments demonstrate the application of these methods in the quantification of protein aggregates in other tissues such as muscle polyQ (Supplemental Figure 1). However, modification to the pipeline will be required to properly adjust for aggregate size and brightness, as mentioned in section 8 NOTE.
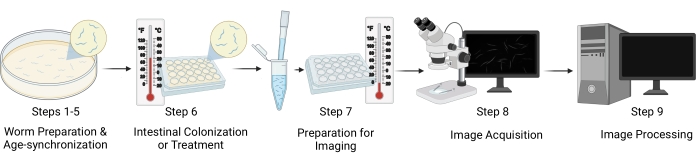
Figure 1: Workflow visual representation. The major steps of the protocol include five distinct stages: worm preparation and age-synchronization (steps 1-5), intestinal colonization/worm treatment (step 6), sample preparation for imaging (step 7), image acquisition (step 8), and image processing (step 9). The "Sections" of the protocol are referenced as "Steps" in the figure. Please click here to view a larger version of this figure.
The initial optimization experiments revealed various difficulties associated with overcrowding due to a large number of progenies, resulting in faster food depletion. The supplementation of FUDR in NGM plates described in section 2 solved this problem (Figure 2). Additionally, in the presence of FUDR, worms that were fed various bacteria had a more consistent body size, which allowed more uniform and accurate worm detection.
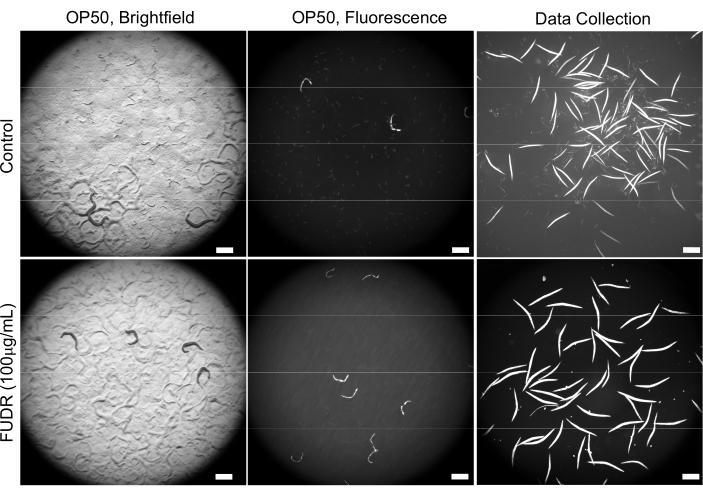
Figure 2: The use of FUDR improves image quality by reducing progeny. FUDR-supplemented plates eliminate C. elegans progeny compared to worms grown on non-FUDR control NGM plates seeded with E. coli OP50. Images were acquired at 25.2x magnification (40x magnification with a 0.63x camera adapter). Scale bars = 500 µm. Please click here to view a larger version of this figure.
Background fluorescence contributed to false positive detection of polyQ aggregates. To reduce such fluorescence signal in the intestinal tract and improve automated detection of aggregates, it was necessary to freeze worms prior to imaging. Freezing worms at -20 °C for 18-48 h significantly improved polyQ aggregate detection by eliminating background fluorescence (Figure 3A). The human eye is capable of differentiating between aggregates and background fluorescence; hence the manual counting before and after the freeze is the same (Figure 3B). However, automated counting is not as accurate, but freezing significantly improved automated counts with accuracy comparable to manual counting (Figure 3B).
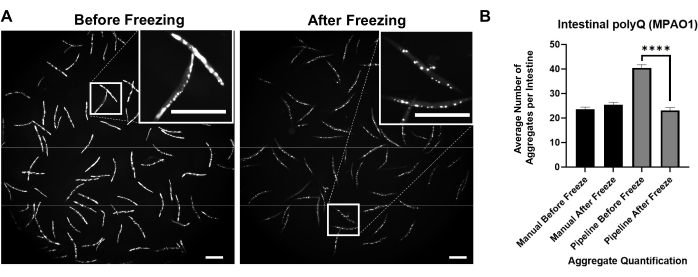
Figure 3: Freezing improves aggregate detection. (A) Fluorescent images of C. elegans expressing intestinal polyQ44::YFP before and after freezing. Inserts represent close-up images of the selected area. Scale bars = 500 µm. (B) Average number of aggregates per intestine in worms colonized with P. aeruginosa MPAO1 before and after freezing using manual or automated (pipeline) aggregate quantification. Data represent two biological replicates (n = 60-109). Statistical significance was calculated using Student's t-test (**** p < 0.0001). Error bars represent the standard error of the mean (SEM). Please click here to view a larger version of this figure.
Inverted brightfield illumination was used to detect the whole C. elegans (Figure 4A) and GFP channel to image polyQ44::YFP aggregates (Figure 4B). Worm detection, detangling, and aggregate quantification for each worm were done by applying an optimized CellProfiler image processing pipeline (Supplemental File 1), which allows obtaining the number of aggregates per individual worm (Figure 4C-D). To test the feasibility of this approach and the accuracy of the automated aggregate detection and quantification, worms expressing intestine-specific polyQ44::YFP were cultured and prepared for imaging according to the established protocols (sections 1-7). The number of aggregates per worm was assessed using either the automated pipeline (sections 8-9) or manual counting. Each experiment was performed in three independent trials using 90-571 worms per condition. While the average number of aggregates per intestine obtained with two trials had no significant difference, worms in the third trial had significantly fewer aggregates when quantified using the automated approach (Figure 5A). The average number of aggregates from the three trials resulted in slightly, but significantly fewer aggregates when the quantification was done using the CellProfiler pipeline (sections 8-9) (Figure 5B). Nonetheless, the difference between the two approaches was minimal, indicating that the automated method can be applied to large-scale screens.
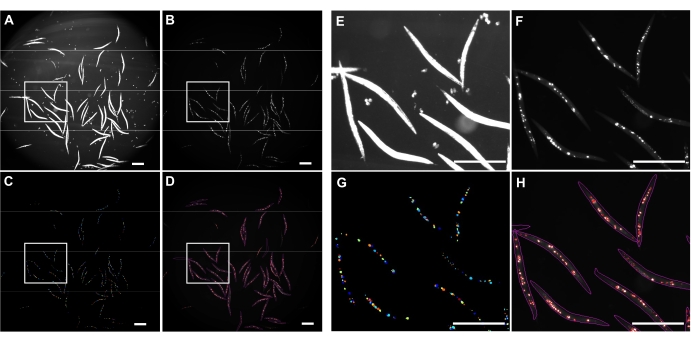
Figure 4: Aggregate detection using CellProfiler. (A) Brightfield image used to identify worm bodies. (B) Original fluorescent image acquired using GFP channel and used to identify and quantify a total number of intestinal polyQ44::YFP aggregates. (C) Aggregates identified using CellProfiler. (D) A total number of identified aggregates superimposed over the original fluorescent image with worm and aggregate outlines. Image capture and processing were performed using the settings described in sections 8-9. Panels E-H represent close-up images of the corresponding outlined regions in images A-D. Images were acquired at 25.2x magnification (40x magnification with a 0.63x camera adapter). Scale bars = 500 µm. Please click here to view a larger version of this figure.
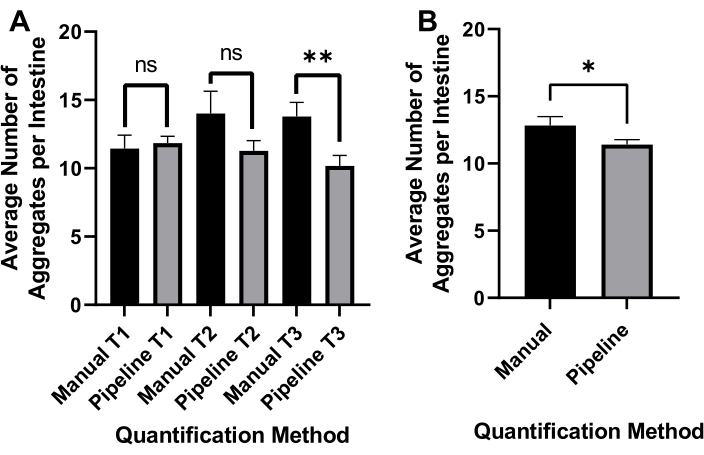
Figure 5: Efficacy of automated aggregate quantification. (A) Average aggregate number per intestine in worms colonized with control E. coli OP50 using manual counting (Manual) and automated CellProfiler-based quantification (Pipeline). Results represent data analyzed in three separate trials (T1-T3) (n = 90-571). (B) The average number of aggregates per intestine was obtained using manual or automated (Pipeline) aggregate quantification. Statistical significance was calculated using Student's t-test (* p < 0.05, ** p < 0.01). Error bars represent SEM. Please click here to view a larger version of this figure.
To evaluate the reproducibility of results among different experimenters, images from a plate containing six wells of worms that were fed either Pseudomonas aeruginosa MPAO1 or Escherichia coli OP50, were acquired by three individuals, two of whom had no prior experience imaging worms using these protocols. Images collected from each well contained anywhere between 30-115 detected worms. A non-significant difference in aggregation was detected in worms from the same wells that were imaged by the three experimenters. While the average number of aggregates per intestine remained very consistent between the three experimenters for worms fed MPAO1 and OP50, there were some statistically significant differences in the average number of aggregates but only in worms colonized by MPAO1 (Supplemental Figure 2). These results highlight the reproducibility of the results even between inexperienced experimenters.
To ensure that the reproducibility of aggregate quantification is not significantly influenced by worm position, a set of 15 worms was selected and imaged 15 separate times following agitation in between each image capture using a pipette tip. Images of aggregates in worms fed with E. coli OP50 and P. aeruginosa MPAO1 were collected and analyzed using CellProfiler. The average number of aggregates from each of these different sets of images was slightly but non-significantly different, further supporting the reproducibility of this approach (Supplemental Figure 3).
Colonization of the C. elegans intestine with gram-negative enteric pathogens has been shown to disrupt proteostasis across tissues, with P. aeruginosa being among the most potent inducers of polyQ aggregation9. To determine whether these optimized protocols will successfully detect and quantify P. aeruginosa-mediated enhancement of aggregation, worms expressing intestinal polyQ were colonized with E. coli OP50 (control bacteria), and P. aeruginosa MPAO1, sections 1-8 were conducted. The acquired images were analyzed using CellProfiler (section 9, Supplemental File 1). The results of automated quantification show a significant increase in the number of aggregates induced by P. aeruginosa MPAO1, consistently resulting in a two-fold enhancement compared to worms fed with control E. coli OP50 (Figure 6).
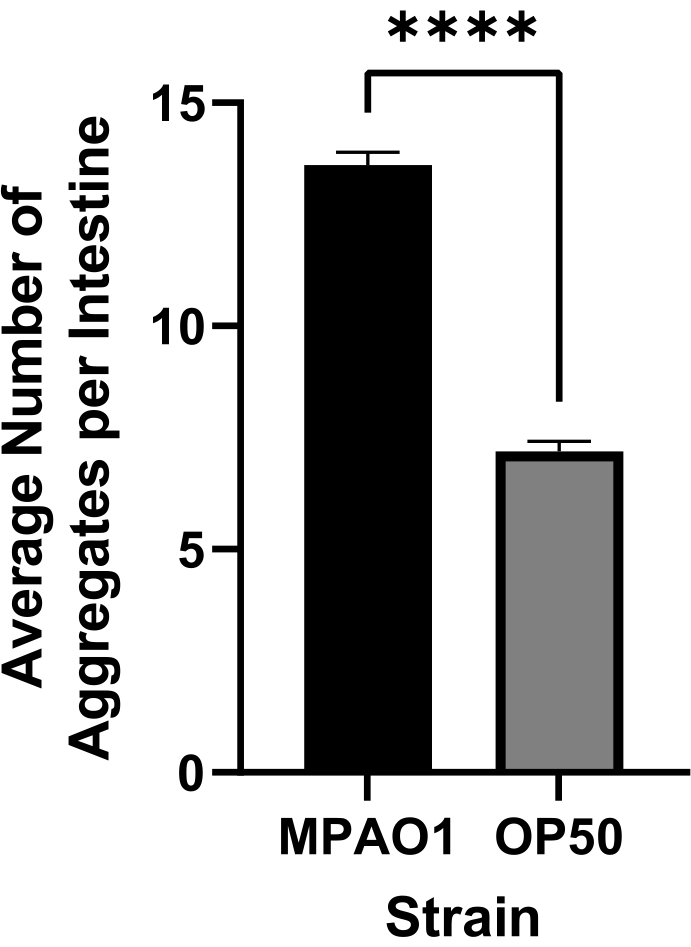
Figure 6: The average number of aggregates per intestine in worms colonized with control E. coli OP50 and P. aeruginosa MPAO1. The number of aggregates per intestine was assessed using CellProfiler (sections 8-9). Data are represented as the average number of aggregates per intestine in worms colonized with OP50 (n = 1068) and MPAO1 (n = 1557). Statistical significance was calculated using Student's t-test (**** p < 0.0001). Error bars represent SEM. Please click here to view a larger version of this figure.
The optimized pipeline was designed to support large-scale screens for conditions that affect proteostasis. To test the feasibility of this approach in screening large libraries of bacteria for their effect on host proteostasis, the pipeline described herein was employed (sections 1-9) to test the effect of 90 P. aeruginosa non-essential gene knock-out mutant strains on polyQ aggregation18. This pilot screen is part of a larger project designed to screen all P. aeruginosa non-essential mutant strains for their ability to influence host proteostasis. Out of 90 bacterial strains tested, colonization of C. elegans intestine with one candidate showed a significant decrease in the number of aggregates (Figure 7). Follow-up experiments to evaluate the sensitivity of this assay were performed via manual aggregate counts from a random selection of six P. aeruginosa mutants that differed non-significantly from the MPAO1 control. These experiments were performed using the more traditional 6 cm NGM plates, transferring worms onto test strains as L1's to recapitulate previously established methods9. The confirmation experiments by manual counting revealed that none of the mutants, including the one that significantly decreased the number of aggregates (Figure 7), affected polyQ aggregation (Supplemental Figure 4). In addition, the subtle changes in aggregation observed in the screen of the 90 mutant strains were not detected among manual counts of selected candidates, indicating that such changes could arise because of biological and experimental variability, such as low n value. Collectively, the results indicate that while our method can reliably pick up significant changes, subtle ones will likely be missed, and all potential candidates will have to be individually confirmed.
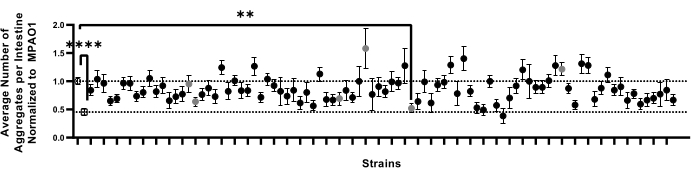
Figure 7: The number of aggregates per intestine in a representative sample set of worms colonized by 92 bacterial strains. Data are represented as the average number of aggregates per intestine normalized to that of worms colonized with MPAO1. Dotted lines represent the average number of aggregates in worms colonized with MPAO1 (top, open circle) and OP50 control (bottom, open square). Solid symbols represent 90 distinct knock-out mutant strains of P. aeruginosa MPAO1. The average number of aggregates per worm between worms colonized with MPAO1 and a single mutant was statistically significant. Gray circles represent samples that were confirmed manually (Supplemental Figure 4). Statistical significance was calculated using one-way analysis of variance (ANOVA) followed by multiple comparison Dunnett's post-hoc test (** p < 0.01, **** p < 0.0001). Error bars represent SEM. Please click here to view a larger version of this figure.
To manage the large amount of data generated by CellProfiler, a Graphical User Interface (GUI) was developed to automate data processing and organization (Figure 8). The GUI was developed using Tkinter, an open-source Python cross-platform widget toolkit. From the given metadata, the application extracts the number of aggregates (column K) from each well (Column J) present in a plate. A Python data handling library called "Pandas" was used to carry out the aforementioned process. The GUI application provides drag-and-drop support for users to upload data files. The data in each file are stored in the form of a two-dimensional tabular structure called a data frame. An empty dictionary pair is initialized for every unique well found within the data frame. Next, the distinct aggregates found in each well are counted and appended to their respective dictionary pairs. The column with lesser data is padded with empty valued strings to ensure that each column is even in size. Finally, the structure is converted to a data frame which is exported in the form of a spreadsheet into the directory specified by the user.
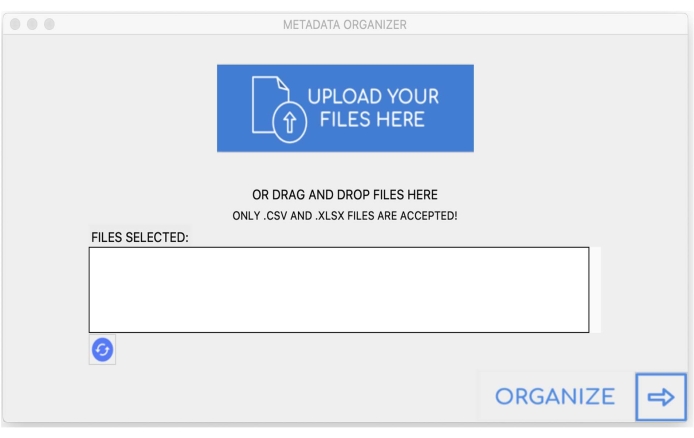
Figure 8: Graphical User Interface. Please click here to view a larger version of this figure.
Supplemental Figure 1: Detection of muscle-specific polyQ aggregates. Worms expressing muscle-specific polyQ35::YFP were plated as L1s and cultured on OP50 for 48 h. Once worms developed into young adults, they were transferred to 24-well NGM plates, supplemented with 100 µg/mL FUDR and seeded with MPAO1 for an additional 72 h before imaging. (A) Brightfield image used to identify worm bodies. (B) Original fluorescent image acquired using GFP channel. (C) Aggregates identified using CellProfiler. (D) A total number of identified aggregates superimposed over the original fluorescent image with worm and aggregate outlines. Image capture and processing were performed using the settings described in sections 8-9. Panels E-H represent close-up images of the corresponding outlined regions in images A-D. Scale bars = 500 µm. Please click here to download this File.
Supplemental Figure 2: Reproducibility of aggregate quantification between different experimenters. Average number of aggregates quantified using CellProfiler for six wells of worms colonized with P. aeruginosa MPAO1 (black bars) and six wells of worms colonized with control E. coli OP50 (gray bars). Each well was imaged by three experimenters (AVS, DMC, RDH). Data are represented as the average number of aggregates per intestine (n = 30-115). Statistical significance was calculated using one-way ANOVA followed by Tukey's multiple comparisons test (* p < 0.05, ** p < 0.01). Error bars represent SEM. Please click here to download this File.
Supplemental Figure 3: The effect of worm position on the reproducibility of aggregate quantification. Average aggregate number per intestine in worms colonized with control E. coli OP50 (gray bars) and P. aeruginosa MPAO1 (black bars). Results represent the average number of aggregates per intestine (15≥n≥12) quantified using CellProfiler. The position of worms within the wells was changed by agitation in between each acquisition. No statistically significant differences were found in either group. Statistical significance was calculated using one-way ANOVA followed by Tukey's multiple comparisons test. Error bars represent SEM. Please click here to download this File.
Supplemental Figure 4: Confirmation of the pilot screen with manual counting. The average number of aggregates per intestine was quantified manually. Data represent aggregation profiles of worms colonized with six MPAO1 knock-out mutants (gray circles Figure 7) compared against wild-type MPAO1 and OP50 controls (n = 30). Statistical significance was calculated using one-way ANOVA followed by multiple comparison Dunnett's post-hoc test (**** p < 0.0001). Error bars represent SEM. Please click here to download this File.
Supplemental Figure 5: The effect of FUDR on intestinal polyQ aggregation. Data are represented as the average number of polyQ44::YFP aggregates per intestine (n = 20). Worms were transferred onto control (no FUDR) or FUDR-containing plates (100 µg/mL) after 48 h of growth at 25 °C on E. coli OP50. Manual counts were collected after an additional 48 h. Statistical significance was calculated using Student's t-test (ns = not significant). Error bars represent SEM. Please click here to download this File.
Supplemental File 1: Proteostasis pipeline. Downloadable image analysis pipeline for use in CellProfiler. Instructions for application can be found in section 9. Please click here to download this File.
Supplemental File 2: Training set untangling worm. File to be uploaded into the "UntangleWorms" module. This particular training set is specific to the worms used in the initial approach. Alterations in worm size and shape will change the accuracy and quality of identification. It may be necessary to create a more personalized training file. Instructions for creating a new training set can be found at the official CellProfiler website17. Please click here to download this File.
Supplemental File 3: Graphical User Interface for Windows Operating System. gui_windowsOS_64x.zip. Please click here to download this File.
Supplemental File 4: Graphical User Interface for Mac Operating System. gui_MacOS_64x.zip. Please click here to download this File.
Discussion
The described protocol outlines procedures for C. elegans culturing, imaging, and image processing that incorporates CellProfiler, an open-source image analysis software. The representative results demonstrate reproducibility, reduction of bias, and scalability. This standardized procedure will improve screening strategies employed with large bacterial, genomic, or drug libraries. While other automated C. elegans methods of object detection exists, the described technique offers a standardized, higher-throughput pipeline that integrates culturing, image acquisition, and analysis.
Several variations of worm cultivation had to be tested to optimize the protocol described herein. Initially, worms were transferred to sample bacteria immediately post age-synchronization (L1 stage). However, such an approach resulted in a population of worms with variable sizes, even among worms within the same well. C. elegans are known for pathogen avoidance19, which could have contributed to the observed variability in size and ultimately affect downstream imaging-worm detection, in particular. To eliminate such variability, the entire NGM area in each well was covered with test bacteria. Furthermore, worms were fed E. coli OP50 and allowed to fully develop into young adults for 48 h at 25 °C. Allowing worms to reach adulthood on E. coli OP50 prior to transferring them onto test bacteria resulted in more consistent body size. Additionally, overcrowding and rapid food depletion by progeny were eliminated by supplementing NGM agar with FUDR. The implementation of FUDR removed progeny and enhanced automated worm identification, which was obscured by progeny mixing in with the parental population. However, it is important to be cautious and use appropriate controls when utilizing FUDR, as the compound is known to affect C. elegans proteostasis and lifespan20,21. Under the conditions described in this protocol, FUDR did not affect intestinal polyQ aggregation (Supplemental Figure 5); therefore, its utilization was suitable and beneficial to the described method.
Freezing samples prior to imaging turned out to be a critical step in the successful employment of the pipeline. The aggregate counts prior to freezing were significantly higher than manual counts (Figure 3B). Keeping worms at -20 °C for 18-48 h prior to imaging reduced background fluorescence and ultimately improved aggregate detection (Figure 3A). The effects of freezing on aggregate detection have only been investigated for polyQ and should not be generalized to other models without further investigation of such effects.
Despite all the conditions being kept the same, it was observed that the average number of aggregates per worm could vary between different runs, while the ratio between the number of aggregates in animals colonized with OP50 versus MPAO1 remained consistent (Figure 6, Supplemental Figure 2, Supplemental Figure 5). Therefore, it is essential to always include E. coli OP50 control, or any additional suitable reference controls, in every run. Such variability in aggregate counts between experiments could be influenced by environmental conditions (temperature, humidity)22,23 or genetic background8. In fact, it was observed that after prolonged culture, intestinal fluorescence drastically decreased or was completely lost, which required thawing a new strain from frozen stock. The observed decrease in fluorescence could be a result of genetic changes that suppress toxic transgenes, such as those expressing polyQ. Nonetheless, the exceptional reproducibility of the results observed between different experimenters (Supplemental Figure 2), between biological replicates (Figure 5), and within the same sample (Supplemental Figure 3) emphasize on the strength of this approach.
Numerous reports have employed intestinal polyQ to study proteostasis9,11,12,13,24,25. However, a direct comparison between results cannot be made due to variability between experimental approaches and readout methods. Nonetheless, a few results from previously published data are recapitulated by the automated quantification described herein, including bacterial induction of aggregation9,13 and a comparable number of aggregates11. Collectively, the described pipeline offers a valuable tool to study proteostasis.
The method described herein has some inherent challenges. For example, it requires sufficient time to master all components of this protocol, which is especially true for section 8 of the protocol, which requires familiarity with the assay to determine if the images acquired are appropriate for pipeline analysis. Deviations from the image acquisition settings used in this protocol are possible; however, modification of the settings and worm training set will likely be required. This pipeline can distinguish aggregates of various sizes and those that are touching, which limits the "blending" of aggregates and ultimately increases the detection sensitivity. However, issues may arise when attempting to identify large aggregates that exceed the accepted size range, as expanding the upper size threshold may lead to errors caused by poor identification, such as the inability to differentiate aggregates that are touching. A balance between accuracy, size, and intensity must be found prior to image analysis. The efficiency of aggregate identification could be further improved by incorporating machine learning to create a neural network capable of enhancing aggregate detection. Such improvements are currently being explored and will greatly assist in addressing current issues such as the detection of aggregates that lie on different focal planes or that have abnormal shapes.
One notable weakness of the described method is the variability in automated aggregate counts, as they are not always recapitulated by manual counts in worms fed different bacterial strains. For example, based on automated counts, worms fed P. aeruginosa mutant 53 (M53) had significantly fewer aggregates compared to the wild-type strain (MPAO1) (Figure 7); however, confirmation of the hit showed no significant difference (Supplemental Figure 4). In general, high-throughput drug screens have a high rate of false-positive hit detection, and the described method is no exception26. Thus, it is a critical part of the protocol to confirm all potential hits.
While this protocol was optimized to fit a screening strategy to identify bacteria that affect host proteostasis, each step can be further modified to test the effect of genomic RNAi libraries, small molecules, or other conditions. Additional modifications can be made at each step to suit the requirements of a specific screening strategy. Furthermore, this technique provides a level of flexibility that allows for the optimization of each step to suit a specific model. For example, this approach can be extended to polyQ aggregation in other tissues or extracting other features detected in images such as monitoring gene expression using inducible fluorescent reporters (e.g., heat shock genes), assessing subcellular localization of proteins (e.g., nuclear localization of DAF-16), studying aggregation in other disease models (Aβ1-42, α-synuclein, TDP-43, etc.) or assessing physiological phenotypes, such as worm size.
Disclosures
The authors have declared that no conflicts of interest exist.
Acknowledgements
This work was supported by the National Institutes of Health (1RO3AG069056-01) and the Infectious Diseases Society of America funding to DMC. The funders had no role in study design, data collection and analysis, decision to publish, or preparation of the manuscript. We thank the members of the Czyz Lab for proofreading the manuscript. Cartoon figures were generated using BioRender paid license.
Materials
| Name | Company | Catalog Number | Comments |
|---|---|---|---|
| 1.7 mL Microtubes | Olympus Plastics | Cat#24-282 | Microcentrifuge tubes |
| 10 mL Serological Pipettes | GenClone | Cat#12-104 | Plastic pipettes |
| 15 mL Centrifuge Tubes, Racked | Olympus Plastics | Cat#28-101 | Conical tubes |
| 5-Fluoro-2′-deoxyuridine | Fisher Scientific | D2235100MG | FUDR |
| Accu-jet Pro Pipette Controller | Genesee Scientific | 91-600RB | Pipette gun |
| Agar | Fisher Scientific | Cat#BP1423-2 | Granulated agar |
| BioRender | BioRender | Graphical figure generator | |
| Bleach (Regular) | Clorox | Bar# 044600324111, Splash-less Bleach | 4.5% sodium hypochlorite |
| C. elegans: AM140: rmIs132 [unc-54p::q35::yfp] | Morimoto Lab (Northwestern University) | AM140, Q35::YFP | Muscle polyQ |
| C. elegans: AM738: rmIs297[vha-6p::q44::yfp; rol-6(su1006)] | Morimoto Lab (Northwestern University) | AM738, Q44::YFP | Intestinal polyQ |
| CaCl2·2H2O | Fisher Scientific | Cat#C79-500 | Calcium chloride dihydrate |
| CellProfiler | Broad Institute | Image analysis software | |
| Cholesterol | Fisher Scientific | Cat#ICN10138201 | Cholesterol |
| Circulating Water Bath Head | Lauda | 26LE | Lauda E 100 |
| CoolLED pE300lite 365 dir mount STEREO | CoolLED | 8114931 | Fluorescent light control and emitter |
| 16 mL Culture Tubes | Olympus Plastics | 21-129 | Culture tubes, 17 mm x 100 mm |
| Escherichia coli OP50 | Caenorhabditis Genetics Center | OP50 | E. coli control strain |
| Ethanol, 200 Proof | Decon Labs, Inc. | 2701 | |
| Eyepiece 10x/23B, adjustable, 3d gen | Leica Microsystems | 10450910 | Eyepiece set |
| Filter Set ET GFP - MZ10F | Leica Microsystems | 10450588 | Filter cube |
| GraphPad Prism v9.2.0 | GraphPad Software, Inc. | Statistical analysis tool | |
| Heratherm Incubator IMP180 | Thermo | 51031562 | Refrigerated incubator |
| Innova 4000 | New Brunswick Scientific | M1192-0000 | Shaking incubator |
| K5 Camera | Leica Microsystems | 11547112 | Stereomicroscope camera |
| KH2P04 | Fisher Scientific | Cat#P285-3 | Potassium phosphate monobasic |
| LAS X Imaging Software | Leica Microsystems | Microscope imaging software | |
| Leica MZ10 F Optics Carrier | Leica Microsystems | 10450103 | Stereomicroscope |
| Levamisole | Fisher Scientific | Cat#0215522805 | Levamisole hydrochloride |
| Luria Broth (Lennox) | Apex Bioresearch Products | Cat#11-125 | LB |
| Magnetic Stir Plate | Fisher Scientific | 11-100-49S | Stir plate |
| MgSO4·7H2O | Alfa Aesar | A14491 | Magnesium sulfate heptahydrate |
| Microscope Slides | Premiere | 8205 | Single frosted microscope slides |
| Na2HPO4·7H2O | Fisher Scientific | Cat#S373-500 | Sodium phosphate dibasic heptahydrate |
| NaCl | Fisher Scientific | Cat#S671-500 | Sodium chloride |
| NaOH | Fisher Scientific | Cat#S318-3 | Sodium hydroxide pellets |
| Objective Achromat, f = 100 mm | Leica Microsystems | 10411597 | Objective microscope lens |
| Petri Dishes | Genesee Scientific | Cat#32-107G | 100 mm x 15 mm |
| Pseudomonas aeruginosa Mutant Library | Manoil Lab (University of Washington) | P. aeruginosa mutant library | |
| Suspension Culture Plate 24-Well, Flat Bottom | Olympus Plastics | 25-102 | Used for worm growth and imaging |
| Trinocular Tube 100% M-series | Leica Microsystems | 10450043 | |
| Trypticase Peptone | ThermoFisher, Difco | Cat#211921 | |
| TX-400 Rotor | Thermo Scientific | Cat#75003181 | Swing bucket rotor |
| Vacuum Driven Filter System | GenClone | Cat#25-227 | 500 mL, PES Membrane, .22 µm |
| Video Objective with C-Mount | Leica Microsystems | 10447367 | 0.63x camera adapter tube |
References
- Soto, C. Unfolding the role of protein misfolding in neurodegenerative diseases. Nature Reviews Neuroscience. 4 (1), 49-60 (2003).
- Fang, P., Kazmi, S. A., Jameson, K. G., Hsiao, E. Y. The microbiome as a modifier of neurodegenerative disease risk. Cell Host & Microbe. 28 (2), 201-222 (2020).
- Kundu, P., Blacher, E., Elinav, E., Pettersson, S. Our gut microbiome: The evolving inner self. Cell. 171 (7), 1481-1493 (2017).
- Sherwin, E., Dinan, T. G., Cryan, J. F. Recent developments in understanding the role of the gut microbiota in brain health and disease. Annals of the New York Academy of Sciences. 1420 (1), 5-25 (2018).
- Mondal, S., et al. Large-scale microfluidics providing high-resolution and high-throughput screening of Caenorhabditis elegans poly-glutamine aggregation model. Nature Communications. 7 (1), 13023(2016).
- Guisbert, E., Czyz, D. M., Richter, K., McMullen, P. D., Morimoto, R. I. Identification of a tissue-selective heat shock response regulatory network. PLoS Genetics. 9 (4), 1003466(2013).
- Silva, M. C., et al. A genetic screening strategy identifies novel regulators of the proteostasis network. PLoS Genetics. 7 (12), 1002438(2011).
- Nollen, E. A., et al. Genome-wide RNA interference screen identifies previously undescribed regulators of polyglutamine aggregation. Proceedings of the National Academy of Sciences of the United States of America. 101 (17), 6403-6408 (2004).
- Walker, A. C., et al. Colonization of the Caenorhabditis elegans gut with human enteric bacterial pathogens leads to proteostasis disruption that is rescued by butyrate. PLOS Pathogens. 17 (5), 1009510(2021).
- Goya, M. E., et al. Probiotic Bacillus subtilis protects against α-Synuclein aggregation in C. elegans. Cell Reports. 30 (2), 367-380 (2020).
- Kumsta, C., Chang, J. T., Schmalz, J., Hansen, M. Hormetic heat stress and HSF-1 induce autophagy to improve survival and proteostasis in C. elegans. Nature Communications. 8, 14337(2017).
- Prahlad, V., Morimoto, R. I. Neuronal circuitry regulates the response of Caenorhabditis elegans to misfolded proteins. Proceedings of the National Academy of Sciences of the United States of America. 108, 14204-14209 (2011).
- Mohri-Shiomi, A., Garsin, D. A. Insulin signaling and the heat shock response modulate protein homeostasis in the Caenorhabditis elegans intestine during infection. Journal of Biological Chemistry. 283 (1), 194-201 (2008).
- Hakim, A., et al. WorMachine: machine learning-based phenotypic analysis tool for worms. BMC Biology. 16 (1), 8(2018).
- Wählby, C., et al. An image analysis toolbox for high-throughput C. elegans assays. Nature Methods. 9 (7), 714-716 (2012).
- Jones, T. R., et al. CellProfiler Analyst: data exploration and analysis software for complex image-based screens. BMC Bioinformatics. 9 (1), 482(2008).
- CellProfiler: an open-source image analysis software. , Available from: http://www.cellprofiler.org (2021).
- Held, K., Ramage, E., Jacobs, M., Gallagher, L., Manoil, C. Sequence-verified two-allele transposon mutant library for Pseudomona aeruginosa PA01. Journal of Bacteriology. 194 (23), 6387-6389 (2012).
- Schulenburg, H., Ewbank, J. J. The genetics of pathogen avoidance in Caenorhabditis elegans. Molecular Microbiology. 66 (3), 563-570 (2007).
- Feldman, N., Kosolapov, L., Ben-Zvi, A. Fluorodeoxyuridine improves Caenorhabditis elegans proteostasis independent of reproduction onset. PLoS One. 9 (1), 85964(2014).
- Van Raamsdonk, J. M., Hekimi, S. FUdR causes a twofold increase in the lifespan of the mitochondrial mutant gas-1. Mechanisms of Ageing and Development. 132 (10), 519-521 (2011).
- Haldimann, P., Muriset, M., Vígh, L., Goloubinoff, P. The novel hydroxylamine derivative ng-094 suppresses polyglutamine protein toxicity in Caenorhabditis elegans. Journal of Biological Chemistry. 286 (21), 18784-18794 (2011).
- Shinn-Thomas, J. H. Wrapping culture plates with Parafilm M® increases Caenorhabditis elegans growth. BMC Research Notes. 12 (1), (2019).
- Alexander-Floyd, J., et al. Unexpected cell type-dependent effects of autophagy on polyglutamine aggregation revealed by natural genetic variation in C. elegans. BMC Biology. 18 (1), 18(2020).
- Moronetti Mazzeo, L. E., Dersh, D., Boccitto, M., Kalb, R. G., Lamitina, T. Stress and aging induce distinct polyQ protein aggregation states. Proceedings of the National Academy of Sciences of the United States of America. 109 (26), 10587-10592 (2012).
- Sink, R., Gobec, S., Pecar, S., Zega, A. False positives in the early stages of drug discovery. Current Medicinal Chemistry. 17 (34), 4231-4255 (2010).
Reprints and Permissions
