The present protocol describes step-by-step autofluorescence imaging and evaluation of phycobiliprotein changes in red algae based on spectral analysis. This is a label-free and non-destructive method to evaluate cellular adaptation to extreme habitats, when only scarce material is available and cells grow slowly, or not at all, under laboratory conditions.
A subscription to JoVE is required to view this content. Sign in or start your free trial.
Method Article
Autofluorescence Imaging to Evaluate Red Algae Physiology
In This Article
Summary
Abstract
Red algae (Rhodophyta) contain phycobiliproteins and colonize habitats with dim light, however some (e.g., some Chroothece species) can also develop in full sunshine. Most rhodophytes are red, however some can appear bluish, depending on the proportion of blue and red biliproteins (phycocyanin and phycoerythrin). Different phycobiliproteins can capture light at diverse wavelengths and transmit it to chlorophyll a, which makes photosynthesis under very different light conditions possible. These pigments respond to habitat changes in light, and their autofluorescence can help to study biological processes. Using Chroothece mobilis as a model organism and the spectral lambda scan mode in a confocal microscope, the adaptation of photosynthetic pigments to different monochromatic lights was studied at the cellular level to guess the species' optimal growth conditions. The results showed that, even when the studied strain was isolated from a cave, it adapted to both dim and medium light intensities. The presented method is especially useful for studying photosynthetic organisms that do not grow or grow very slowly under laboratory conditions, which is usually the case for those living in extreme habitats.
Introduction
Red algae, such as the genus Chroothece, can grow in extreme habitats, where they frequently have to cope with marked environmental changes1. Floods and droughts are frequent in semi-arid regions where this genus can be found, and some species have been reported in creeks, cliffs, caves, or even thermal waters2. However, most of the time, biological variables, such as competition or grazing, relegate species to non-optimal conditions for their growth. As these organisms are often difficult to culture and either do not grow or grow very slowly under laboratory conditions, one major limitation is the available sample size. Therefore, it is very important to follow non-destructive methods or methods that involve minimal sample manipulation3,4.
The physiological skills needed to survive in these harsh environments can be monitored by following changes in their photosynthetic systems. Metabolic mechanisms, photosynthetic efficiency, and sensitivity to light or culture conditions can be revealed by pigment fluorescence emission profiles, due to accurate changes in their energy transfer or trapping5,6,7,8.
Autofluorescence of cellular compounds can be used as a marker for cytodiagnosis or as a natural indicator of cellular state or metabolism in response to external and internal signals through changes in emission9. It can also be used to discriminate taxonomically different groups of photosynthetic organisms10. Depending on the phylogenetic position of phototrophic microorganisms, one can find different in vivo fluorescence features. Therefore, a taxonomic identification based on the in vivo characteristics of phototrophic fluorescence (including fluorescence absorption and emission spectra) has been attempted on several occasions11,12. Because of the diversity in accessory pigments among phytoplankton taxa, differences in the wavelengths at which chlorophyll a (Chl a) fluorescence is stimulated, or differences in emission spectra, can be used to infer taxonomy13. The in vivo fluorescence excitation and emission spectra of these specimens rely not only on the phyla of algae, but also on photosystem adaptation14. The efficiency of energy transfer to Chl a, or the ratio of Chl a to accessory pigments, and the cellular pigment content are sensitive to growth conditions5.
Red algae, particularly Chroothece, have several accessory fluorescent pigments-phycobiliproteins and carotenoids; the former concentrate in phycobilisomes attached to the thylakoids of chloroplasts. Phycobiliproteins (phycocyanin, phycoerythrin, and allophycocyanin) can capture light at different wavelengths and transmit it to Chl a, which makes photosynthesis in very different light and culture conditions possible15. For instance, Chroothece species can grow inside caves or almost emerge in slightly saline calcareous streams2.
Monochromatic lights affect the growth and pigment composition of photosynthetic organisms, and have been studied to prevent or control the growth of photosynthetic organisms in caves. Mulec et al. showed that red enriched lighting promotes the growth of cyanobacteria, algae, and plants16. Previous studies have also reported that green light affects the pigment composition of cyanobacteria17, while others have revealed that green light prevents the growth of most photosynthetic organisms and some cyanobacteria exhibit a reduction in thylakoids and weaker mean fluorescence intensity18.
To understand the ability of Chroothece as a model organism to overcome harsh conditions, cultured cells have been exposed to increasing light intensities and monochromatic light (green or red)15, to see how it copes with the dim conditions of caves (where red light predominates). The protocol presented herein reproduces the effect of the abovementioned variables on Chroothece's phycobiliproteins at the cellular level using its own autofluorescence.
Nowadays, fluorescence is commonly used as a tool to study the physiological responses of vascular plants, microalgae, macroalgae, and cyanobacteria13,14,16. Spectral confocal fluorescence microscopy is a superb tool for in vivo studies to evaluate photosynthetic specimens' physiology at the single-cell level10,17,18,19,20, by avoiding problems associated with the low growth rate in the laboratory and the difficulties with obtaining enough biomass for the associated extraction and biochemical methods8. Once cells are treated under different culture conditions for 2 weeks, the lambda scan profile can be measured in vivo. Although there are several publications in which different wavelengths of excitation by confocal imaging have been used3,4,10,17, most phycobiliproteins and Chl a can be detected using a 561 nm wavelength excitation line, and the detected emission ranges from 570 to 760 nm wavelength. These criteria have been based on an analysis previously performed10 with commercial pure pigments (Table 1) by confocal imaging and the obtained results in different algae species20,21,22.
| Pigments | λflmax (nm) | λ exc (nm) | |||||||
| 351 | 364 | 458 | 476 | 488 | 514 | 543 | 633 | ||
| Chl a | 660.9-678.1 | 43.4 ± 1.8 | 11.2 ± 0.2 | 1.8 ± 0.05 | 2.0 ± 0.08 | 12.2 ± 0.7 | 6.0 ± 0.3 | 4.2 ± 0.16 | 80.7 ± 1.5 |
| R-PE | 569.2-583.3 | 5.9 ± 0.6 | 5.9 ± 0.16 | 11.1 ± 0.04 | 42.2 ± 0.3 | 100.0 ± 0 | 90.0 ± 0.3 | 99.2 ± 0.08 | - |
| 652.1-668.6 | - | - | 1.5 ± 0.01 | 3.7 ± 0.04 | 26.7 ± 0.5 | 8.7 ± 0.16 | 11.1 ± 0.16 | 11.3 ± 0.2 | |
| C-PC | 636.2-676.4 | 2.3 ± 0.04 | 1.0 ± 0.01 | 0.6 ± 0.004 | 0.7 ± 0.008 | 2.0 ± 0.08 | 2.0 ± 0.04 | 3.3 ± 0.16 | 33.6 ± 0.9 |
| APC-XL | 667.3-683.8 | 15.1 ± 1.5 | 9.6 ± 0.98 | 1.0 ± 0.04 | 1.2 ± 0.08 | 5.9 ± 0.7 | 4.1 ± 0.5 | 23.2 ± 3.5 | 91.4 ± 2.3 |
Table 1: The pure pigment information used to run the lambda scan analysis. This table shows emission peaks and shoulders/fluorescence band maxima of different fluorochromes/pigments by confocal imaging spectrophotometry for all the excitation wavelengths, and the percentage of light emission by pigments/fluorochromes. Values were calculated by the formula: = MFI*100/255. Each value is the mean ± SE (mean ± standard error from the mean). Pure pigments were used for calibrating the confocal scanning laser microscope as follows1,2,10. Chlorophyll a was obtained from Spinacia oleracea, R-phycoerythrin (R-PE) from Porphyra tenera, and C-phycocyanin (C-PE) from Spirulina sp. All the species were dissolved in filtered distilled water. Allophycocyanin-XL (APC-XL) was obtained from Mastigocladus laminosus, which was dissolved in ammonium sulfate (60%) and potassium phosphate (pH = 7) to achieve a concentration of 38 mM. The scans were performed with 400 µL of each pigment solution (concentration of 1 mg/mL) using an 8-well covered-glass bottom chamber.
The study of a single excitation wavelength is quite a useful first approximation. In this case, however, it is necessary to elucidate the relative contribution of the different complexes in the fluorescence signal, which is recommended to perform a fluorescence ratio or spectrum analysis at several wavelengths, among other methods.
Access restricted. Please log in or start a trial to view this content.
Protocol
The algal species Chroothece mobilis was used for the present study. The species was obtained from the Microalgae Edaphic SE Spain, MAESE 20.29 culture collection. An overview of the protocol is shown in Figure 1.

Figure 1: Overview of the study. Chroothece mobilis is incubated under extreme habitat conditions, such as different monochromatic lights, for 2 weeks. The effect on Chroothece's physiology is evaluated by autofluorescence of the proteins contained in phycobilisome and photosystems using a confocal laser scanning microscope. Please click here to view a larger version of this figure.
1. Sample preparation
- Prepare the inoculum of Chroothece mobilis from the agar culture of the collection by transferring it to the SWES liquid medium (Table 2).
NOTE: SWES "Seewasser + Erddekokt + Salze" = seawater medium23. - Maintain all the cultures for 2 weeks with a 16:8 light/dark photoperiod at 20 °C under low white light intensity (LL: 80 µM/m2/s) conditions and without shaking, until the desired cell density is obtained (see step 1.3).
NOTE: The growth light conditions are 80 µM/m2/s light intensity (active photosynthetic radiation, PAR). These conditions are used as the low light conditions (control). The composition of the SWES medium is provided in Table 2. - Carry out inoculations for the different experiments in the exponential culture phase with a cell density of 5 x 10³ cells/mL in a 24-well plate, using 1 mL per well.
NOTE: Perform cell counting with a Neubauer chamber24, and dilute the culture with SWES whenever necessary.
| SWES medium composition | |
| Component | Concentration |
| KNO3 | 1.98 mM |
| K2HPO4 | 115 µM |
| MgSO4 | 81 µM |
| ZnSO4, 7H2O | 17 nM |
| MnSO4, 7H2O | 45 Nm |
| H3BO3, 4H2O | 3.1 mM |
| Co(NO3)2 | 17 mM |
| Na2MoO4, 6H2O | 21 nM |
| CuSO4, 2H2O | 0.1 nM |
| FeSO4, 5H2O | 13 µM |
| EDTA, 7H2O | 11 µM |
| Vit B12 | 5 µg |
| Soil extract | 30 mL |
| Filtered river water | 455 mL |
Table 2: SWES medium composition.
2. Reproducing extreme algae habitat conditions: green and red monochromatic light effect
- Add 1 mL of the cell culture from the stock culture prepared at the aforementioned cell density (step 1.2) to inoculate each well of a 24-well plate.
- Keep the cell culture covered for 2 weeks to reproduce the monochromatic light effect.
- Use the green filter that allows green light to pass through from 470 to 570 nm with a peak at the 506 nm wavelength (according to the manufacturer's specifications; see Table of Materials) and expose it to the culture25.
- Use the red filter that allows red light between 590 and 720 nm and peaks at 678 nm (according to the manufacturer's specifications; see Table of Materials) to expose it to the culture25.
NOTE: The low white light intensity (LL: 80 µM/m2/s; see Table of Materials) condition is used as the light intensity control to compare the obtained effects. The employed light intensity units are micromole per second and square meter (µmol m-2 s-1) or photosynthetic photon flux density (PPFD).
3. Autofluorescence imaging
NOTE: The setup of the imaging software (see Table of Materials) is illustrated in Figure 2.
- Turn on all the components of the inverted confocal laser scanning microscope (CLSM; see Table of materials), including the laser.
- Mount the cells from each experimental well of the 24-well plate in SWES growth medium to a 35 mm glass bottom dish (see Table of Materials) for imaging.
- Choose the 63x/1.30 NA glycerol immersion objective and place glycerol over the lens (see Table of Materials).
- Place the well plate on the microscope stage and ensure the specimen does not move during image acquisition.
- Center the specimen in the light path and focus on the center of the cell by selecting the plane with the highest fluorescence intensity.
- Open the image acquisition software and choose xyλ from the drop-down list in the acquisition mode26.
- Select the excitation line of the laser to 561 nm DPSS, 8 bits of dynamic range, and 1024 x 1024 pixels.
NOTE: Ensure the confocal microscope has a 561 nm DPSS laser or a white light laser (WLL). - Collect the fluorescence emission spectra in the 10 nm bandwidth and the lambda step size of 4 nm within the 570-760 nm range.
- Set the pinhole at 1 Airy unit and run the lambda scan acquisition.
- Repeat this process as many times as possible in different fields of view to collect an acceptable amount of data for statistical analysis (usually a standard deviation lower than 10%22).
- Repeat the last step under the different conditions (under red and green lights) and save the data.
NOTE: Use the same acquisition settings for the different samples and conditions to compare and conduct the statistical analysis.
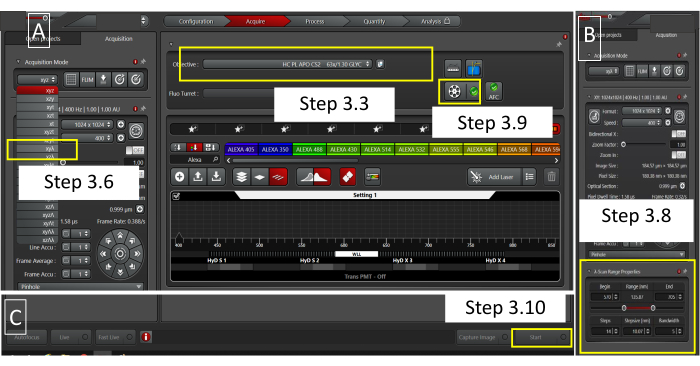
Figure 2: Software setup. Imaging software user interface to set up the lambda scan parameters. (A) From left to right, to select the acquisition mode xyλ from the drop-down list, that corresponds to step 3.6 in the protocol, and to select the right immersion lens type, corresponding to step 3.3 in the protocol. Ensure to remove any filter from the light path in step 3.9. (B) The panel for setting up the lambda scan parameters corresponds to step 3.8 in the protocol. (C) Run the lambda scan in step 3.10. Please click here to view a larger version of this figure.
4. Parameters to evaluate Chroothece's physiology
- Once the lambda scan is acquired, click on the quantify window at the top of the software (as shown in Figure 3) to evaluate the collected fluorescence emission spectra. Go to the Open project window and select one xyλ file (Figure 3).
- Select Stack profile analysis in the imaging software.
- Define a region of interest (ROI) of 4 µm2 in the center of a cell to analyze the mean fluorescence intensity (MFI). Export the data in CSV format.
NOTE: It is important to avoid the presence of black pixels (to ensure the pixels selected contain positive values) and always maintain a same sized ROI. - Repeat this process with different cells under different conditions to produce enough data to perform statistical analysis.
- Open the CSV files to select the different fluorescence emission peaks from the phycobiliproteins and chlorophylls of all the measured ROIs.
- Select the fluorescence data of phycoerythrin-phycocyanobilin (PE-PCB; 620 nm), C-phycocyanin (CPC; 648 nm), allophycocyanin (APC; 660 nm), and chlorophyll a (Chl a; 680 nm), respectively, in the csv file.
- Create a new table with all the maximum fluorescence values obtained from each phycobiliprotein and chlorophyll peak and plot the data on a graph.
- Perform statistical analysis.
- Analyze if the obtained data meets normality and homoscedasticity27.
- Proceed to the t-test analysis27,28 if the first condition is true. If not, run a Mann-Whitney U test29.
- Consider the differences significant at p values <0.05.
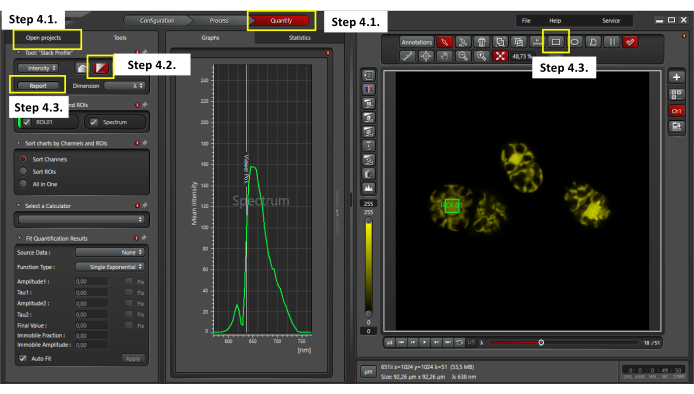
Figure 3: Evaluating Chroothece's autofluorescence. To perform the autofluorescence analysis, ensure to select the quantify window and one xyλ file in the open projects window (step 4.1); select stack profile visualization (step 4.2); select a 4 µm2 ROI in the center of a cell and click on the report button to export the lambda scan data in CSV format (step 4.3). Please click here to view a larger version of this figure.
Access restricted. Please log in or start a trial to view this content.
Results
Chlorophyll a generally absorbs blue and red wavelengths of visible light, whereas phycobiliproteins use green, yellow, and orange wavelengths7. The autofluorescence of these pigments makes the first approach to study phycobiliproteins and chlorophyll behavior under experimental and field conditions possible.
By comparing the obtained data and plotting on different graphs, significant changes in mean fluorescence intensity (MFI) can be distinguished (
Access restricted. Please log in or start a trial to view this content.
Discussion
Some unicellular or colonial red algae, such as Chroothece, grow slowly in vitro, but contain multiple autofluorescent compounds that can be analyzed by spectral analysis under a confocal microscope, where differences in pigment emission peaks can be detected. Spectral confocal fluorescence microscopy has allowed us to conduct in vivo studies to evaluate the adaptation or acclimation of photosynthetic organisms8,10,
Access restricted. Please log in or start a trial to view this content.
Disclosures
The authors have no conflicts of interest to declare.
Acknowledgements
This research was carried out as part of Projects TIN2015-68454-R and 20961/PI/18, financed by the Spanish Ministry of Economy and Competitiveness and the Séneca Foundation of the Murcia Region. Irene Hernández Martínez and Francisco Javier Ibáñez López from the Statistical Support Section of the Scientific and Research Area of Murcia University (Sección de Apoyo Estadístico (SAE), Área Científica y de Investigación (ACTI), Universidad de Murcia, (Figure 1 were drawn by using pictures from Servier Medical Art. Servier Medical Art by Servier is licensed with a Creative Commons Attribution 3.0 Unported License (https://creativecommons.org/licenses/by/3.0/)
Access restricted. Please log in or start a trial to view this content.
Materials
| Name | Company | Catalog Number | Comments |
|---|---|---|---|
| µ-Dish 35 mm, high Glass Bottom | Ibidi | 81158 | - |
| 24 black well plate | Ibidi | 82406 | flat and clear bottom for high throughput microscopy |
| Algae Incubator | Panasonic | MLR-352-PE | |
| Confocal laser scanning microscope | Leica Microsystems | SP8 TCS | - |
| Flask | Fisher Scientific | 15380591 | Can be purchased in a local convenience store or online stores. |
| green filter | PNTA, LEE filters | - | Can be purchased in a local convenience store or online stores. |
| HC PL APO 63X/1.30 GLYC CORR CS2 | Leica Microsystems | 506353 | Glycerol immersion lens |
| Image acquisition software. LAS X | Leica Microsystems | SP8 TCS | - |
| Light source | Panasonic | FL40SSENW/37MLR-352-PE | |
| Quantum photoradiometer | DeltaOhm | DO 9721 | - |
| R software | R Core Team, 2020 | 4.0.2. | - |
| red filter | PNTA, LEE filters | - | Can be purchased in a local convenience store or online stores. |
| SWES medium | University of Murcia | - | - |
| Type G Immersion liquid | Leica Microsystems | 11513910 | Glycerol |
References
- Vis, M. L., Necchi, O. Freshwater Red Algae: Phylogeny, Taxonomy and Biogeography. , Springer Nature. (2021).
- Aboal, M., et al. Diversity of Chroothece (Rhodophyta, Stylonematales) including two new species. European Journal of Phycology. 53 (2), 189-197 (2018).
- Millach, L., Obiol, A., Solé, A., Esteve, I. A novel method to analyse in vivo the physiological state and cell viability of phototrophic microorganisms by confocal laser scanning microscopy using a dual laser. Journal of Microscopy. 268 (1), 53-65 (2017).
- Millach, L., Villagrasa, E., Solé, A., Esteve, I. Combined confocal laser scanning microscopy techniques for a rapid assessment of the effect and cell viability of Scenedesmus sp. DE2009 under metal stress. Microscopy and Microanalysis. 25 (4), 998-1003 (2019).
- Poryvkina, L., Babichenko, S., Leeben, A. Analysis of phytoplankton pigments by excitation spectra of fluorescence. Proceedings of EARSeL-SIG-Workshop LIDAR. , Dresden. (2000).
- Beutler, M., et al. A fluorometric method for the differentiation of algal populations in vivo and in situ. Photosynthesis Research. 72 (1), 39-53 (2002).
- Grigoryeva, N., Chistyakova, L. Fluorescence microscopic spectroscopy for investigation and monitoring of biological diversity and physiological state of cyanobacterial cultures. Cyanobacteria. , (2018).
- Grigoryeva, N. Fluorescence Methods for Investigation of Living Cells and Microorganisms. , (2020).
- Roshchina, V. V. Vital autofluorescence: application to the study of plant living cells. International Journal of Spectroscopy. 2012, 5-18 (2012).
- Roldán, M., Thomas, F., Castel, S., Quesada, A., Hernández-Mariné, M. Noninvasive pigment identification in single cells from living phototrophic biofilms by confocal imaging spectrofluorometry. Applied and Environmental Microbiology. 70 (6), 3745-3750 (2004).
- Hense, B. A., Gais, P., Jütting, U., Scherb, H., Rodenacker, K. Use of fluorescence information for automated phytoplankton investigation by image analysis. Journal of Plankton Research. 30 (5), 587-606 (2008).
- Millie, D. F., Schofield, O. M., Kirkpatrick, G. J., Johnsen, G., Evens, T. J. Using absorbance and fluorescence spectra to discriminate microalgae. European Journal of Phycology. 37 (3), 313-322 (2002).
- Richardson, T. L., et al. Spectral fluorometric characterization of phytoplankton community composition using the Algae Online Analyser. Water Research. 44 (8), 2461-2472 (2010).
- Kieleck, C., Bousquet, B., Le Brun, G., Cariou, J., Lotrian, J. Laser induced fluorescence imaging: application to groups of macroalgae identification. Journal of Physics D: Applied Physics. 34 (16), 2561-2571 (2001).
- Coronado-Parra, T., Roldán, M., Aboal, M. Confocal microscopy in ecophysiological studies of algae: a door to understanding autofluorescence in red algae. Microscopy and Microanalysis. 28 (1), 218-226 (2022).
- Mulec, J., Kosi, G. Lampenflora algae and methods of growth control. Journal of Cave and Karst Studies. 71 (2), 109-115 (2009).
- Nelissen, B., De Baere, R., Wilmotte, A., De Wachter, R. Phylogenetic relationships of nonaxenic filamentous cyanobacterial strains based on 16S rRNA sequence analysis. Journal of Molecular Evolution. 42 (2), 194-200 (1996).
- Roldán, M., Oliva, F., Gónzalez Del Valle, M. A., Saiz-Jimenez, C., Hernández-Mariné, M. Does green light influence the fluorescence properties and structure of phototrophic biofilms. Applied and Environmental Microbiology. 72 (4), 3026-3031 (2006).
- Topinka, J. A., Bellows, W. K., Yentsch, C. S. Characterization of marine macroalgae by fluorescence signatures. International Journal of Remote Sensing. 11 (12), 2329-2335 (1990).
- Roldán, M., Ascaso, C., Wierzchos, J. Fluorescent fingerprints of endolithic phototrophic cyanobacteria living within halite rocks in the atacama desert. Applied and Environmental Microbiology. 80 (10), 2998-3006 (2014).
- Solé, A., Diestra, E., Esteve, I. Confocal laser scanning microscopy image analysis for cyanobacterial biomass determined at microscale level in different microbial mats. Microbial Ecology. 57 (4), 649-656 (2009).
- Ramírez, O., García, A., Rojas, R., Couve, A., Härtel, S. Confined displacement algorithm determines true and random colocalization in fluorescence microscopy. Journal of Microscopy. 239 (3), 173-183 (2010).
- Universität Gottingen-Georg-August. SAG Culture Collection of Algae. Universität Gottingen-Georg-August. , www.uni-goettingen.de (2022).
- Zhang, M., et al. Improvement of cell counting method for Neubauer counting chamber. Journal of Clinical Laboratory Analysis. 34 (1), 23024(2020).
- Wolf, E., Schüßler, A. Phycobiliprotein fluorescence of Nostoc punctiforme changes during the life cycle and chromatic adaptation: Characterization by spectral confocal laser scanning microscopy and spectral unmixing. Plant, Cell and Environment. 28 (4), 480-491 (2005).
- Zucker, R. M., Rigby, P., Clements, I., Salmon, W., Chua, M. Reliability of confocal microscopy spectral imaging systems: Use of multispectral beads. Cytometry Part A. 71 (3), 174-189 (2007).
- Field, A. M. Discovering Statistics Using R. , (2013).
- Linnet, K. Limitations of the paired t-test for evaluation of method comparison data. Clinical Chemistry. 45 (2), 314-315 (1999).
- Rosner, B., Grove, D. Use of the Mann-Whitney U-test for clustered data. Statistics in Medicine. 18 (11), 1387-1400 (1999).
- Colin, L., et al. Imaging the living plant cell: from probes to quantification. The Plant Cell. 34 (1), 247-272 (2022).
- Borlinghaus, R. The white confical: continuous spectral tuning in excitation and emission. Optical Fluorescence Microscopy. , Springer. Berlin, Heidelberg. (2011).
Access restricted. Please log in or start a trial to view this content.
Reprints and Permissions
