


Overview
Source: Shreyas Narsipur, Mechanical and Aerospace Engineering, North Carolina State University, Raleigh, NC
A nozzle is a device that is commonly used to accelerate or decelerate flow by virtue of its varying cross-section. Nozzles are widely used in aerospace propulsion systems. In rockets, propellant that is ejected from the chamber is accelerated through a nozzle to create a reaction force that propels the system. In jet engines, a nozzle is used to transform energy from a high-pressure source into kinetic energy of the exhaust to produce thrust. The isentropic model along the nozzle is sufficient for a first-order analysis as the flow in a nozzle is very rapid (and thus adiabatic to a first approximation) with very little frictional loses (because the flow is nearly one-dimensional with a favorable pressure gradient, except if shock waves form and nozzles are relatively short).
In this experiment, two types of nozzles are mounted on a nozzle test rig, and a pressure flow is created using a compressed air source. The nozzles are run for different back-pressure settings to analyze the internal flow in the nozzles under varying flow conditions, identify the various flow regimes, and compare the data to theoretical predictions.
Principles
A nozzle begins at the point where the chamber diameter begins to decrease. There are two main types of nozzles: the converging nozzle and the converging-diverging nozzle. One of the governing isentropic relations between Mach number (M), nozzle area (A), and velocity (u) is represented by the following equation:
 (1)
(1)
where u is the velocity, A is the nozzle area, and M is the Mach number. Based on Equation 2,
- At M = 0, the flow is static, i.e., no-flow condition exists
- At 0 < M < 1, as the area decreases, a proportional increase in the velocity of the flow is observed
- At M ≥ 1, any increase in area will produce a proportional increase in speed
Converging nozzles, as shown in Figure 1, are tubes with an area that decreases from the nozzle entry to the exit (or throat) of the nozzle. As the nozzle area decreases, the flow velocity increases, with the maximum flow velocity occurring at the nozzle throat. As the inlet flow velocity is increased, flow velocity at the nozzle throat keeps increasing until it reaches Mach 1. At this point, the flow at the throat gets choked, meaning that any further increase of inlet flow velocity will not increase the flow velocity at the throat. It is for this reason that converging nozzles are used to accelerate fluids in the subsonic flow regime alone and can commonly be found on all commercial jets (except for the Concord) as they travel at subsonic speeds.

Figure 1. Schematic of a converging nozzle. Please click here to view a larger version of this figure.
For vehicles like rockets and military aircraft, which must travel at and above the speed of sound, a converging-diverging nozzle, as illustrated in Figure 2, is used. In a converging-diverging nozzle, the converging section is followed by a divergent nozzle section and is designed in a way such that flow gets choked at the throat of the converging section, thereby fixing the mass flow rate in the system. The flow is then isentropically expanded to reach supersonic Mach numbers in the diverging section. The supersonic flow velocities set in the diverging section are a function of the nozzle area ratios after the throat. Based on the design of the converging-diverging nozzle, the flow velocity after the nozzle throat can either: (i) decrease to subsonic velocities, (ii) become supersonic, cause a normal shock, and then decrease to subsonic velocities at the nozzle exit, or (iii) remain supersonic throughout the diverging section. The amount of thrust produced by the nozzle depends on the exit velocity and pressure and the mass flow rate through the nozzle.

Figure 2. Schematic of a converging-diverging nozzle. Please click here to view a larger version of this figure.
The back-pressure (pB) is the driving factor that determines the flow condition in the nozzle. When the stagnation pressure, pO = pB, there is no flow through the nozzle. As pB is reduced, the Mach number at the throat (pT) increases until the flow is choked (MT = 1). The condition at which choked flow occurs can be calculated using the isentropic relation:
 (2)
(2)
where γ is the specific heat ratio of the fluid. Substituting γ = 1.4 (specific heat ratio for dry air) in Equation 2, we obtain a back-pressure ratio of:
 (3)
(3)
Equation 3 defines the boundary between the non-choked and choked flow regimes. When flow is choked, the Mach number no longer increases and is capped at M = 1.
In the case of a converging nozzle, the exit of the nozzle corresponds to the nozzle throat (as seen in Figure 1); therefore, the Mach number right at the exit does not exceed 1, i.e., the flow never goes supersonic. Once the flow exits the nozzle, it undergoes an expansion, due to the sudden increase in area that could lead to (uncontrolled) supersonic flow velocities.
Based on Figure 3, the following are the flow conditions that can be observed in a converging nozzle:
- No flow condition, where the back-pressure is equal to the total pressure.
- Subsonic flow, where the flow accelerates as area decreases, and the pressure drops.
- Subsonic flow, where there is significantly higher acceleration and the pressure drops.
- Choked flow, where any pressure drop does not accelerate the flow.
- Choked flow, where the flow expands after the nozzle exit (considered non-isentropic).

Figure 3. Flow conditions and regimes in a converging nozzle (theoretical predictions). Please click here to view a larger version of this figure.
The mass flow parameter (MFP) is a variable that determines the rate at which mass is flowing through the nozzle and is given by the equation:
 (4)
(4)
Here,  is the mass flow rate through the nozzle, TO is the stagnation temperature, and AT is the area of the throat, which, in the case of the converging nozzle, is equal to the area at the nozzle exit, AE. As observed in Figure 3, until choked flow, the MFP continues to increase. Once the flow is choked, the mass flow rate is fixed, and the MFP remains a constant for decreasing back-pressure ratios.
In order to achieve controlled supersonic flows in a nozzle, a diverging section needs to be introduced after the throat of a converging nozzle, as illustrated in Figure 2. Once the flow becomes choked at the throat of a converging-diverging nozzle (based on Equation 3), three possible flow conditions can occur: subsonic isentropic flow (the flow decelerates after the choked condition), supersonic non-isentropic flow (where the flow accelerates supersonically, forms a shock wave - a thin region of coalesced molecules that forms normal to a certain point on the nozzle and causes a sudden change in flow conditions, generally referred to as a normal shock - and decelerates subsonically after the shock), or supersonic isentropic flow (where the flow accelerates supersonically after the choked condition). Figure 4 shows the following seven profiles in the position versus pressure ratio plot. Note that the first vertical dashed line on the left of the p/pO versus distance along the nozzle plot is the location of the throat, the second vertical dashed line is the location of the nozzle exit, and the horizontal dashed line marks the choked condition.
- Subsonic flow that never reaches choked condition.
- Subsonic flow that reaches choked condition but does not attain supersonic velocities (considered isentropic).
- Subsonic flow that reaches choked condition, with the resulting supersonic flow forming a normal shock, which then experiences subsonic deceleration. Here, the normal shock causes a sudden drop in velocity and an increase in back-pressure, as indicated by the sudden increase in p/pO.
- Subsonic flow that reaches choked condition, with the resulting supersonic flow forming a normal shock after the nozzle (considered isentropic in the nozzle).
- Over-expanded flow – the pressure at the nozzle exit is lower than the ambient pressure, causing the jet exiting the nozzle to be highly unstable with huge variations in pressure and velocity as it travels downstream.
- Flow after the choked condition is supersonic through the nozzle, and no shock is formed.
- Under-expanded flow – the pressure at the nozzle exit is higher than the ambient pressure and results in similar effects as over-expanded flow.

Figure 4. Flow conditions and regimes in a converging-diverging nozzle (theoretical predictions). Please click here to view a larger version of this figure.
Subscription Required. Please recommend JoVE to your librarian.
Procedure
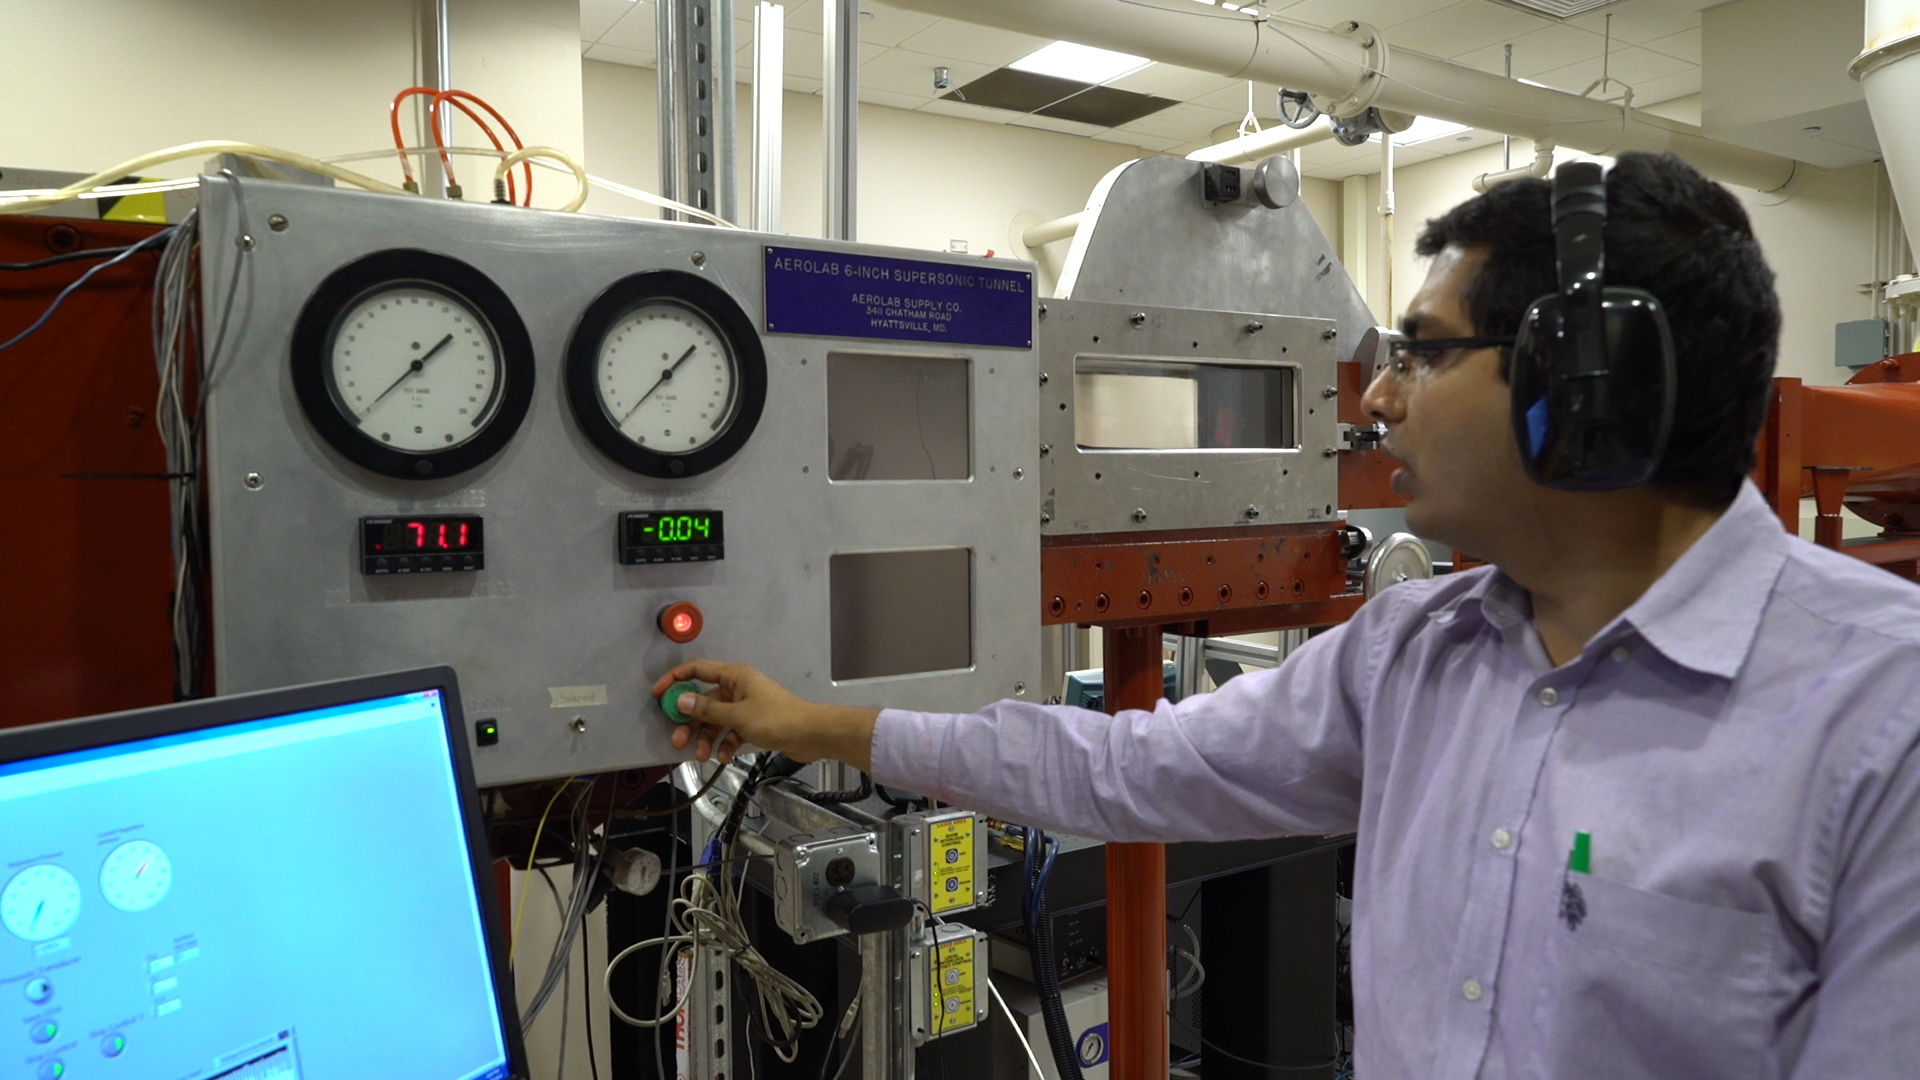
In this demonstration, a nozzle test rig was used, which consisted of a compressed air source that channels high-pressure air through the nozzles being tested, as shown in Figure 5. The flow pressure ranges from 0 - 120 psi and is controlled using a mechanical valve. While the pressures are measured using an external sensor, the mass flow rates in the nozzle are measured by a pair of rotameters placed right before the exhaust of the nozzle test rig.

Figure 5. Nozzle test rig. Please click here to view a larger version of this figure.
1. Measuring Axial Pressure in Converging and Converging-diverging Nozzles
- Mount the converging nozzle in the center of the nozzle test rig, as shown in Figure 5. The 2-D section for the converging nozzle with labels for the pressure taps are shown in Figure 6.

Figure 6. Geometry of converging nozzle. Please click here to view a larger version of this figure.
- Connect the 10 static pressure ports and the stagnation pressure port to the pressure measurement system using flexible, high-pressure PVC tubes.
- Connect the pressure measurement system to the graphical software interface for real-time pressure data reading.
- Take the zero/no-flow condition reading.
- Open the mechanical flow control valve to start the airflow.
- Rotate the valve to adjust the flow rate to obtain a back-pressure ratio (pB/pO) of 0.9. Note that the back-pressure for both the converging and converging-diverging nozzles correspond to the pressure data read-out from port 10.
- Record the data corresponding to Table 1.
- Decrease the back-pressure ratio in steps of 0.1 until pB/pO = 0.1 repeating step 7 for each setting. Additionally, repeat step 7 for a pB/pO = 0.5283 to capture flow data at the theoretical choked flow condition.
- Replace the converging nozzle with the converging-diverging nozzle and repeat steps 1.2 - 1.8. The 2-D section for the converging nozzle with labels for the pressure taps are shown in Figure 7.
- On completion of the tests, disconnect all systems and dismantle the nozzle test-rig.

Figure 7. Geometry of converging-diverging nozzle. Please click here to view a larger version of this figure.
Table 1. Data collected for the nozzle experiment.
| Tap number | Axial Position of Tap (in) | Nozzle Area Ratio (A/Ai) | Pstatic (psi) |
Po (psi) |
Mass Flow Rate (slugs/s) |
Patm (psi) |
To (°F) |
| Figure 6/7 | Table 2 | Table 2 | Gauge pressure | Gauge pressure |
Rotameter | Gauge pressure | Temperature sensor |
Table 2. Nozzle geometry data.
| Tap number | Converging Nozzle | Converging-Diverging Nozzle | ||
| Axial Position of Tap (in) | Nozzle Area Ratio (A/Ai) | Axial Position of Tap (in) | Nozzle Area Ratio (A/Ai) | |
| 1 | 0 | 60.14 | 0 | 60.14 |
| 2 | 1 | 51.379 | 4.5 | 6.093 |
| 3 | 2 | 35.914 | 6.5 | 1 |
| 4 | 3 | 23.218 | 6.9075 | 1.053 |
| 5 | 4 | 13.275 | 7.3795 | 1.222 |
| 6 | 5 | 6.094 | 7.8515 | 1.403 |
| 7 | 5.5 | 3.54 | 8.3235 | 1.595 |
| 8 | 6 | 1.672 | 8.7955 | 1.802 |
| 9 | 6.5 | 1 | 9.2675 | 2.02 |
| 10 | 7 | 60.041 | 9.5 | 60.041 |
A nozzle is a device that is commonly used in aerospace propulsion systems to accelerate or decelerate flow using its varying cross section.
The most basic type of nozzle, the converging nozzle, is essentially a tube with an area that gradually decreases from the entry to the exit, or throat. As the nozzle area decreases, the flow velocity increases, with the maximum velocity occurring at the throat. As the inlet flow velocity increases, flow velocity at the throat also increases until it reaches Mach 1. When it reaches Mach 1, the flow at the throat is choked, meaning that any further increase of the inlet flow velocity does not increase the flow velocity at the throat. For this reason, converging nozzles are used to accelerate fluids in the subsonic regime alone.
The flow in a nozzle is caused by a variation in pressure between two points. Here, the pressure at the exit is referred to as the back-pressure, and the pressure at the entry is the stagnation pressure. The ratio between them is the back-pressure ratio, which can be used to control flow velocity. When the stagnation pressure equals the back-pressure, there is no flow.
Let's look at the Mach number across the length of the nozzle. For the no flow condition, when the back-pressure ratio is equal to one, the Mach number is obviously zero. As back-pressure is decreased, the flow velocity along the converging section increases, as well as the Mach number, with its peak value at the throat. When the back-pressure ratio reaches a value of 0.5283, the Mach number at the throat is one and the flow is choked. As the back-pressure is further reduced, the Mach number at the throat stays constant at one.
Another common nozzle is the converging-diverging nozzle, which has a section of decreasing area, followed by a section of increasing area. We can also look at the Mach number across the length of the converging-diverging nozzle to examine flow conditions at varying back-pressure ratios. For the no flow condition, again the Mach number is zero.
As the back-pressure decreases, the Mach number increases across the converging section while decreasing across the diverging section. When the throat pressure ratio approaches 0. 5283, the flow becomes choked and it reaches Mach one before decreasing subsonically. As the back-pressure is further reduced, the flow after the throat goes supersonic and then subsonic.
At very low back-pressure ratios, the flow isentropically expands and remains supersonic throughout the diverging nozzle, reaching Mach numbers greater than one. Alternatively, the flow can form a shock when it expands in the diverging section.
If the pressure at the nozzle exit is lower than the ambient pressure, the jet exiting the nozzle is highly unstable with variations in pressure and velocity. This is called over-expanded flow. If the pressure at the nozzle exit is higher than the ambient pressure, the flow exhibits similar unstable flow and is called under-expanded.
In this experiment, we will demonstrate and analyze flow in both a converging and a converging-diverging nozzle.
In this experiment, we will study the behavior of nozzles using a nozzle test rig, which consists of a compressed air source that channels the high-pressure air through the nozzles being tested. The flow pressure ranges from 0 - 120 psi and is controlled using a mechanical valve. The pressures are measured using an external sensor, and the mass flow rates are measured by a pair of rotameters connected in series right before the nozzle exhaust. Both of the nozzles tested have 10 ports, enabling pressure measurements throughout the length of the nozzle.
To begin the experiment, mount the converging nozzle in the center of the nozzle test rig. Then, use high-pressure PVC tubing to connect the 10 static pressure ports to the pressure measurement system, as well as the stagnation pressure port. Connect the pressure measurement system to the data acquisition interface to collect real-time data readings.
Now, take the zero flow condition pressure reading. Open the mechanical valve to start airflow. Then, adjust the flow using the mechanical valve in order to obtain a back-pressure ratio of 0.9. Record the stagnation pressure and atmospheric pressure from the pressure measurement system and the temperature from the temperature sensor. Record the gauge pressure of each pressure tap, making sure to note the tap number, axial position, and nozzle area ratio for each one based on geometry provided by the manufacturer.
Once the mass flow rate values are entered, push the 'Record Data' button to record all the readings at the set back-pressure ratio. Decrease the back-pressure ratio in steps of 0.1, down to a ratio of 0. 1, recording the measurements at each increment like before. Make sure to capture data at a back-pressure ratio of 0.5283, which is the theoretical choked flow condition.
When these tests have been completed, turn off the airflow, disconnect the PVC tubing, and replace the converging nozzle with the converging-diverging nozzle. Connect the ports to the measurement system, then repeat all of the measurements as described previously.
To analyze our data, first we calculate the pressure ratio across the nozzle using the static pressure measurement at each port. Recall that the back-pressure measurement was made at port 10. We can also calculate the Mach number at each port using this equation, where gamma is the specific heat.
Here, we've plotted the variation in pressure ratio and Mach number versus the normalized nozzle distance for each flow rate in our converging nozzle. At the throat, the Mach number does not exceed 1, meaning that the flow is choked. However, it should be noted that the data at the throat corresponds to port 9, which is slightly before the actual throat. Beyond the throat exit, there is uncontrolled expansion of the flow, leading to supersonic Mach numbers.
Next, using the data collected, we can calculate the mass flow parameter, MFP, using the equation shown. Here, m-dot is the mass flow rate through the nozzle, T-zero is the stagnation temperature, AT is the area of the throat, and p-zero is the stagnation pressure. The MFP increases with decreasing back-pressure ratio up until 0.6, which corresponds to expected behavior, as mass flow should increase as the back-pressure ratio decreases.
The MFP should then remain constant after 0.6, as the flow is choked at this point and the mass flow cannot increase. However, we observe a decrease in MFP in this region. This result is likely caused by the location of the tap measuring throat pressure, which is slightly before the true nozzle throat. This could be the most likely reason for the incorrect MFP reading.
Now, let's take a look at the converging-diverging nozzle, starting with the plot of pressure ratio and Mach number versus normalized nozzle distance. Observations of the Mach number variation across the nozzle show subsonic flow until the pressure ratio at the throat equals the choked flow condition of 0.5283. After this point, three distinct patterns are observed as back-pressure ratio is further reduced.
First, flow reaches the choked condition at the throat and decelerates subsonically in the diverging section. Second, flow accelerates supersonically beyond the throat and then decelerates, in some cases to subsonic velocities. Finally, we see that flow continues to accelerate supersonically for the entirety of the diverging section for back-pressure ratios lower than 0.3.
Finally, the plot of MFP shows an increase with decreasing back-pressure ratios, which peaks at 0.5283. This result is expected as flow increases up to the choked condition. As with the converging nozzle, the MFP should remain constant after reaching the choked flow condition, but we observe a decrease due to the location of the throat pressure tap.
In summary, we learned how varying cross sections of nozzles accelerate or decelerate flow in propulsion systems. We then measured the axial pressure along a converging and a converging-diverging nozzle, to observe variations in Mach number and pressure to deduce the flow patterns.
Subscription Required. Please recommend JoVE to your librarian.
Results
The following constants were used in the analysis: specific heat of dry air, γ: 1.4; reference nozzle area, Ai = 0.0491 in2, and standard atmospheric pressure, Patm = 14.1 psi. Figures 8 and 9 show the variation in pressure ratio and Mach number across the length of the nozzle (normalized based on total nozzle length) for various back-pressure settings for the converging and converging-diverging nozzles, respectively. The mass flow parameter versus the back-pressure ratio is also plotted and studied for both the nozzles.
From Figure 8, we observe that as the pB/pO ratio decreases(until 0.5283), flow at every section of the nozzle is subsonic and increases with decreasing area. At and below pB/pO = 0.5283, the Mach number at the throat (normalized nozzle distance = 0.93) does not exceed one. This clearly demonstrates that the flow is choked at the throat. Beyond the throat/nozzle exit, there is uncontrolled expansion of the flow, leading to supersonic Mach numbers. The overall trends in p/pO distribution matches theoretical trends from Figure 3. The trends in MFP follow theoretical results until pB/pO = 0.6 but start decreasing instead of plateauing for lower values of back-pressure ratios. Given that the flow is choked, the MFP should be constant. However, based on the location of the tap measuring the throat pressure (tap 9, Figure 6), we see that the measurements are taken slightly before the true nozzle throat that in turn leads to an incorrect measurement of the MFP.
For the converging-diverging nozzle (Figure 9), subsonic flow is observed until p/pO at the throat (normalized nozzle distance = 0.68) equals 0.5283 (choked flow condition). Further reduction of pB/pO shows three distinct patterns:
a. Pattern 1 - Flow reaches choked condition at the throat and decelerates subsonically in the diverging section (0.8 < pB/pO < 0.7).
b. Pattern 2 - Flow accelerates supersonically beyond the throat, forms a shock in the diverging section, and decelerates (in some cases to subsonic velocities) for 0.7 < pB/pO < 0.3.
c. Pattern 3 - Flow continues to accelerate supersonically for the entirety of the diverging section for pB/pO values lower than 0.3.
The MFP increases with decreasing back-pressure ratios, peaks at pB/pO = 0.5, and starts decreasing instead of remaining constant as predicted by theory.

Figure 8. Results for the converging nozzle (from top-right, clockwise) variation in pressure ratio across the nozzle; variation in Mach number across the nozzle; and variation in mass plow parameter with back-pressure ratio. Please click here to view a larger version of this figure.
Subscription Required. Please recommend JoVE to your librarian.
Applications and Summary
Nozzles are commonly used in aircraft and rocket propulsion systems as they offer a simple and effective method to accelerate flow in restricted distances. In order to design nozzles to suit a given application, an understanding of the flow behavior and factors that affect said behavior for a range of flow conditions is essential for designing efficient propulsion systems. In this demonstration, the converging and converging-diverging nozzles - two of the most common nozzle types used in aerospace applications - were tested using a nozzle test rig. The pressure and Mach number variations across the two nozzles were studied for a wide range of flow conditions.
Results for the converging nozzle tests showed that the maximum limit up to which flow can be accelerated is M = 1, at which point flow at the nozzle throat gets choked. Once flow is choked, any increase in inlet flow velocity did not increase the flow velocity at the throat/exit to supersonic speeds. Analysis of the converging-diverging nozzle provides insight into how supersonic flow velocities can be achieved once flow gets choked at the throat. We also observed three types of flows that can be obtained after the choked throat depending on the back-pressure ratio of the flow. A comparison of the pressure trends obtained for both the converging and converging-diverging type nozzles with theoretical results was excellent. However, the experimental results showed the mass flow parameter decreasing for lower values of back-pressure ratio instead of plateauing once the maximum value was achieved, as predicted by theory.

Figure 9. Results for the converging-diverging nozzle (from top-right, clockwise) variation in pressure ratio across the nozzle; variation in Mach number across the nozzle; and variation in mass plow parameter with back-pressure ratio. Please click here to view a larger version of this figure.
Subscription Required. Please recommend JoVE to your librarian.