

ERRATUM NOTICE
Important: There has been an erratum issued for this article. Read more …
Summary
This method describes the purification by flow cytometry of MEP and MKp from mice femurs, tibias, and pelvic bones.
Abstract
Bone marrow megakaryocytes are large polyploid cells that ensure the production of blood platelets. They arise from hematopoietic stem cells through megakaryopoiesis. The final stages of this process are complex and classically involve the bipotent Megakaryocyte-Erythrocyte Progenitors (MEP) and the unipotent Megakaryocyte Progenitors (MKp). These populations precede the formation of bona fide megakaryocytes and, as such, their isolation and characterization could allow for the robust and unbiased analysis of megakaryocyte formation. This protocol presents in detail the procedure to collect hematopoietic cells from mouse bone marrow, the enrichment of hematopoietic progenitors through magnetic depletion and finally a cell sorting strategy that yield highly purified MEP and MKp populations. First, bone marrow cells are collected from the femur, the tibia, and also the iliac crest, a bone that contains a high number of hematopoietic progenitors. The use of iliac crest bones drastically increases the total cell number obtained per mouse and thus contributes to a more ethical use of animals. A magnetic lineage depletion was optimized using 450 nm magnetic beads allowing a very efficient cell sorting by flow cytometry. Finally, the protocol presents the labeling and gating strategy for the sorting of the two highly purified megakaryocyte progenitor populations: MEP (Lin-Sca-1-c-Kit+CD16/32-CD150+CD9dim) and MKp (Lin- Sca-1-c-Kit+CD16/32-CD150+CD9bright). This technique is easy to implement and provides enough cellular material to perform i) molecular characterization for a deeper knowledge of their identity and biology, ii) in vitro differentiation assays, that will provide a better understanding of the mechanisms of maturation of megakaryocytes, or iii) in vitro models of interaction with their microenvironment.
Introduction
Blood platelets are produced by megakaryocytes. These large polyploid cells are located in the bone marrow and as for all blood cells they are derived from Hematopoietic Stem Cells (HSC)1. The classical pathway of production of megakaryocytes in the bone marrow originates from HSC and involves the generation of different progenitors that progressively restrict their differentiation potential2. The first progenitor signing the commitment to the megakaryocytic lineage is the Megakaryocyte-Erythrocyte Progenitor (MEP), a bipotent progenitor capable of producing both erythroid cells and megakaryocytes3,4,5. The MEP then produces a unipotent progenitor/precursor (MKp) that will differentiate into a mature megakaryocyte capable of producing platelets. The mechanisms involved in the generation of these progenitors, as well as their differentiation and maturation into megakaryocytes are complex and only partially understood. In addition, the heterogeneity of the MEP population in terms of differentiation potential and the intrinsic commitment level of these cells are still unclear. To decipher these processes, it is essential to obtain (or have access to) purified populations of MEP and MKp for fine molecular and single cell analyses.
Several studies have demonstrated particular combinations of cell surface markers for the identification of progenitors committed to the megakaryocytic lineage in the mouse6,7,8. From these a method was devised allowing the purification of MEP and MKp from mice. This method was optimized to obtain cells in adequate number and quality for a large number of assays. With ethical considerations in mind, and in order to minimize the number of animals involved in the experiments, we elicited to harvest the bone marrow from the femur and tibia, and also from the iliac crest. This bone contains a high frequency and number of hematopoietic progenitors and is most of the time damaged during long bone harvesting. Presented here is a detailed method for the reliable collection of this bone.
The second criteria of optimization is to produce highly purified cell populations. Fluorescent Activated Cell Sorting (FACS) is a method of choice in order to obtain purified populations of cells of interest. However, low yields are reached when the cell population of interest is very rare. Enrichment procedures are thus necessary. In this protocol, a negative selection procedure was opted using magnetic beads.
Subscription Required. Please recommend JoVE to your librarian.
Protocol
Protocols involving animals were performed in accordance with the CREMEAS Committee on the Ethics of Animal Experiments of the University of Strasbourg (Comité Régional d'Ethique en Matière d'Expérimentation Animale Strasbourg. Permit Number: E67-482-10).
1. Mouse bone collection
- Sacrifice the animal in compliance with the institutional guidelines.
NOTE: The data presented in this manuscript were obtained from C57Bl/6 mice of 8 to 12 weeks old. The number of cells obtained, and the frequency of cited populations may vary with age and mouse strain. - Spray the body with 70% ethanol.
- Using scissors, make a 0.5-1 cm incision of the skin perpendicular to the spine and tear the skin around the whole body. Pull down the skin from the lower body and remove the skin.
- Place the animal on the dissection pad, face down. Locate the pelvic bones by sliding your fingers along the exposed spine from the top to the bottom. To locate the iliac crest, identify the small bump in the lumbar region near the hindlimbs (the anterosuperior region of the pelvic bone). Figure 1A,B presents a schematic representation of the mouse anatomy.

Figure 1: Mouse anatomy. (A) Mouse X-Ray showing the hindlimb bones. Note the space between the pelvic bone and the spine (yellow arrow), where the scissors must be inserted to properly separate the hindlimbs from the body of the mouse (yellow dotted line). (B) Schematic representation of the bone marrow-rich bones of interest. The pelvic bones are depicted in red, the femurs in purple, and the tibias in green. (C) Schematic representation of the mouse pelvic bone. The ilium corresponds to the marrow-rich part of the pelvic bone and is highlighted in red. Please click here to view a larger version of this figure.
- Place the scissors parallel to the spine against the vertebrae and close to the iliac crest bump. Proceed to cut the muscles along the side of the spine above the pelvic bone by sliding the scissors along the vertebrae all the way down to the tail.
NOTE: This first section of muscles can also be performed using a scalpel blade. - Place the scissors parallel to the spine and proceed to cut between the vertebrae and the iliac crest, as indicated by the yellow dotted line on Figure 1A. Make sure to remain as close to the vertebrae as possible. Cut the remaining muscles to detach the limb from the body.
NOTE: There should be little to no resistance. - Repeat on the other side to detach the second limb.
- Transfer the limbs on a clean surface and discard the rest of the body in compliance with the institutional guidelines.
- Expose the pelvic, femoral, and tibial bones by removing as much surrounding tissue as possible with the forceps and the scalpels.
- Proceed to carefully dislocate the femoral head from the pelvic bone by holding the distal end of the femur with the forceps while gently slicing the muscles around the articulation with the scalpels. Wiggle the bones to facilitate the dislocation.
- Scrape off the remaining muscle from the pelvic bone and cut with a scalpel in the middle of the cavity that did hold the femur head. The ilium is kept as it is rich in hematopoietic progenitors while the triangular very thin side of the bone is discarded, as shown in Figure 1C.
- Remove the residual tissues around the ilium with the scalpel and place the cleaned bone in sterile PBS supplemented with 2% Newborn Calf Serum (PBS-2%NBCS).
- Using scissors, cut off the foot from the leg at the ankle.
- Hold the lower part of the tibia with the forceps and scrape the muscle up toward the knee. Discard the fibulae and cut across the tibial plateau with the scalpel. Place the tibia in sterile PBS-2%NBCS.
- Remove the residual tissues around the femur with scalpels.
- Hold the upper side of the femur with forceps; place the scalpel blade at the base of the kneecap. Apply a force toward the kneecap parallel to the femur until the detachment of the kneecap. Place the femur in sterile PBS-2%NBCS. Removal of the kneecap provides a clean access for inserting the needle for marrow flushing.
2. Magnetic depletion of lineage positive cells
- In a laminar flow cabinet, transfer the bones in a sterile Petri dish filled with sterile PBS-2%NBCS.
- With a scalpel cut off the head of the femurs.
- Fill a 1 mL syringe with sterile PBS-2%NBCS and attach a 21 G needle to the outlet.
- Fill a 5 mL polypropylene tube with 2 mL of sterile PBS-2%NBCS.
- Hold the femur with the forceps; gently insert the needle in the groove left after the kneecap removal. Apply rotation to the needle while inserting to avoid plugging of the needle. Ensure that the needle is completely inserted into the bone up to the bevel.
- Transfer the bone with the needle into the tube containing 2 mL of PBS-2%NBCS. Dispense and aspirate the PBS-2%NBCS from the syringe until the bone is clear.
- Remove the needle from the femur and insert it in the hole at opposite side where the femur head was. Dispense and aspirate the buffer again and discard the bone.
- For the iliac crest and tibia, hold the bone with the forceps; gently insert the needle in the open side. Apply rotation to the needle while inserting to avoid plugging of the needle. Ensure that the needle is completely inserted into the bone up to the bevel. Transfer the bone with the needle into the tube containing 2 mL of PBS-2%NBCS. Dispense and aspirate the PBS-2%NBCS from the syringe until the bone is clear. Discard the bones.
NOTE: Bones from up to three mice can be flushed into the same tube. Pool the cell suspensions. - Pass the pooled cell suspension through a 40 µm cell strainer cap placed onto a sterile 5 mL polystyrene tube.
- Proceed to count the cells.
NOTE: Cell count can be performed with any hemocytometer, using Trypan Blue for viability assessment, or with any automated cell counter. One mouse typically yields 105 ± 7 x 10⁶ cells. - Take aside 100 µL of the cell suspension as Total Bone Marrow, add 500 µL of PBS-2%NBCS and save it on ice for the staining procedure.
- Pellet the filtered suspension by centrifugation at 400 x g for 5 min at 4 °C and discard the supernatant.
NOTE: Red blood cells can be lysed by resuspending the pellet in freshly prepared Lysis Solution (1/10th in dH2O). Incubate for 5 min until the suspension becomes clear and bright red and add 10 volumes of sterile PBS. Proceed to wash the cells in PBS-2%NBCS by centrifugation at 400 x g for 5 mins at 4 °C. Be careful when removing the supernatant as the cell pellet is very loose. Perform a second wash with PBS-2%NBCS by centrifugation at 400 x g for 5 min at 4 °C and proceed to step 2.13. - Resuspend the cell pellet in freshly prepared primary antibody cocktail with a ratio of 100 µL per 1 x 10⁷ cells. Incubate on ice for 30-45 min.
| Antibody | Dilution |
| Gr-1-biotin | 1:500 |
| B220-biotin | 1:500 |
| Mac-1-biotin | 1:500 |
| CD3-biotin | 1:500 |
| CD4-biotin | 1:500 |
| CD5-biotin | 1:500 |
| CD8-biotin | 1:500 |
| TER119-biotin | 1:1000 |
| CD127-biotin | 1:500 |
Table 1.
- Take aside 10 µL of the cell suspension into a sterile 5 mL polystyrene tube labeled Lin-Pos Fraction. Add 90 µL of PBS-2%NBCS and save it on ice for the staining procedure.
- Proceed to wash the cells twice with sterile PBS-2%NBCS by centrifugation at 400 x g for 5 min at 4 °C. Make sure to do the last wash in a sterile 5 mL polypropylene tube.
- During the washing steps, prepare the beads for the magnetic depletion.
- Resuspend the beads in the vial by thoroughly vortexing for 30 s.
- Transfer a volume of beads corresponding to two beads per target cell into a 5 mL polypropylene tube.
- Wash the beads twice with PBS-2%NBCS by placing the tube on the magnet and removing the washing buffer using a sterile glass Pasteur pipette.
- Resuspend the beads in 500 µL of sterile PBS-2NBCS%.
- Resuspend the pellet of labeled cells in 250 µL of beads and mix gently for 5 min on ice. Add 2 mL of sterile PBS-2%NBCS and mix gently. Do not shake the tube.
- Place the tube onto the magnet for 2 min.
- Proceed to collect the non-magnetic fraction with a sterile glass Pasteur pipette and add it onto the remaining 250 µL of magnetic beads. Seal the tube with parafilm.
- Place the tube on a tube roller for 20 min at 4 °C.
- Add 2 mL of sterile PBS-2%NBCS and mix gently. Do not shake the tube.
- Place the tube in the magnet for 2 min.
- Proceed to collect the non-magnetic fraction into a sterile 5 mL polypropylene tube labeled Lin-Neg Fraction with a sterile glass Pasteur pipette.
- Pellet the cells by centrifugation at 400 x g for 5 min at 4 °C and remove the supernatant.
- Resuspend the non-magnetic cells in 500 µL of sterile PBS-2%NBCS.
- Proceed to count the cells.
NOTE: One mouse typically yields 3.9 ± 1.1 x 10⁶ cells. Typical lineage staining pre- and post- depletion are presented in Figure 2B.
3. Cell sorting of megakaryocyte progenitors by flow cytometry
- Take the tubes labeled Total Bone Marrow, Lin-Pos Fraction, and Lin-Neg Fraction.
- Proceed to split the content of the tube Total Bone Marrow equally into six sterile 5 mL polystyrene tubes. Label the tubes with the numbers 1-6.
- Proceed to label the tube Lin-Pos Fraction with the number 7.
- Proceed to split the content of the tube Lin-Neg Fraction as follows.
- Transfer 50 µL into a sterile 5 mL polystyrene tube containing 250 µL of sterile PBS-2%NBCS. Then, split its content equally into 3 sterile 5 mL polystyrene tubes. Label these tubes with the numbers 8-10.
- The remaining 450 µL of Lin-Neg Fraction cell suspension corresponds to the tube with the number 11.
- Add the antibodies to the tubes as described in Table 2.
| Tube | Label | Antibody cocktail |
| Total Bone Marrow | ||
| 1 | Unstained control | |
| 2 | Single stained control | CD45-FITC (1/200) |
| 3 | Single stained control | CD45-PE (1/200) |
| 4 | Single stained control | TER119-APC (1/200) |
| 5 | Single stained control | CD45-PECy7 (1/200) |
| 6 | Single stained control | CD45-APC-Cy7 biotin (1/200) |
| Lin-Pos Fraction | ||
| 7 | Single stained control | Single stained control. Streptavidin-APC-Cy7 (1/500) |
| Lin-Neg Fraction | ||
| 8 | FMO FITC control | c-kit-APC (1/200) + Sca-1-PE (1/200) + CD16/32-PE (1/200) + CD150-PECy7 (1/200) + Streptavidin-APC-Cy7 (1/500) |
| 9 | FMO PE control | CD9-FITC (1/200) + c-kit-APC (1/200) + CD150-PECy7 (1/200) + Streptavidin-APC-Cy7 (1/500) |
| 10 | FMO PECy7 control | CD9-FITC (1/200) + c-kit-APC (1/200) + Sca-1-PE (1/200) + CD16/32-PE (1/200) + Streptavidin-APC-Cy7 (1/500) |
| 11 | Positive tube for sorting | CD9-FITC (1/200) + c-kit-APC (1/200) + Sca-1-PE (1/200) + CD16/32-PE (1/200) + CD150-PECy7 (1/200) + Streptavidin-APC-Cy7 (1/500) |
Table 2.
- Incubate on ice for 30-45 min in the dark.
- Wash the cells with sterile PBS-2%NBCS by centrifugation at 400 x g for 5 min at 4 °C.
- Resuspend the cell pellets as follows.
- For the tubes 1 to 10, resuspend the pellet in 300 µL of sterile PBS-2%NBCS supplemented with 7AAD (2.5 µg/mL final) (PBS-7AAD).
CAUTION: 7AAD is a DNA intercalant and must therefore be handled with appropriate PPE (gloves). - For tube 11, resuspend the pellet in sterile PBS-7AAD at a maximum concentration of 5 x 10⁶ cells per mL and a minimum volume of 1 mL.
- For the tubes 1 to 10, resuspend the pellet in 300 µL of sterile PBS-2%NBCS supplemented with 7AAD (2.5 µg/mL final) (PBS-7AAD).
- Prepare two polypropylene collection tubes labeled MEP and MKp containing 2 mL of PBS-2%NBCS.
NOTE: Alternatively, cells can be collected into culture medium or cell lysis buffer depending on the subsequent application for the sorted cells. The use of polystyrene tubes is not recommended because of possible interference with the charged droplets containing the cells of interest. - Keep all tubes on ice in the dark.
- Proceed to the cell sorter set-up.
- Use the tubes 1-7 to set-up voltage and compensation, tubes 7-10 to determine the sorting gates for the cell populations of interest and tube 11 for cell sorting.
- The first steps of the gating strategy aim to exclude doublets and dead cells from the analysis, as described in Figure 3. Identify single viable cells and display SSC-vs Lin-APC-Cy7 dot plot to confirm the efficiency of the lineage depletion. From the Lin- cells a gate is set to select cells positive for c-kit and negative or dim for Sca-1 and CD16/32. A CD9 vs CD150 expression dot plot for the selected cells allows the identification of four populations.
NOTE: MEP and MKp cells are both positive for CD150. Three levels of expression for CD9 can be defined (neg, dim, and high). MKp express high level of CD9 and MEP express CD9 at an intermediate fluorescence intensity level. MEP population corresponds to Lin- c-Kit+ Sca-1-CD16/32-/dim CD150+ CD9dim and MKp population corresponds to Lin- c-Kit+ Sca-1-CD16/32-/dim CD150+ CD9bright. The discrimination between CD9 high and CD9 dim populations for the CD150 positive cells is set based on the maximum level of CD9 expression in the CD150 negative population. One mouse typically yields 5.3 ± 0.6 x 10³ MKp and 27.2 ± 2.4 x 10³ MEP.
Subscription Required. Please recommend JoVE to your librarian.
Representative Results
Phenotypic analysis of the cells identified as MEP and MKp were performed by flow cytometry. Cells were labeled with fluorescence conjugated antibodies to CD41a and CD42c, classical markers of the megakaryocytic and platelet lineages. Both markers were expressed by the cells of the MKp population while these markers are not yet detected at the surface of the cells of the MEP population (Figure 4Ai,4Aii). Polyploidy is a hallmark of megakaryocytes. The DNA content of the sorted populations was also analyzed and demonstrated that the cells are mostly 2N for the MEP population and a small proportion of the MKp cells are 4N, but higher ploidy are not significantly detected in these populations (Figure 4Aiii).
In order to confirm the identity of the sorted cell populations, several differentiation assays were performed to evaluate their capacity to differentiate toward the megakaryocytic and erythroid lineages. First, semi-solid clonogenic assays were performed to quantify megakaryocytic progenitor (CFU-MK) and erythroid progenitors (BFU-E). CFU-MK were detected in both MEP and MKp populations but not in the other population tested (Figure 4B). BFU-E were not detected in the MKp population but were detected in MEP population and the CD150-CD9dim cell population (Figure 4C).
The differentiation of the sorted cells was also followed in liquid culture in the presence of a low concentration of hematopoietic cytokines. Representative images from microscopic observation on the 3rd day of differentiation show that MEP and MKp produced mainly megakaryocytes that are identified as large cells (Figure 5Aiii,5Aiv). Megakaryocytes were identified using CD41 and CD42c expression and represent 53.9 ± 10.4% and 82.0 ± 2.0% of the cells produced from MEP and MKp cell populations, respectively (Figure 5B). Noticeably, the ploidy of the megakaryocytes produced analyzed using DNA marker Hoescht 33242, was greater for the megakaryocyte derived from MKp population compared to the MEP population suggesting a more mature state (Figure 5C). Finally, the cells produced from each population on the 3rd day were subjected to a proplatelet formation assay9. It was observed that only the cells derived from the MKp population were capable of proplatelet emission in this condition (Figure 5D). This suggests a more advanced maturation stage for the MKp population. Furthermore, when culture duration is extended up to 4-5 days, megakaryocytes generated from MEP will also extend proplatelets.

Figure 2: Magnetic depletion of lineage committed (Lin) cells. (A) Schematic representation of the magnetic depletion protocol. First, unsorted bone marrow cells are labeled with the biotin-conjugated rat anti-mouse antibody cocktail. Cells are then incubated with anti-rat Ig coated magnetic beads and subsequently subjected to the magnetic depletion using a strong magnet. The magnet will retain the labeled magnetic Lin+ fraction against the tube walls, while the unlabeled non-magnetic Lin- negative fraction will be collected in a new tube. (B) Lineage committed cells can be identified using fluorescent conjugated streptavidin. Typical analysis of the lineage expression in cells prior to magnetic depletion (total bone marrow) and after magnetic depletion (Lin- Fraction) N = 21. Please click here to view a larger version of this figure.

Figure 3: Cell sorting gating strategy. (A) Selection of the events corresponding to viable single cells. (B) MEP and MKp population selection. (i) The Lin Neg population is selected from the viable single cell events. (ii) Progenitors expressing c-kit and with low to no expression of Sca-1 or CD16/32 antigen are then selected. (iii) CD9 and CD150 expression levels define four cell populations. MKp are defined as CD9brightCD150+ cells, MEP are defined as CD9dimCD150+. The higher limit for the CD9 expression for the CD9dimCD150+ population is based on the maximum CD9 expression level for the CD150- cells. For the purpose of analysis, CD9dimCD150- cells (Progenitors) and CD9-CD150- (Double Negative: DN) were also sorted. (C) Cell sorting gates are based on Fluorescence Minus One (FMO) controls. (i) FMO control for CD9 gates (ii) FMO control for CD150 gates. Please click here to view a larger version of this figure.

Figure 4: Characterization of the MEP and MKp cell populations. (A) Flow cytometry analysis of (i) CD41 expression, (ii) CD42c expression and (iii) DNA content (Hoechst33342) in the CD9+CD150dim (MEP) and CD9+CD150bright (MKp) cell populations. (B) Quantification of CFU-MK from the sorted cell populations. CD9-CD150- (DN), CD9+CD150- (Prog), CD9+CD150dim (MEP), and CD9+CD150bright (MKp) cell populations were sorted and plated in collagen gel according to the manufacturer's instructions. (C) Quantification of BFU-E from the sorted cell populations. CD9-CD150- (DN), CD9+CD150- (Prog), CD9+CD150dim (MEP), and CD9+CD150bright (MKp) cell populations were sorted and plated in methyl cellulose gel according to the manufacturer's instructions. Please click here to view a larger version of this figure.

Figure 5: Differentiation potential of MEP and MKp. CD9-CD150-(DN), CD9+CD150-(Prog), CD9+CD150dim(MEP), and CD9+CD150bright(MKp) cell populations were cultured for three days in StemSpan medium supplemented with SCF (7.5 ng/mL), Flt-3 (5 ng/mL), IL-6 (1 ng/mL), and TPO (10 ng/mL). (A) Representative images were taken by phase-contrast microscopy. (B) The percentage of CD41+CD42c+ megakaryocytes was then assessed by flow cytometry. N = 3. (C) The ploidy level of the CD41+CD42c+ megakaryocytes was then evaluated with Hoechst by Flow cytometry. N = 3. (D) Cells produced at day 3 from CD9-CD150-(DN), CD9+CD150-(Prog), CD9+CD150dim(MEP), and CD9+CD150bright(MKp) cell populations were harvested and cultured in DMEM medium supplemented with 50 ng/mL TPO, 10 % Fetal Calf Serum, and 100 U/mL hirudin. (i) The proportion of proplatelet-forming megakaryocytes in the culture was determined by microscopic observation. Megakaryocytes were identified based on their size and/or the presence of proplatelets. N = 2. (ii) Representative photograph of a proplatelet bearing megakaryocyte by phase-contrast microscopy. Please click here to view a larger version of this figure.
Subscription Required. Please recommend JoVE to your librarian.
Discussion
The method described in this paper allows for the extraction and purification of mouse MEP and MKp. An important parameter in the optimization of the protocol was to obtain sufficient number of cells that would be compatible with most molecular- and cellular-based assays. The general practice of mouse bone collection for hematopoietic cell extraction usually consists in harvesting both the femurs and tibias of each mouse. The pelvic bone, another source of hematopoietic material, is thus often overlooked. The reasons for not collecting the iliac crest is the poor knowledge of the internal anatomy of the mouse skeleton and the fact that users are classically collecting hindlimbs by cutting across or just above the femur head. In addition, it is often assumed that the marrow cells would not be flushed out of the iliac crest bone efficiently due to the presence of trabeculae, which are absent in the central part of the tibia and femur. In this protocol, these two concerns are addressed and a standardized, reliable, and time-effective method is presented that allows for proper flushing of each hindlimb bones, including the pelvic bone. In particular, the use of the iliac bone yields 105 ± 7 x 10⁶ cells per mouse while the classical method usually yields 42 ± 5 x 10⁶ cells. A major benefit of this method is the reduction in the number of animals required to obtain a given number of target cells, thus providing more ethical and cost-effective experimental conditions. This procedure is therefore also applicable for any study requiring bone marrow cell suspension such as isolation of hematopoietic stem cells10 or the analysis of hematopoietic progenitor behavior in semi solid conditions11.
Cell sorting using flow cytometry is a powerful technique with a major advantage in term of purity when compared to magnetic enrichment techniques, but the yield of cell sorting for rare populations can be lower than for more abundant populations. Magnetic depletion of unwanted cells beforehand is therefore a useful method to increase the frequency of the cells of interest. Here, the magnetic depletion procedure differs from the manufacturer's recommendation and takes into consideration the heterogeneity in the expression of the surface markers used to remove the unwanted lineage positive cells. With the typical, one-step protocols, lineage positive cells with the highest expression of surface markers will quickly saturate the magnetic beads. They will prevent the subsequent capture of the remaining labeled cells by competition and steric hindrance, thus significantly reducing the depletion efficacy. To address this problem, a two-step magnetic depletion was designed that allows for the sequential removal of all lineage-positive cells, therefore allowing for stringent depletions suitable for cell sorting.
Another critical parameter to achieve an efficient depletion is the appropriate labeling conditions of the unwanted lineage-positive cells. The antibody titration has therefore been specifically optimized. Using higher concentrations of antibodies will result in excessive rosetting of the magnetic beads and the non-specific depletion of lineage-negative cells of interest. The use of highly purified MEP and MKp cell populations is an important tool in the study of megakaryopoiesis. In order to elucidate the mechanisms controlling this process, the study investigated the role of the cellular microenvironment and have shown that a fetal liver cell stromal cell population would support the differentiation of MKp10. The sorted population could also be used for molecular- or single cell-based analyses. This will be particularly relevant considering the emerging notion of megakaryocyte-biased HSC12,13,14. The production of megakaryocyte directly from the HSC population without the generation of a bipotent progenitor would be an emergency pathway in response to stress13.
Subscription Required. Please recommend JoVE to your librarian.
Disclosures
The authors declare no competing financial interests.
Acknowledgments
The authors wish to thank Monique Freund, Catherine Ziessel and Ketty for technical assistance. This work was supported by ARMESA (Association de Recherche et Développement en Médecine et Santé Publique), and by Grant ANR-17-CE14-0001-01 to Henri.de la.Salle.
Materials
| Name | Company | Catalog Number | Comments |
| 21-gauge needles | BD Microlance | 301155 | |
| 7AAD | Sigma-Aldrich | A9400 | |
| Antibody Gr-1-biotin | eBioscience | 13-5931-85 | Magnetic depletion |
| Antibody B220-biotin | eBioscience | 13-0452-85 | Magnetic depletion |
| Antibody Mac-1-biotin | eBioscience | 13-0112-85 | Magnetic depletion |
| Antibody CD3e-biotin | eBioscience | 13-0031-85 | Magnetic depletion |
| Antibody CD4-biotin | eBioscience | 13-9766-82 | Magnetic depletion |
| Antibody CD5-biotin | eBioscience | 13-0051-85 | Magnetic depletion |
| Antibody CD8a-biotin | eBioscience | 13-0081-85 | Magnetic depletion |
| Antibody TER119-biotin | eBioscience | 13-5921-85 | Magnetic depletion |
| Antibody CD127-biotin | eBioscience | 13-1271-85 | Magnetic depletion |
| Antibody CD45-FITC | eBioscience | 11-0451-85 | Cell sorting |
| Antibody CD45-PE | eBioscience | 12-0451-83 | Cell sorting |
| Antibody TER119-APC | eBioscience | 17-5921-83 | Cell sorting |
| Antibody CD45-PECy7 | eBioscience | 25-0451-82 | Cell sorting |
| Antibody CD45-biotin | eBioscience | 13-0451-85 | Cell sorting |
| Antibody CD9-FITC | eBioscience | 11-0091-82 | Cell sorting |
| Antibody c-kit-APC | eBioscience | 17-1171-83 | Cell sorting |
| Antibody Sca-1-PE | eBioscience | 12-5981-83 | Cell sorting |
| Antibody CD16/32-PE | eBioscience | 12-0161-83 | Cell sorting |
| Antibody CD150-PECy7 | eBioscience | 25-1502-82 | Cell sorting |
| Culture medium StemSpan-SFEM | Stemcell technologies | #09650 | |
| Dissection pad | Fisher Scientific | 10452395 | |
| DPBS | Life Technologies | 14190-094 | |
| Ethanol | vWR Chemicals | 83813.360 | |
| Forceps | Euronexia | P-120-AS | |
| Glass pasteur pipette | Dutscher | 42011 | |
| Magnet : DynaMag-5 | Thermo Fisher Scientific | 12303D | |
| Magnetic beads: Dynabeads Sheep Anti-Rat IgG | Thermo Fisher Scientific | 11035 | |
| Megacult | Stemcell technologies | #04970 | |
| MethoCult SF M3436 | Stemcell technologies | #03436 | |
| Newborn Calf Serum | Dutscher | 50750-500 | |
| Red Cell Lysis solution | BD Bioscience | 555899 | |
| Scalpels | Fisher Scientific | 12308009 | |
| Scissors | Euronexia | C-165-ASB | |
| Sterile 1 mL syringes | BD Bioscience | 303172 | |
| Sterile 15mL tubes | Sarstedt | 62.554.502 | |
| Sterile 5mL polypropylene tubes | Falcon | 352063 | |
| Sterile 5mL polystyrene tubes | Falcon | 352054 | |
| Sterile tubes with 70µm cell strainer cap | Falcon | 352235 | |
| Sterile petri dish | Falcon | 353003 | |
| Streptavidin-APC-Cy7 | BD Biosciences | 554063 | Cell sorting |
| Tube roller | Benchmark Scientific | R3005 |
References
- Kaushansky, K. Historical review: megakaryopoiesis and thrombopoiesis. Blood. 111 (3), 981-986 (2008).
- Akashi, K., Traver, D., Miyamoto, T., Weissman, I. L. A clonogenic common myeloid progenitor that gives rise to all myeloid lineages. Nature. 404 (6774), 193-197 (2000).
- Debili, N., et al. Characterization of a bipotent erythro-megakaryocytic progenitor in human bone marrow. Blood. 88 (4), 1284-1296 (1996).
- Forsberg, E. C., Serwold, T., Kogan, S., Weissman, I. L., Passegué, E. New evidence supporting megakaryocyte-erythrocyte potential of flk2/flt3+ multipotent hematopoietic progenitors. Cell. 126 (2), 415-426 (2006).
- Vannucchi, A. M., et al. Identification and characterization of a bipotent (erythroid and megakaryocytic) cell precursor from the spleen of phenylhydrazine-treated mice. Blood. 95 (8), 2559-2568 (2000).
- Pronk, C. J., et al. Elucidation of the phenotypic, functional, and molecular topography of a myeloerythroid progenitor cell hierarchy. Cell Stem Cell. 1 (4), 428-442 (2007).
- Nakorn, T. N., Miyamoto, T., Weissman, I. L. Characterization of mouse clonogenic megakaryocyte progenitors. Proceedings of the National Academy of Sciences of the United States of America. 100 (1), 205-210 (2003).
- Ng, A. P., et al. Characterization of thrombopoietin (TPO)-responsive progenitor cells in adult mouse bone marrow with in vivo megakaryocyte and erythroid potential. Proceedings of the National Academy of Sciences of the United States of America. 109 (7), 2364-2369 (2012).
- Strassel, C., et al. Hirudin and heparin enable efficient megakaryocyte differentiation of mouse bone marrow progenitors. Experimental Cell Research. 318 (1), 25-32 (2012).
- Brouard, N., et al. A unique microenvironment in the developing liver supports the expansion of megakaryocyte progenitors. Blood Advances. 1 (21), 1854-1866 (2017).
- Boscher, J., Gachet, C., Lanza, F., Léon, C. Megakaryocyte culture in 3D methylcellulose-based hydrogel to improve cell maturation and study the impact of stiffness and confinement. Journal of Visualized Experiments:JOVE. , (2021).
- Sanjuan-Pla, A., et al. Platelet-biased stem cells reside at the apex of the haematopoietic stem-cell hierarchy. Nature. 502 (7470), 232-236 (2013).
- Haas, S., et al. Inflammation-driven fast-track differentiation of HSCs into the megakaryocytic lineage. Experimental Hematology. 42 (8), 14 (2014).
- Shin, J. Y., Hu, W., Naramura, M., Park, C. Y. High c-Kit expression identifies hematopoietic stem cells with impaired self-renewal and megakaryocytic bias. The Journal of Experimental Medicine. 211 (2), 217-231 (2014).
Tags
Isolation Mouse Megakaryocyte Progenitors Lineage Hierarchy Cell Culture Molecular Assays Single Cell Level Ethical Practice Cell Sorting MEP MKP Populations Bone Collection C57 Black Six Mouse 70% Ethanol Incision Skin Dissection Pad Pelvic Bones Iliac Crest Lumbar Region Hind Limbs Muscles Vertebrae Tail Forceps ScalpelsErratum
Formal Correction: Erratum: Isolation of Mouse Megakaryocyte Progenitors
Posted by JoVE Editors on 07/28/2021.
Citeable Link.
An erratum was issued for: Isolation of Mouse Megakaryocyte Progenitors. A figure was updated.
Figure 2 was updated from:
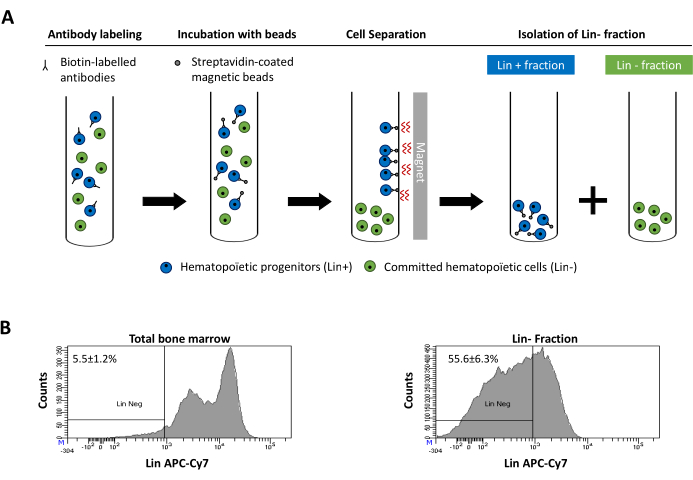
Figure 2: Magnetic depletion of lineage committed (Lin) cells. (A) Schematic representation of the magnetic depletion protocol. First, unsorted bone marrow cells are labeled with the biotin-conjugated rat anti-mouse antibody cocktail. Cells are then incubated with anti-rat Ig coated magnetic beads and subsequently subjected to the magnetic depletion using a strong magnet. The magnet will retain the labeled magnetic Lin+ fraction against the tube walls, while the unlabeled non-magnetic Lin- negative fraction will be collected in a new tube. (B) Lineage committed cells can be identified using fluorescent conjugated streptavidin. Typical analysis of the lineage expression in cells prior to magnetic depletion (total bone marrow) and after magnetic depletion (Lin- Fraction) N = 21. Please click here to view a larger version of this figure.
to:
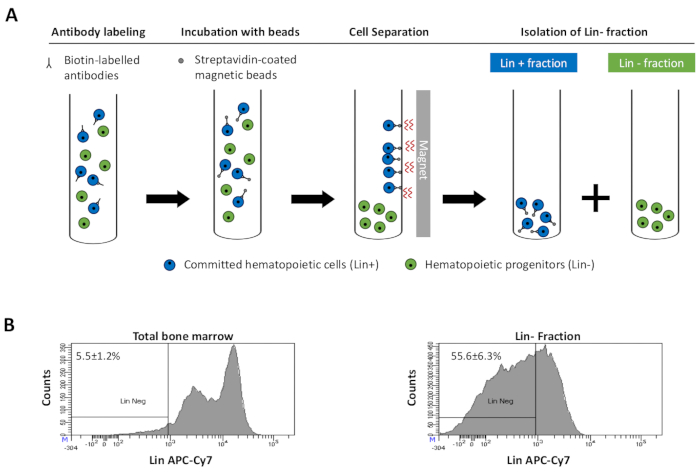
Figure 2: Magnetic depletion of lineage committed (Lin) cells. (A) Schematic representation of the magnetic depletion protocol. First, unsorted bone marrow cells are labeled with the biotin-conjugated rat anti-mouse antibody cocktail. Cells are then incubated with anti-rat Ig coated magnetic beads and subsequently subjected to the magnetic depletion using a strong magnet. The magnet will retain the labeled magnetic Lin+ fraction against the tube walls, while the unlabeled non-magnetic Lin- negative fraction will be collected in a new tube. (B) Lineage committed cells can be identified using fluorescent conjugated streptavidin. Typical analysis of the lineage expression in cells prior to magnetic depletion (total bone marrow) and after magnetic depletion (Lin- Fraction) N = 21. Please click here to view a larger version of this figure.
