Since the discovery of the green fluorescent protein gene, fluorescent proteins have impacted molecular cell biology. This protocol describes how expression of distinct fluorescent proteins through genetic engineering is used for barcoding individual cells. The procedure enables tracking distinct populations in a cell mixture, which is ideal for multiplexed applications.
Fluorescent proteins, fluorescent dyes and fluorophores in general have revolutionized the field of molecular cell biology. In particular, the discovery of fluorescent proteins and their genes have enabled the engineering of protein fusions for localization, the analysis of transcriptional activation and translation of proteins of interest, or the general tracking of individual cells and cell populations. The use of fluorescent protein genes in combination with retroviral technology has further allowed the expression of these proteins in mammalian cells in a stable and reliable manner. Shown here is how one can utilize these genes to give cells within a population of cells their own biosignature. As the biosignature is achieved with retroviral technology, cells are barcoded ´indefinitely´. As such, they can be individually tracked within a mixture of barcoded cells and utilized in more complex biological applications. The tracking of distinct populations in a mixture of cells is ideal for multiplexed applications such as discovery of drugs against a multitude of targets or the activation profile of different promoters. The protocol describes how to elegantly develop and amplify barcoded mammalian cells with distinct genetic fluorescent markers, and how to use several markers at once or one marker at different intensities. Finally, the protocol describes how the cells can be further utilized in combination with cell-based assays to increase the power of analysis through multiplexing.
Technologies such as fluorescence spectroscopy, fluorescence microscopy and flow cytometry, all rely on fluorescence, a property widely exploited in biochemical, biomedical, and chemical applications. Fluorescence, whether intrinsic or through labeling, has been exploited for the analysis of protein expression patterns and profiles, cell fate, protein interactions and biological functions1-9, and through fluorescence/Förster resonance energy transfer for the detection of biomolecule interactions and conformational changes10-13. Since the isolation of the Aequorea victoria green fluorescent protein (GFP)14, the discovery of additional naturally occurring fluorescent proteins from other cnidarians, particularly corals, has largely increased the number of existing fluorescent proteins with distinguishable excitation/emission spectra. These, together with the introduction of mutations in their genes15-19, have further expanded the possibilities, obtaining a true palette of fluorescent proteins available to scientists that exploit microscopy, flow cytometry and other fluorescence-based technologies for their research.
In parallel, although independently, the development of retroviral technology has drastically facilitated the stable expression of ectopic genetic information in mammalian cells20-23. It is thus not surprising that this technology has been used to transfer genes of fluorescent proteins into a broad number of cell types and tissues24-28 or for production of transgenic animals29-31. Following the nature of retroviruses, the genetic information of the ectopic fluorescent protein is introduced within the genome of the cell32 and the cell becomes fluorescent `for ever´. This property has allowed tracking of cell fate, or of a single cell within a population of cells. The now fluorescent cell has thus acquired its own biosignature and can be defined as barcoded. Its unique biosignature identifies it from other cells, and importantly, distinguishes it from cells genetically manipulated to express different fluorescent proteins with distinguishable absorption/emission spectra. Biological applications such as the tracking of reprogramming factors toward pluripotency33, the analysis of subnuclear factors for the elucidation of nucleolar localization34, the construction of fluorescent reporter plasmids for transcriptional studies35 or the genetic labeling of neurons for the study of neuronal network architecture36, are just four examples of the many that have exploited different fluorescent protein genes for the same experimental setup.
Flow cytometry has been broadly utilized for the analysis of biological processes at the single cell level, such as gene expression, cell cycle, apoptosis, and signaling through phosphorylation37-43.The stable expression of fluorescent protein genes in mammalian cells has further enhanced the utility of flow cytometry for cell analysis38,44 and ligand-receptor interactions45. Enhanced capabilities have allowed flow cytometry to become a widely utilized methodology for high-throughput and high-content screening46. Despite the now expanded number of fluorometers and robotics technologies that can couple plate reader systems, imaging and flow cytometry, there seems to be a lack in experimental design that can exploit and fit these enhanced technological capabilities.
Fast, reliable, simple and robust cell-based methodologies are drastically needed for multiplexed applications that further enhance high-throughput capacity. This is especially true in the field of drug discovery where engineering cell-based assays in a multiplexed format can enhance the power of high-throughput screening39,47-50. Multiplexing, as it allows simultaneous analyses in one sample, further enhances high-throughput capabilities51-54. Fluorescent genetic barcoding not only allows for elegant multiplexing, but also, once engineered, circumvents the need of time consuming protocols, reduces costs accompanied with antibodies, beads and stains39,52,55, and can reduce the number of screens required for high-throughput applications. We have recently described how retroviral technology can enhance multiplexing through fluorescent genetic barcoding for biological applications, by expressing an assay previously developed to monitor HIV-1 protease activity56,57 with different clinically prevalent variants58. The methodology is explained in a more descriptive manner focusing on how to select and amplify genetically fluorescent barcoded cells and how to produce panels of clonal populations expressing distinct fluorescent proteins and/or different fluorescence intensities. Panels of cell populations distinguishable based on their fluorescent characteristics enhance multiplexed capabilities, which can be further exploited in combination with cell-based assays that tackle different biological questions. The protocol also describes how to engineer a panel of barcoded cells bearing one of the cell-based assays previously developed in the laboratory, as example59. This protocol is thus not intended to show the well-established retroviral/lentiviral technology for genetic transfer, the value of fluorescent proteins or the applications of flow cytometry60,48 but rather to show the enhancing power of combining the three for multiplexed applications.
1. Preparation of Mammalian Cells, Viral Production and Transduction for Genetic Barcoding
2. Selection and Amplification of Genetically Barcoded Cells
3. Obtain Clonal Populations of Genetically Barcoded Cells at Different Intensities
4. Ensure Multiplexing Capabilities for High Throughput Screening (HTS)
5. Adapt Genetically Barcoded Cell Lines to the Biological Application of Choice
Multiplexing fluorescent genetically barcoded cells for the purpose of biological applications can only be achieved once individual clonal populations have been generated. Multiplexing is most effective when barcoded populations have clear distinct fluorescent characteristics with minimal spectral overlap. The example shown in Figure 1 with clonal populations of mammalian SupT1 cells illustrates that barcoded cells with mCherry and cyano fluorescent protein (CFP) can be easily analyzed simultaneously without losing their individual fluorescent characteristics. This matrix thus exemplifies a panel of fluorescent genetically barcoded cells that is usable for multiplexing biological applications with a readout in yet an additional available channel. In order to obtain such a panel it is important to remember the nature of retroviral technology, which will lead to variable ranges of fluorescent intensities within the population due to insertional effects and/or MOI. Figure 2 illustrates that initial transduction of mammalian cells with viral particles containing either td Tomato or E2 Crimson results in cells that express either one or both of the fluorescent proteins at a wide range of intensities (left panel). Selection and sorting of single cells into 96-well plates as shown by the gated boxes (mid panel), allows one to obtain tight clonal populations following expansion (right panel). A tight population should be defined as having a small CV which may range according to cell type, normally 30-40% in mean fluorescence intensity. Figure 2 also illustrates that to further increase the number of genetically barcoded populations with a matrix of only two fluorescent proteins, one can also exploit fluorescence intensity. Generally, one log deviation in the mean fluorescence intensity between populations is suitable for achieving appropriate separation from each other following sorting and amplification. Td Tomato was chosen in the shown example to illustrate this feature, where two populations of differing intensities, mid and high, were obtained for multiplexing with E2 Crimson at a single intensity.
Multiplexing is a powerful tool to facilitate the analysis of many samples at the same time and for the ability to decode masked populations. Enhancing multiplexing can be achieved with yet a third fluorescent protein such as eGFP, as long as spectral properties do not interfere with each other. In the experimental procedure illustrated in Figure 3 the panel of six populations obtained with td Tomato and E2 Crimson was exploited to increase multiplexing with eGFP. Retroviral technology was used to transfer eGFP to the populations represented in one of the matrices. When observed in the eGFP channel, the non-green naïve six-population matrix (upper left panel in Figure 3) is indistinguishable from the eGFP-transduced population matrix (lower left panel in Figure 3). Importantly, the panels can be analyzed in the channels occupied by the original genetic barcode (td Tomato and E2 Crimson). While indistinguishable in these channels (compare populations 1-6 with populations 7-12 in mid panels, Figure 3), the individual populations can be analyzed in the eGFP channel, and decoded or tracked back, as shown in the histograms (right panels in Figure 3). After repeating the process of transduction, selection, sorting, and amplification, taking advantage of the unoccupied channels is useless if right compensation is not applied to adjust for possible spectral overlap. To prove this, when populations 1, 2, 3 (non-green) and 7, 8, 9 (green) are analyzed in the eGFP and td Tomato channels, populations 7 and 8 are difficult to distinguish (left panel in Figure 4). It is thus necessary to choose naïve cells (population 1) as a negative control so that the parameters of the instrumentation can be set. When analyzing any matrix, especially with fluorophores that spectrally overlap, it is imperative that single color controls are used to determine the correct compensation values. In the analysis of Figure 4 populations 2 or 3, and 7 serve this purpose, allowing to better define populations that are truly double positive (populations 8 and 9).
Genetically barcoded cells with fluorescent markers retain their own identity as defined by their biosignature, when analyzed in the right fluorescent channel with the right instrument. However, the biosignature becomes just an additional individual property unless exploited for biological applications. In order to prove the power of fluorescent genetic barcoding for multiplexing we decided to introduce one of our previously developed assays for drug discovery into some of the fluorescent barcoded mammalian cell lines. By doing so, fluorescent genetic barcoding was exploited to achieve three assays in one sample. In this procedure a scaffold protein containing one of three putative viral substrate for proteolysis was transferred into the genetically barcoded cells. In the assay, cleavage is revealed by the loss of the FLAG epitope on the cell surface (Figure 5B). In contrast, FLAG surface staining represents lack of cleavage. Figure 5 illustrates the result of the analysis of three different substrates; HIV-1 Envelope wild type (Env wt), HIV-1 Envelope mutant (Env mut), and Dengue Virus (Denv) prM. Each of them was introduced into 1 of 3 barcoded cell lines, naïve, and 2 others utilizing td Tomato at different intensities (mid and high; Figure 5A). Staining for FLAG surface expression reveals which of the substrates was cleaved based on the respective barcode. In the example only HIV Env mut retains the FLAG tag (positive following staining), as seen in the green-FITC channel (Figure 5C, right bottom panel). The analysis of the assay can thus be performed independently of the original barcoding, and be further exploited to decode and track back the distinct populations. This method of multiplexing thus relies on an additional channel reserved for the biological readout of interest.
Figure 1: Barcoding for multiplexing. Individual populations genetically barcoded using distinct fluorescent proteins such as mCherry, CFP or both (left panel) can be mixed, analyzed, and decoded (right panel) in their respective channels via flow cytometry. Adapted from Smurthwaite, C. et al., 201458. Please click here to view a larger version of this figure.
Figure 2: Sorting and amplification of barcoded cells. Mammalian cells were analyzed 48 hr following transduction with viral particles containing either td Tomato or E2-Crimson (left panel). Gates are then set for sorting to include cells expressing td Tomato at different intensities, with/out E2-Crimson (middle panel). Clones from the sorts were amplified and re-analyzed to generate a matrix of six distinguishable populations (right panel). Please click here to view a larger version of this figure.
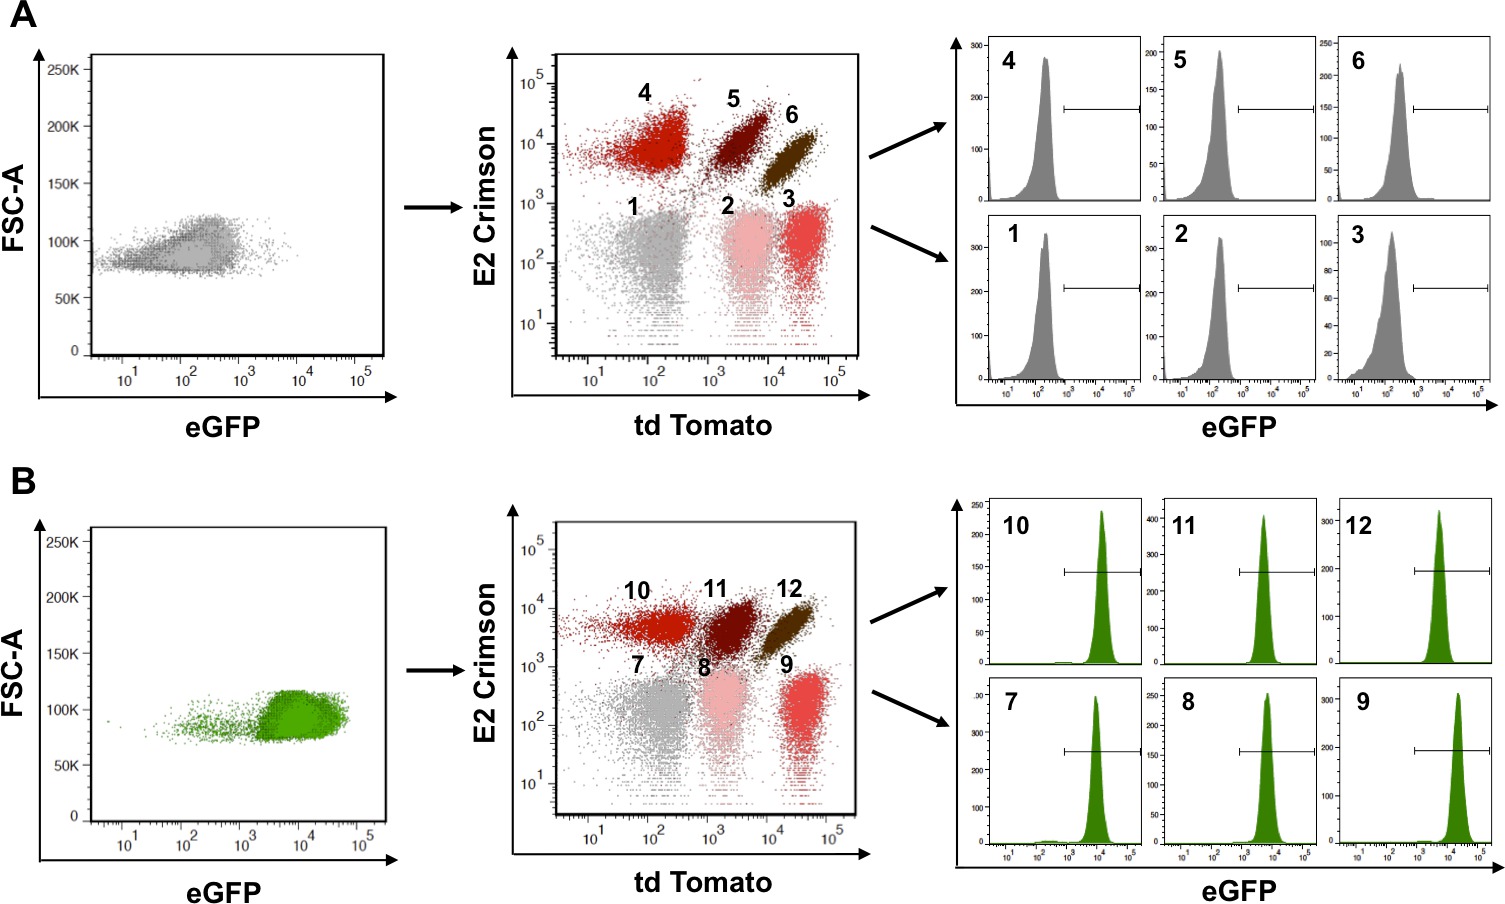
Figure 3: Decoding reveals masked populations. The matrix of six populations obtained in Figure 2 (td Tomato and/or E2-Crimson) can be further engineered to express an additional fluorescent protein such as eGFP. (A) The original matrix, when analyzed in the eGFP channel (left panel) is negative and the six populations are indistinguishable from each other. Each of the six populations can be independently analyzed in the eGFP channel as shown in the histograms (right panels). (B) The same matrix, now expressing also eGFP, was analyzed as in A, revealing now their green fluorescent characteristic. Adapted from Smurthwaite, C. et al., 201458. Please click here to view a larger version of this figure.
Figure 4: Compensation ensures correct separation. Some of the populations originally chosen based on td Tomato and/or eGFP expression (populations 7 and 8) cannot be properly separated when analyzed together (left panel) unless appropriate compensation for these channels is adjusted (right panel). Please click here to view a larger version of this figure.
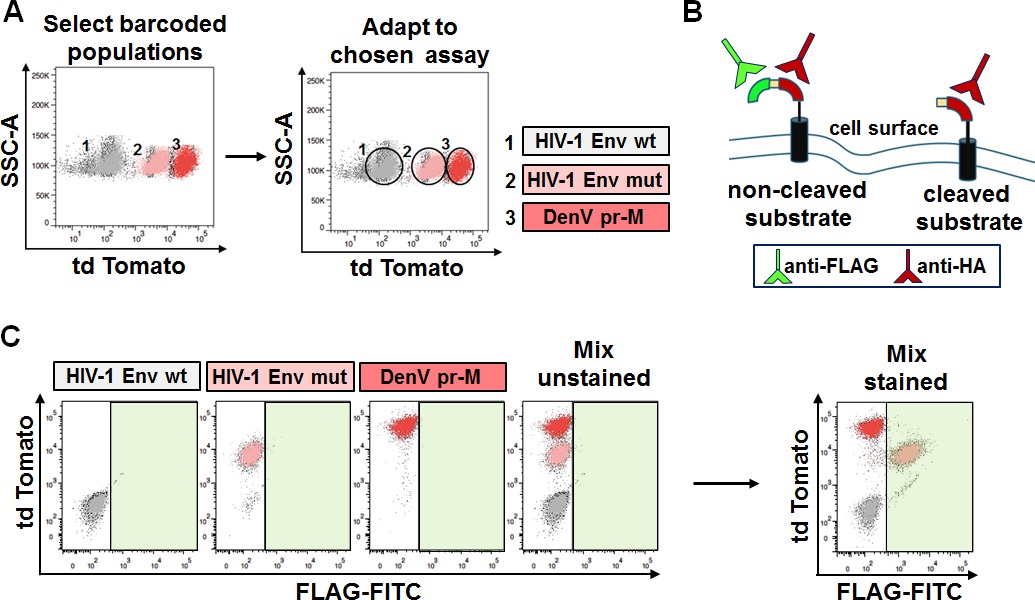
Figure 5: Selection of barcoded cells for further adaptation to chosen assay. (A) Selection and adaptation to assay of choice. Populations genetically barcoded with td Tomato at different intensities (top left panel) were used for biological applications. Each of the populations was further engineered to contain an assay that monitors cleavage, but each one of a different substrate (top right panel). (B) Depiction of the assay. Positive FLAG stain indicates lack of cleavage while negative FLAG stain indicates cleavage. (C) Analysis of the assay following FLAG staining. Mixed populations are distinguishable based on the td Tomato barcode but indistinguishable in the FITC channel (left panels). When stained with FLAG-FITC antibody, only one population is positive for FLAG. Decoding reveals, based on genetic barcoding, that this population bears the HIV Env mut substrate (right panel). Please click here to view a larger version of this figure.
Here two well-established procedures have been combined; genetic engineering through retroviral technology and detection of fluorescent proteins utilizing flow cytometry. Fluorescent protein-based genetic barcoding for the production of unique cell lines provides a robust and simple way for multiplexed applications. Generating genetically engineered barcoded cells through retroviral technology, is initially a lengthy process, but allows one to obtain, once established, a reliable and stable source of cell material. The nature of this technology consistently produces genetically engineered cell lines with steady fluorescent characteristics that become their own true distinguishable biosignature.
Both adherent and non-adherent cell types can be barcoded utilizing fluorescent proteins that are easily distinguishable based on their physical absorbance/emission spectra. These include, but are not restricted to proteins such as CFP, mCherry, E2 Crimson and td Tomato. Once genetically barcoded with their distinguishable fluorescent protein, they can be combined to produce a panel of cell populations. Importantly, the panel contains cell populations with the exact genotypic make-up but differentiated only by their fluorescence trait. As such, these panels are perfectly suited for multiplexed applications, greatly enhancing high-throughput capabilities.
Due to the different insertional preferences of the retroviral particle into the host genome, coupled with differences in MOI, variable fluorescence intensities from the carried particular fluorescent protein gene are expected. Analysis of a genetically engineered population carrying a unique fluorescent gene will thus detect a range of expression profiles that can be defined based on fluorescence intensity. This differential expression profile can be exploited to create populations that are spectrally distinct from one another. One can thus combine choice of fluorescent markers with fluorescence intensity to fit the experimental design. Here, matrices of 4, 6, and 12 populations, which include two 6 population panels of E2 Crimson and td Tomato, with or without eGFP, are shown. In theory, this can be further expanded with different intensities of eGFP as well to create populations of 3 different fluorescent proteins; each one with different intensities associated with it. As stated previously, consideration should be taken when choosing the fluorescent proteins in order to ensure that separation can indeed be achieved. Chosen proteins should have distinct absorbance and emission spectra; however, when two spectrally distinguishable but similar fluorescent proteins are used, compensation should be applied. Importantly, proper compensation, which allows for physical separation of emission/absorbance spectra among different fluorophores or fluorescent proteins, is accomplished with the use of appropriate single color controls for detection via flow cytometry.
Multiplexing with fewer fluorescent proteins but exploiting a variety of intensities frees additional channels that can be then further exploited for the biological application of interest. This can increase flexibility of the experimental set-up and simplify the choice of the combination of fluorescent markers to be used. For example, the multiplexed assay shown in Figure 5 relies on antibody staining, in this case coupled to FITC. As only the PE channel is occupied by genetic barcoding, one can utilize FITC-conjugated antibodies, or conversely, APC-coupled, a decision that can be made based on the appropriate instrumentation and/or antibody availability.
While the technological achievements in the field of flow cytometry, microscopy or combined methodologies are impressive, the bottleneck seems to be the available cell technology for biological applications and HTS. Retroviral technology coupled with the expanding number of fluorescent proteins can be merged to answer this query. Fluorescent genetic barcoding drastically facilitates multiplexing, which in turn, satisfies the increasing need for expanding HTS capabilities of cell-based assays. Genetic barcoding leads to a robust, cost effective, and simple way to couple cell-based assays with high-throughput methodologies for biological applications and drug screening. The power of performing one rather than three screens using a 3 population panel has beneficial cost and time related implications. With the growing versatility in flow cytometry, high-content imaging and flow-cytometry-coupled microscopy, fluorescent genetic barcoding will be a consistently reliable tool for assay development.
The authors have nothing to disclose.
We would like to thank Dr. Garry Nolan from Stanford University for providing the Phoenix GP packaging cell line for the production of retroviral particles. We thank Dr. Roger Tsien at University of California San Diego for providing td Tomato. We would also like to thank the San Diego State University Flow Cytometry Core Facility for their service and help.
Name of Material/ Equipment | Company | Catalog Number | Comments/Description |
10mL syringes | BD | 309604 | used for filtering the virus |
0.45µm plytetrafluoroethylen filter | pall corporation | 4219 | used for filtering the virus |
DMEM (Dulbecco's Modified Eagle Medium) | Corning | 45000-304 | cell growth media for HEK 293T cells |
PEI (Polyethylenimine) | poly sciences | 23966-2 | 2mg/mL concentration used |
Hanging bucket centrifuge (refrigerated) | Eppendorf | 5805 000.017 | used for spin infection |
PBS (phosphate buffered saline) | Corning | 21-040-CV | used for washing of cells |
Polybrene (hexadimethreen bromide) | Sigma-Aldrich | 107689 | Used to increase viral infection efficiency. Used at a 5µg/mL concentration. |
FACSAria | BD Biosciences | instrument used for sorting cell populations | |
FACSCanto | BD Biosciences | instrument used for cell analysis | |
Phoenix-GP | Gift from Gary Nolan | cell line used to produced retroviral particles | |
Fetal calf serum | Mediatech | MT35015CV | used for cell growth and sorting |
SupT1 cells | ATCC | CRL-1942 | Human T lymphoblasts |
HEK 293T cells | ATCC | CRL-11268 | Human Embryonic Kidney cells that also contain the SV40 large T-antigen |
RPMI 1640 | Corning | 10-040-CV | cell growth media for SupT1 cells |