Here, we present a protocol for cell transplantation of zebrafish skeletal muscle and embryonal rhabdomyosarcoma (ERMS) into adult immune compromised rag2E450fs homozygous mutant zebrafish. This protocol allows for the efficient analysis of regeneration and malignant transformation of muscle cells.
Method Article
Normal and Malignant Muscle Cell Transplantation into Immune Compromised Adult Zebrafish
* These authors contributed equally
In This Article
Summary
Abstract
Zebrafish have become a powerful tool for assessing development, regeneration, and cancer. More recently, allograft cell transplantation protocols have been developed that permit engraftment of normal and malignant cells into irradiated, syngeneic, and immune compromised adult zebrafish. These models when coupled with optimized cell transplantation protocols allow for the rapid assessment of stem cell function, regeneration following injury, and cancer. Here, we present a method for cell transplantation of zebrafish adult skeletal muscle and embryonal rhabdomyosarcoma (ERMS), a pediatric sarcoma that shares features with embryonic muscle, into immune compromised adult rag2E450fs homozygous mutant zebrafish. Importantly, these animals lack T cells and have reduced B cell function, facilitating engraftment of a wide range of tissues from unrelated donor animals. Our optimized protocols show that fluorescently labeled muscle cell preparations from α-actin-RFP transgenic zebrafish engraft robustly when implanted into the dorsal musculature of rag2 homozygous mutant fish. We also demonstrate engraftment of fluorescent-transgenic ERMS where fluorescence is confined to cells based on differentiation status. Specifically, ERMS were created in AB-strain myf5-GFP; mylpfa-mCherry double transgenic animals and tumors injected into the peritoneum of adult immune compromised fish. The utility of these protocols extends to engraftment of a wide range of normal and malignant donor cells that can be implanted into dorsal musculature or peritoneum of adult zebrafish.
Introduction
Zebrafish are an excellent model for regenerative studies because they can regenerate amputated fins, as well as a damaged brain, retina, spinal cord, heart, skeletal muscle and other tissues1. Stem cell and regenerative studies in adult zebrafish have largely focused on the characterization of regeneration in response to injury, while identification of stem and progenitor cells from various tissues by cell transplantation has only recently been explored2. Zebrafish have also become increasingly used for the study of cancer through the generation of transgenic cancer models that mimic human disease3–10.
In the setting of cancer, cell transplantation approaches have become widely adopted and permit the dynamic assessment of important cancer processes including self-renewal11, functional heterogeneity12,13, neovascularization14, proliferation, therapy responses15, and invasion16,17. However, engrafted cells are often rejected from recipient fish due to host immune defenses that attack and kill the graft18. Several methods have been used to overcome rejection of engrafted cells. For example, the recipient animals immune system can be transiently ablated by low dose gamma-irradiation prior to transplantation18,19. However, the recipient immune system will recover by 20 days post-irradiation and kill donor cells18. Alternatively, dexamethasone treatment has been used to suppress T and B cell function, providing longer immune suppressive conditioning and facilitating engraftment of a wide range of human tumors for up to 30 days14. These experiments require constant drug dosing and are limited to study of solid tumors. Long-term engraftment assays have used genetically-identical syngeneic lines20–22, where the donor and recipient cells are immune matched. However, these models require transgenic lines of interest to be crossed into the syngeneic background for more than four generations to produce fully syngeneic lines. To obviate issues of immune rejection in recipient fish, our group has recently developed an immune compromised rag2E450fs homozygous mutant (ZFIN allele designation rag2fb101) line that have reduced T and B cell function and which permit engraftment of a wide range of tissues23. Similar immune compromised mouse models have been used extensively for cell transplantation of mouse and human tissues24.
Here, we present methods for transplantation of skeletal muscle and embryonal rhabdomyosarcoma (ERMS), a pediatric sarcoma that shares features with skeletal muscle, into the newly described rag2 homozygous mutant zebrafish. The availability of an immune compromised adult zebrafish expands our ability to perform large-scale cell transplantation studies to directly visualize and assess stem cell self-renewal within normal and malignant tissues. With this method, fluorescently labeled muscle cell preparations from adult α-actin-RFP25 transgenic zebrafish robustly engraft in rag2 homozygous mutant zebrafish following injection into the dorsal musculature. Moreover, we demonstrate engraftment and expansion of primary myf5-GFP; mylpfa-mCherry transgenic ERMS following intraperitoneal injection into rag2E450fs homozygous mutant zebrafish. The utility of these protocols goes beyond the examples shown and can be easily applied to additional zebrafish regenerative tissues and cancers.
Protocol
All animal procedures were approved by Massachusetts General Hospital Subcommittee on Research Animal Care, under protocol #2011N000127.
Section 1. Skeletal Muscle Cell Transplantation into Adult rag2E450fs Homozygous Mutant Zebrafish
1. Preparation of Adult Zebrafish Donor Skeletal Muscle Cells
- Obtain transgenic adult zebrafish that have fluorescently labeled muscle. In this experiment, 30 α-actin-RFP donor fish25 were utilized to transplant 1 x 10⁶ cells per recipient fish.
- Sacrifice donor zebrafish in 1.6 mg/ml tricaine methanesulfonate (MS222) for 10 min or until no operculum movement is evident.
- Place donor fish on an absorbent paper towel and excise the dorsal muscle using a clean razor blade. The cut should be made near the anus at a 45° angle to maximize tissue collection (as noted in Figure 1A). Place dissected tissue into a clean 10 cm Petri dish.
- Add 500 μl suspension buffer (pre-chilled 0.9x Phosphate Buffer Saline (PBS) supplemented with 5% Fetal Bovine Serum (FBS)) to the dissected tissue. Up to 10 donor zebrafish can be placed together in this volume.
- Mince the tissue with a razor blade >20 times until cells are in a uniform suspension. The entire dorsal musculature is homogenized including skin, bones and fins. Add 2 ml of suspension buffer. Using a 5 ml pipette, triturate the cell suspension ≥20 times to dissociate cells.
- Filter the cell suspension through a 40 μm mesh strainer into a 50 ml conical tube placed on ice.
- Wash the Petri dish with an additional 2.5 ml of suspension buffer to collect remaining tissue and filter through the same strainer and conical tube, to a final volume of 5 ml (10 donor fish can be used per isolate).
NOTE: Skin, bones and fins will be excluded following filtration. - If applicable, combine similar suspensions into the same conical tube.
- Count the total number of viable cells using trypan blue dye and a hemocytometer.
- Reserve 500 μl for flow cytometry, if desired (optional, step 2).
- Centrifuge cell suspension at 1,000 x g, for 10 min, at 4 °C.
- Discard supernatant and resuspend cells at 3.33 x 10⁵ cells/μl (0.9x PBS + 5% FBS). In total, 3 μl will be injected per recipient fish for a total of 1 x 10⁶ cells per recipient (step 3).
NOTE: Less than 3 μl of cell suspension should be transplanted into the recipient fish. If cell number is limiting, as low as 5 x 10⁴ cells per recipient can lead to successful engraftment (Table 1).
2. Flow Cytometry Analysis of Donor Skeletal Muscle Cell Preparation (Optional)
- Isolate muscle from a wild type, non-transgenic fish as outlined in step 1.1. This sample serves as the negative control and is useful for setting Flow Cytometry gates.
- Add an appropriate viability dye. For example, add 5 μl of stock DAPI solution (500 ng/μl) to 500 μl of muscle preparation. Vortex slightly prior to analysis. Acquire 5 x 10³ to 1 x 10⁴ events. Analyze wild type control samples first to place gates followed by analysis of muscle cells isolated from transgenic fish.
NOTE: Flow cytometry analysis is usually performed within 1 hr after muscle tissue dissection, during which time the dissected cells retain more than 60% viability (Figure 2). Cells should be kept on ice at all times. Total cell viability can be re-assessed prior to transplantation using trypan blue dye and a hemocytometer.
3. Intramuscular Transplantation of Skeletal Muscle Cells into Adult rag2 Homozygous Mutant Zebrafish
- Clean a 10 μl 26S G micro-syringe by drawing in and expelling 10% bleach solution (5 times), followed by 70% ethanol (5 times), and then followed by suspension buffer (0.9x PBS + 5% FBS, 10 times).
- Anesthetize 2-4 month old homozygous rag2 mutant fish or wild type recipient fish (as controls) by adding single drops of tricaine methanesulfonate (MS222, 4 mg/ml stock solution) into a Petri dish containing the fish in system water until operculum movements slow and fish are still.
NOTE: Dose of tricaine anesthesia will depend on age and size of recipient zebrafish. - Place anesthetized recipient zebrafish on a damp paper towel or sponge, with the left side facing up.
- Insert the syringe needle into the latero-dorsal musculature (refer to Figure 1A). Ensure that injections are performed at a 45° angle. Inject 3 μl of the cell suspension (prepared in step 1.12) per fish for a total of 1 x 10⁶ cells per recipient.
- Carefully transfer injected zebrafish into a clean tank using a plastic spoon to recover.
- Assess recipient zebrafish for engraftment rates at 10, 20, 30 days post-transplantation by imaging anesthetized fish under bright field and epifluorescence microscopy.
Section 2. Embryonal Rhabdomyosarcoma (ERMS) Transplantation into Adult Homozygous rag2 Mutant Zebrafish
4. DNA Microinjection of Zebrafish Embryos
- Linearize the rag2-kRASG12D plasmid7 by digesting 10 μg of DNA with XhoI, at 37 °C for 6 hr or O/N.
- Purify DNA by standard phenol:chloroform extraction and precipitate with ethanol. Resuspend in 20 μl of deionized water (alternatively, commercial DNA fragment purification columns can be used).
- Run the undigested and digested DNA on a 1% agarose gel and determine the concentration of DNA by spectrometer reading. Alternatively, run samples at 1:1, 1:5, and 1:10 dilutions on a 1% agarose gel and quantify compared to a DNA ladder.
- Prepare an injection mix at a final concentration of 15 ng/μl of digested rag2-kRASG12D DNA in 0.1 M KCl and 0.5x Tris-EDTA. The final DNA amount injected in 2 nl of injection volume will be 30 pg.
NOTE: Up to three different DNA constructs can be efficiently co-injected in a maximum of 60 pg of DNA per embryo. These transgenes become integrated into the genome and co-expressed within the developing tumor26. - Inject linearized rag2-kRASG12D into one-cell stage embryos essentially as described27 into a zebrafish strain of interest (Figure 1B). Injections should be performed in the cell and not in the yolk for higher efficiency. In this experiment, a double transgenic AB-strain; myf5-GFP, mylpfa-mCherry was used. Raise zebrafish using standard rearing protocols28.
NOTE: Injection survival is often dependent upon the zebrafish strain used. On average, 30% of injected embryos will develop ERMS. 300-600 embryos should be injected per experiment in order to ensure that enough GFP-positive and mCherry-positive primary tumors are generated for transplantation and analysis.
5. Screening for Primary ERMS in Zebrafish Larvae
- Observe injected zebrafish from 10 to 30 days post injection for the emergence of externally visible primary ERMS.
- At 30 days post injection, anesthetize recipient zebrafish by adding single drops of tricaine methanesulfonate (MS222 4 mg/ml stock solution) into a Petri dish containing fish system water until operculum movements slow and fish are still.
NOTE: Dose of tricaine anesthesia will depend on the age and size of recipient zebrafish. Primary tumor-bearing zebrafish require lower doses of tricaine. - Select primary ERMS-bearing fish that are myf5-GFP-positive and mylpfa-mCherry-positive, using an epifluorescence microscope.
6. ERMS Tumor Preparation
- Sacrifice selected primary ERMS-bearing zebrafish in 1.6 mg/ml tricaine methanesulfonate (MS222) for 10 min or until no operculum movement is evident.
- Process each tumor-bearing zebrafish separately. Place fish in a clean Petri dish and dissect around the tumor using a razor blade and fine forceps (as shown in Figure 1B). Transfer the dissected tumor tissue to a clean Petri dish.
- Add 100 μl of pre-chilled 0.9x Phosphate Buffer Saline (PBS) supplemented with 5% Fetal Bovine Serum (FBS). Mince tissue with a clean razor blade >20 times until cells are in a uniform suspension.
- Add 900 μl of the same buffer (0.9x PBS + 5% FBS), pipette up and down several times to dissociate cells using a 1000 μl filtered pipette tip. Filter through a 40 μm mesh strainer into the corresponding 50 ml conical tube. Store on ice.
- Wash the Petri dish with an additional 2-4 ml of buffer, and pass through the same mesh strainer and into the corresponding conical tube.
- Centrifuge at 1,000 x g, for 10 min, at 4 °C.
- Discard supernatant and resuspend in 100 μl of buffer.
- Count the total number of viable cells using trypan blue dye and a hemocytometer.
- Dilute cells to desired concentration in the same buffer (0.9x PBS + 5% FBS). Cells should be diluted to 5 x 10³ cells/μl for transplanting 5 μl per recipient zebrafish in a total of 2.5 x 10⁴ cells per recipient.
- Flow Cytometry analysis can also be performed with a small amount of the suspension from step 6.5 to quantize the relative ratios of fluorescent cells within the sample.
NOTE: Set aside 100 μl of cell suspension (following filtering in step 3.5) and dilute with 400 μl of 0.9x PBS + 5% FBS suspension buffer for Flow Cytometry analysis. To ensure proper gating, perform additional analysis using single transgenic tumor tissue or muscle isolated from adult wild type, myf5-GFP and mylpfa-mCherry fish. Perform Flow Cytometry essentially as described in step 2 of Section 1.
7. Transplantation of ERMS into Adult rag2 Homozygous Mutant Zebrafish
- Clean a 10 μl 26S G micro-syringe by drawing in and expelling 10% bleach solution (5 times), followed by 70% ethanol (5 times), and then followed by suspension buffer (0.9x PBS + 5% FBS, 10 times).
- Anesthetize recipient homozygous rag2 mutant fish by adding single drops of tricaine methanesulfonate (MS222 4 mg/ml stock solution) into a Petri dish containing the fish in system water until operculum movements are slow and fish are still.
- Place anesthetized recipient zebrafish on a wet paper towel or sponge, with the ventral side facing up.
- Inject 5 μl of the cell suspension into the peritoneal cavity (2.5 x 10⁴ cells per recipient).
NOTE: The injection needle should be cleaned between injections of different tumors as described in step 4.1. 5 to 10 μl can be efficiently transplanted intraperitoneally, depending on recipient fish size. Tumor engraftment can be accomplished by injecting 1 x 10⁴ to 5 x 10⁵ unsorted cells per recipient fish (Table 1). - Carefully place recipient zebrafish into a clean tank with a plastic spoon.
- Assess recipient zebrafish for engraftment rates at 10, 20, 30 days post-transplantation by imaging anesthetized fish under bright field and epifluorescence microscopy.
- Utilize engrafted fish for downstream applications including Fluorescence Activated Cell Sorting (FACS) to assess differentiation status (Figure 3H), standard histological analysis (Figure 3F), imaging therapy responses15, and/or serial transplantation approaches including limiting dilution analysis11.
Results
A procedure for preparing and transplanting skeletal muscle cells from α-actin-RFP transgenic donors into immune compromised homozygous rag2 mutant zebrafish has been demonstrated (Protocol Section 1, Figure 1A and Figure 2). Skeletal muscle tissue was prepared from α-actin-RFP transgenic donors and the resulting single cell suspension contained 84.3% viable cells as assessed by DAPI exclusion following Flow Cytometry analysis (Figure 2B). RFP-positive cells comprised 35.3% of this single cell suspension (Figure 2C). Transplantation of cells into the dorsal skeletal muscle of rag2 homozygous mutant recipient fish led to consistent and strong engraftment as assessed by differentiation of single cells into multinucleated fibers (1 x 10⁶ cells injected per fish, Table 1, Figure 2D-I). Wild type recipient fish failed to engraft muscle fibers over the 30-day experiment (n = 13). By 10 days post transplantation, 9 out of 14 rag2 homozygous mutant zebrafish contained RFP-positive muscle fibers near the site of injection (64.3%, Figure 2E,F). Importantly, engrafted RFP-positive muscle persisted to 30 days post-transplantation (Figure 2G-I), with a subset of animals being followed for 115 days post-engraftment and exhibiting robust and persistent muscle engraftment (data not shown). These results are similar to those reported previously by our group23 using the same protocol (Table 1).
We have also presented a method for the generation, preparation and transplantation of ERMS tumor cells into the peritoneal cavity of rag2 homozygous mutant recipient fish (Protocol Section 2, Figure 1B and Figure 3). ERMS were generated in double transgenic myf5-GFP; mylpfa-mCherry fish that have been shown to allow the visualization of intra-tumoral heterogeneity and functional analysis of tumor cell subpopulations following transplantation11. However, further molecular characterization of each subpopulation is difficult because fish are small when they develop ERMS between 10 to 30 days of life and the number of tumor cells are limiting for downstream applications. One solution is to expand tumor cell numbers by engrafting ERMS into adult recipient zebrafish. To date, similar experiments have been completed using CG1-strain syngeneic fish and required in excess of 4 generations of backcrossing to develop syngeneic lines that were transgenic for myf5-GFP; mylpfa-mCherry. To circumvent these issues, we demonstrated the utility of immune compromised rag2 homozygous mutant recipient zebrafish to engraft primary ERMS from a AB-strain zebrafish. All primary ERMS engrafted into rag2 homozygous mutant animals, facilitating expansion of the tumor (Table 1). Similar results were recently reported where 24 of 27 rag2 homozygous mutant zebrafish engrafted ERMS, while 0 of 7 wild type siblings engrafted disease23. A representative example of an engrafted ERMS is shown at 30 days post-transplantation in Figure 3E. Engrafted ERMS share histological features of embryonal rhabdomyosarcoma, similar to that found in the primary tumor (Figure 3B and 3F). FACS analysis confirmed that ERMS contained functionally distinct tumor propagating cells and differentiated cells that express myf5-GFP and/or mylpfa-mCherry. Survival rates following the intraperitoneal injection procedure were in excess of 95%. Recipient zebrafish commonly succumb from tumor burden after the 30 days post-transplantation time point.

Figure 1. Protocol schematic for (A) normal and (B) malignant skeletal muscle cell transplantation into rag2 homozygous mutant zebrafish. Optional steps are marked with (*).

Figure 2. Skeletal muscle engraftment into rag2 homozygous mutant zebrafish. (A) α-actin-RFP transgenic donor zebrafish. (B) Cell viability of isolated muscle cell suspension as assessed by DAPI dye exclusion and flow cytometry. (C) Proportion of RFP-positive cells found within the muscle cell suspension from α-actin-RFP donor (red), compared to a wild type control (grey). (D-E) Merged bright field and fluorescent images of wild type animals (D) or rag2 homozygous mutant fish (E) at 30 days post-transplantation. (F) Engraftment rates over time. Red denotes number of engrafted animals while grey shows non-engrafted fish. Number of animals analyzed at each time point are indicated. (G-I) High magnification images of boxed region in panel E shown at 10 (G), 20 (H) and 30 (I) days post-transplantation, showing retention of differentiated muscle fibers over time (arrowheads). Scale bars equal 2 mm. Please click here to view a larger version of this figure.

Figure 3. Transplantation of myf5-GFP; mylpfa-mCherry ERMS into rag2 homozygous mutant zebrafish. (A-D) rag2-kRASG12D induced primary ERMS arising in AB-strain myf5-GFP; mylpfa-mCherry zebrafish at 30 days of life. (E-H) rag2 homozygous mutant zebrafish engrafted with ERMS and analyzed at 30 days post-transplantation. (A, E) Merged bright field and fluorescent images of primary and transplanted ERMS. Tumor area is outlined and arrowhead indicates injection site in E. (B, F) Hematoxylin- and eosin-stained paraffin sections of primary (B) and engrafted ERMS (F) showing areas of increased cellularity associated with cancer. (C, G) Cell viability as assessed by DAPI dye exclusion and flow cytometry. (D, H) Fluorescent tumor cell sub-populations, as assessed by flow cytometry. Scale bars equal 2 mm (A, E) and 50 μm (B, F). Please click here to view a larger version of this figure.
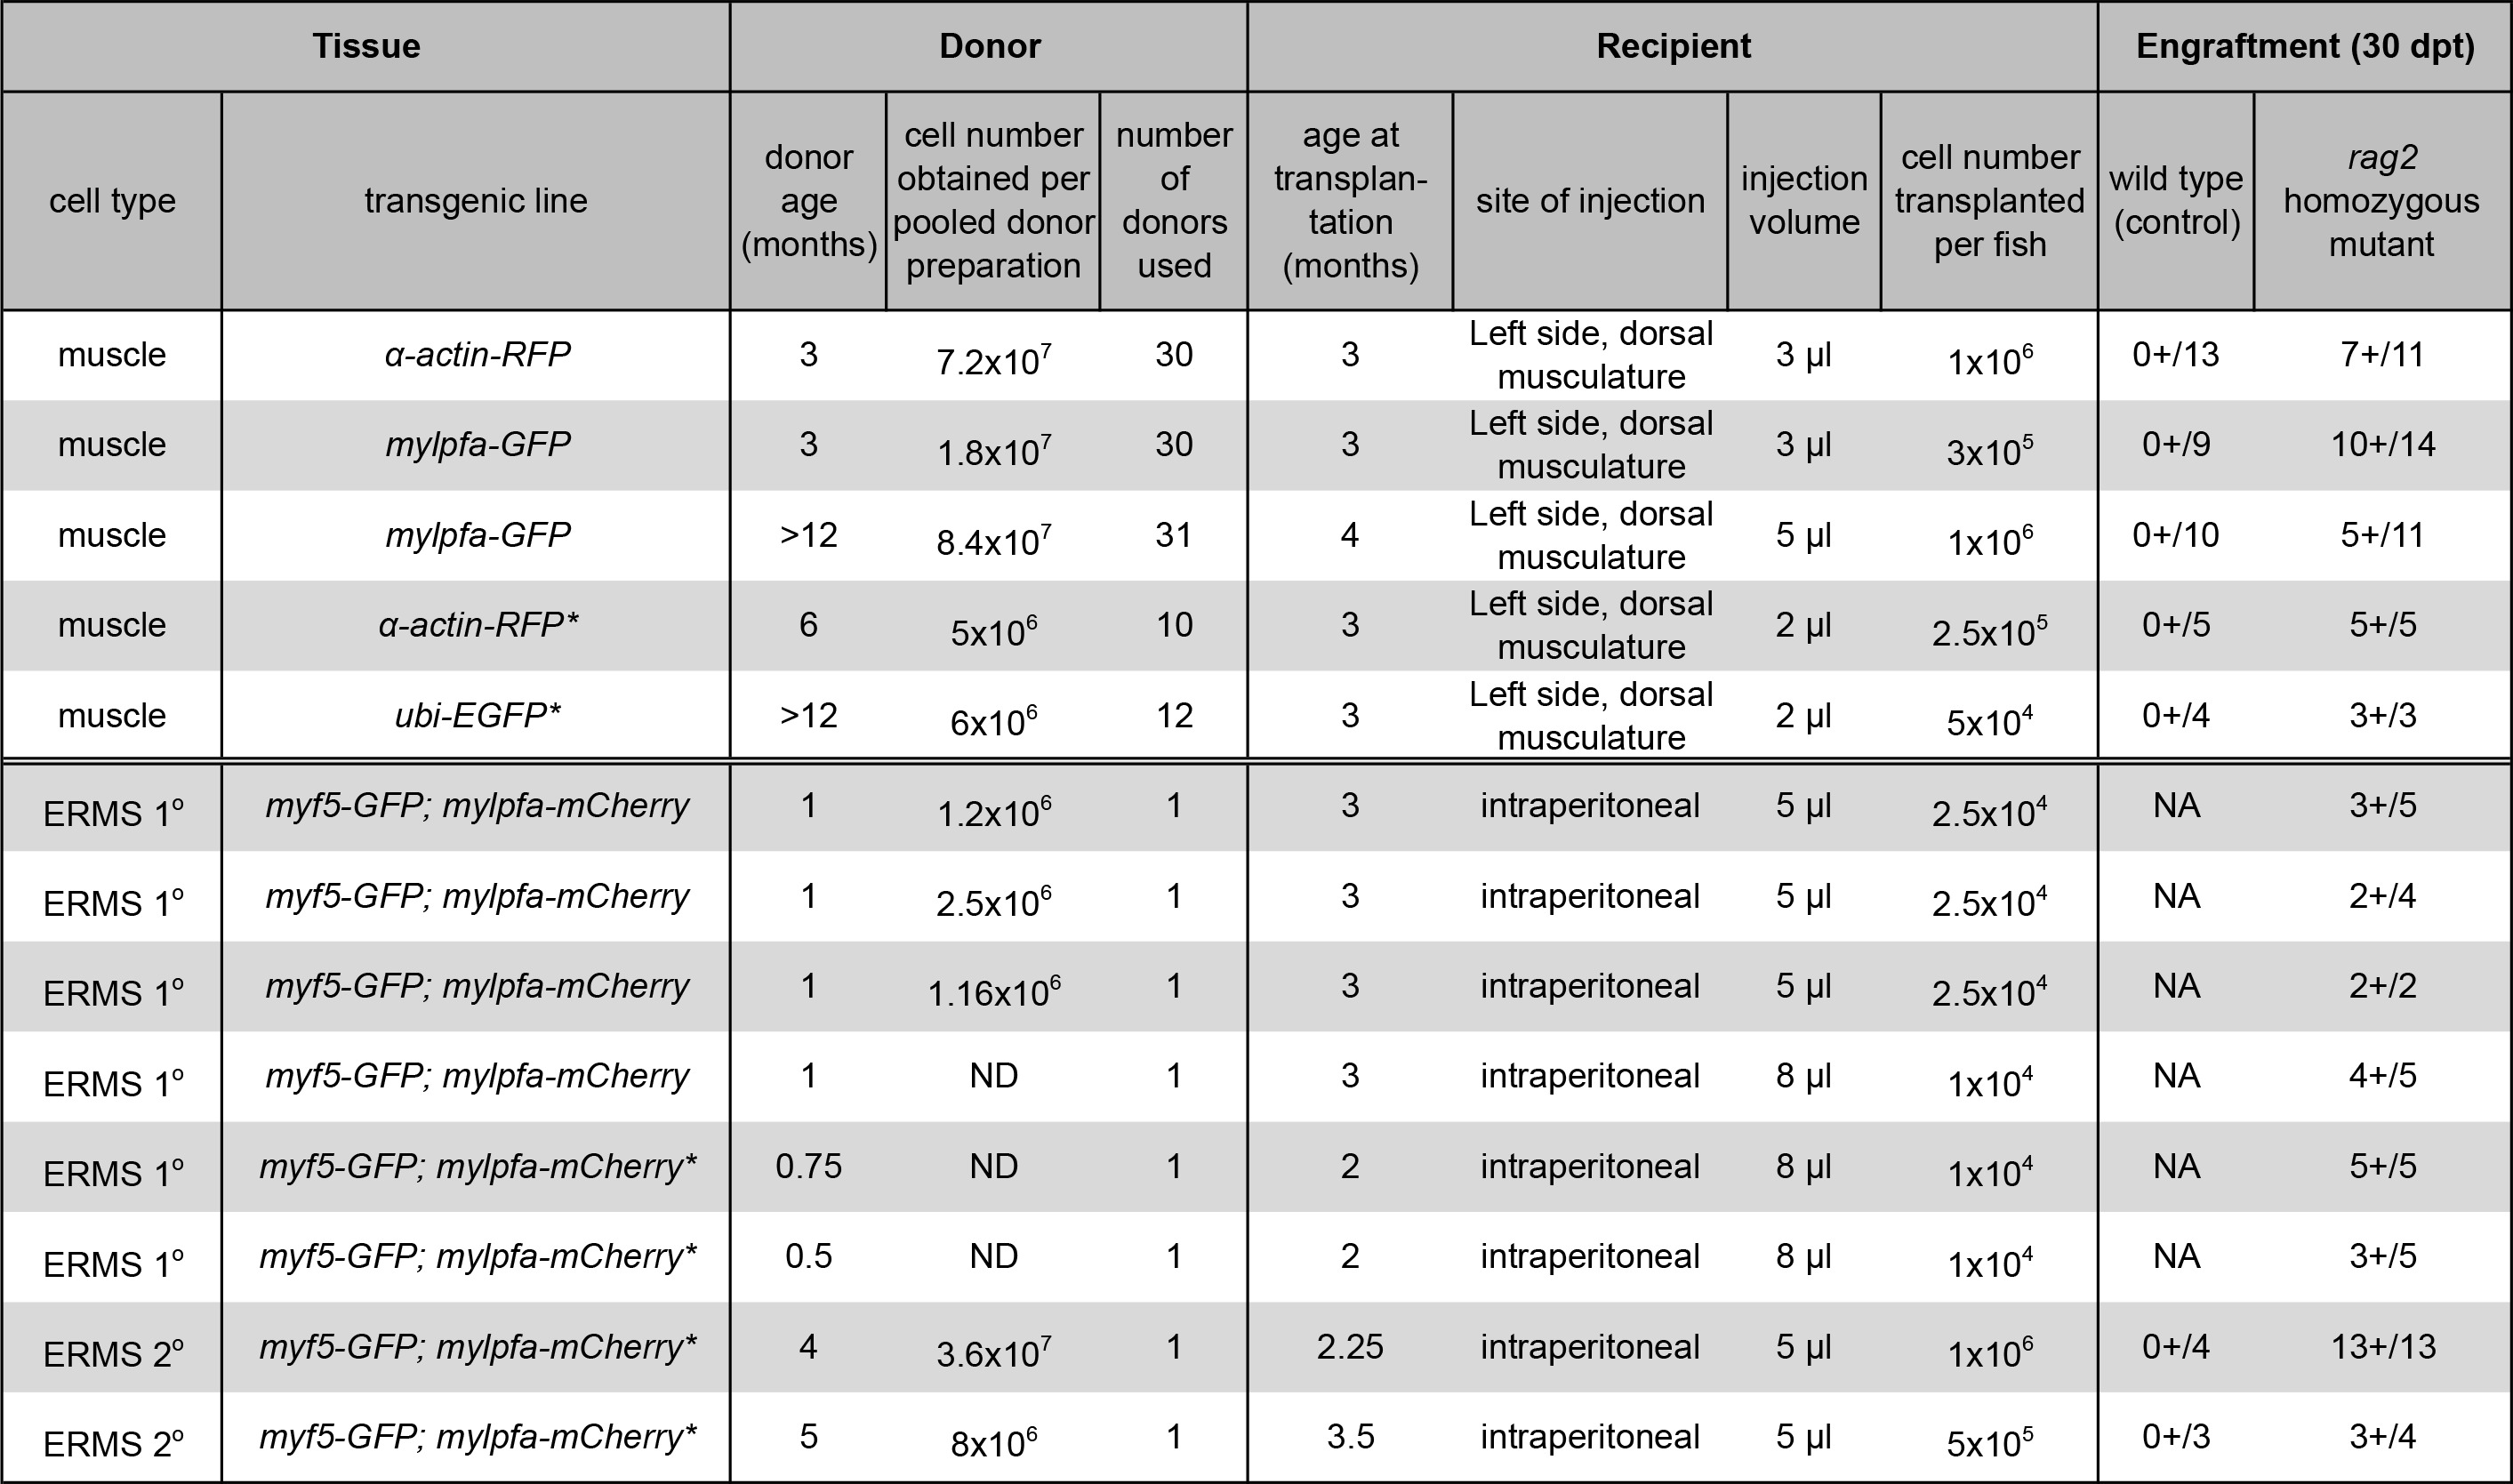
Table 1. Engraftment results for muscle and ERMS cell transplantation. (*) denotes previously reported data using the same techniques23. Data is reprinted with permission from Nature Methods. Please click here to view a larger version of this table.
Discussion
Efficient and robust engraftment of adult dorsal skeletal muscle was attained with a very simple cell preparation method followed by injection of cells into the dorsal musculature of rag2 homozygous mutant fish. In general, intramuscular injection procedures were very robust, with some associated death immediately following the implantation procedure, ranging from 10% to 35% depending on experiment. Additional optimization will likely center on utilization of smaller gauge needles for injection and development of stationary injection apparatus using a microscope and micromanipulator, which will facilitate ease of implanting cells. Our approach also used unsorted muscle cells from donor animals and only contained approximately 30% muscle progenitor cells. Use of transgenic reporter lines that label stem cells and FACS isolation will likely provide enriched cell suspensions that lead to increased engraftment into recipient fish. Skeletal muscle cells could also be enriched and cultured prior to transplantation, as previously described29. Remarkably, our results also indicate that the steps of niche establishment and differentiation of donor muscle tissue occur before 10 days post transplantation, establishing this model as a robust and fast experimental platform to assess muscle engraftment and regeneration. Moreover, these experiments starkly contrast with those completed in mice, where pre-injury of muscle with cardiotoxin or barium chloride is required two days prior to engraftment30,31. It is likely that needle injury produced during the transplantation procedure potentiates engraftment by stimulating the production of a regenerative environment within the recipient animal32,33. We also envision that our method will be easily adapted to the transplantation of skeletal muscle tissue from younger zebrafish, allowing assessment of genetic mutations that affect early skeletal muscle development but lead to lethality at the larval stages.
We have also provided a detailed protocol for engraftment of zebrafish ERMS by intraperitoneal injection into non-conditioned, rag2 homozygous mutant fish. This approach was useful for expansion of double transgenic primary tumors without the need for generating tumors within a syngeneic transgenic line. Our recent work has shown that cell transplantation approaches provide novel experimental models to assess ERMS drug sensitivity in vivo, where a single tumor can be expanded into thousands of animals and assessed for effects on growth, self-renewal, and neovascularization15. Moreover, we have successfully engrafted a wide range of tumors into rag2 homozygous mutant fish including T cell acute lymphoblastic leukemia, melanoma, and ERMS23. Looking toward the future, we envision these lines will be useful for assessing important functional properties of cancer in vivo including assessing intra-tumoral heterogeneity, invasion, metastasis, angiogenesis, and therapy resistance. Moreover, the generation of rag2 homozygous mutant fish in the optically clear Casper strain zebrafish34 will likely facilitate direct imaging of many of these hallmarks of cancer.
In total, we provide detailed protocols for the successful engraftment of fluorescently-labeled normal and malignant skeletal muscle in to adult rag2 homozygous mutant immune compromised zebrafish.
Disclosures
The authors have no competing financial interests.
Acknowledgements
This work is supported by Alex’s Lemonade Stand Foundation (D.M.L.), American Cancer Society (D.M.L.), the MGH Howard Goodman Fellowship (D.M.L.), and US National Institutes of Health grants R24OD016761 and 1R01CA154923 (D.M.L.). CNY Flow Cytometry Core and Flow Image Analysis, shared instrumentation grant number 1S10RR023440-01A1. I.M.T. is funded by a fellowship from the Portuguese Foundation for Science and Technology (Fundação para a Ciência e Tecnologia – FCT). Q.T. is funded by the China Scholarship Council. We thank Angela Volorio for her helpful comments and advice.
Materials
| Name | Company | Catalog Number | Comments |
|---|---|---|---|
| Tris-EDTA buffer solution 1x | Sigma-Aldrich | 93283-100ML | Microinjection. Injection mix. |
| Potassium Chloride | Fisher Science Education | S77375-1 | Microinjection. Injection mix. |
| XhoI Restriction Enzyme | New England Biolabs | R0146S | Microinjection. Plasmid linearization. |
| QIAquick PCR Purification Kit | Qiagen | 28104 (50) or 28106 (250) | Microinjection. For purification of linearized plasmid up to 10 kb. |
| Phenol/Chloroform/Isoamyl Alcohol | Fisher Scientific | BP1753I-100 | Microinjection. For purification of linearized plasmid. |
| UltraPure Agarose, 500 g | Invitrogen | 16500-500 | Microinjection. Linearized plasmid quantification. |
| Nanodrop 2000 Spectrophotometer | Thermo Scientific | http://www.nanodrop.com/Productnd2000overview.aspx | Microinjection. Linearized plasmid quantification. |
| DAPI (4',6-diamidino-2-phenylindole, dihydrochloride) | Life Technologies | D1306 | flow cytometry/FACS |
| 5 ml polystyrene round bottom tube | BD Falcon | 352058 | flow cytometry collection tube |
| BD FACSAria II | BD Biosciences | Special Order Research Products (SORP) program | FACS |
| 5 ml polypropylene round bottom tube | BD Falcon | 352063 | FACS collection tube |
| BD LSR II | BD Biosciences | Special Order Research Products (SORP) program | flow cytometry |
| Phosphate Buffered Saline, pH 7.4 (1x) | Life Technologies | 10010-023 | transplantation |
| Fetal Bovine Serum | Omega Scientific | FB-01 | transplantation |
| Tricaine methanesulphonate (MS-222) | Western Chemical Inc. | http://www.wchemical.com/tricaine-s-ms-222.html | Transplantation. Anesthetic. Caution: Irritant. Irritating to eyes, respiratory system, and skin. |
| VWR Absorbent Bench Underpads | VWR | 56616-018 | Transplantation. Regular paper towels or sponge can be used as an alternative. |
| Singe Edge Industrial Razor Blades | VWR | 55411-050 | transplantation |
| Petri Dish, Polystryrene Disposable Sterile | VWR | 25384-302 | transplantation |
| Cell Strainer, 40 µm Nylon | Falcon-Corning Incorporated | 352340 | transplantation |
| 50 ml Centrifuge Tube | Corning Incorporated | 430828 | transplantation |
| Trypan Blue Stain (0.4%) | Life Technologies | 15250-061 | transplantation |
| Hemacytometer Set | Hausser Scientific | 1483 | transplantation |
| Hamilton syringe, fixed needle, volume 10 µl, needle size 26s ga (bevel tip) | Hamilton | 80366 | transplantation |
| Austin's A-1 Bleach, Commercial | James Austin Company | Transplantation. Any commercial solution can be used. | |
| Ethanol 190 Proof | Decon Labs, Inc. | DSP-MD.43 | Microinjection (linearized plasmid purification) and transplantation. Any commercial solution can be used. |
| High Speed Microcentrifuge, 300D Digital Microcentrifuge | Denville Scientific Inc. | C0265-24 | transplantation |
| Sorvall Legend XFR Centrifuge | Thermo Scientific | 75004539 | Transplantation. Catalog number for 120 V, 60 Hz (US). |
| 5 ml serological pipets | BD Falcon | 357529 | transplantation |
| Corning Stripettor Plus Pipetting Controller | Corning Incorporated | 4090 | Transplantation. Any automatic pipetting controller can be used. |
| Powder free examination gloves | All steps. Any commercial brand can be used. | ||
| Filter pipet tips and micropipettes | All steps. Any commercial brand can be used. | ||
| Dumont forceps #5 | Fine Science Tools | 11205-20 | transplantation |
| Fluorescent Stereomicroscope | Olympus | MVX10 | Scoring. Any appropriate fluorescent stereomicroscope can be used. |
| Olympus DP72 microscope digital camera | Olympus | DP72 | Scoring. Multiple adequate cameras for the selected imaging system can be used. |
References
- Gemberling, M., Bailey, T. J., Hyde, D. R., Poss, K. D. The zebrafish as a model for complex tissue regeneration. Trends in genetics TIG. 29 (11), (2013).
- Boatman, S., Barrett, F., Satishchandran, S., Jing, L., Shestopalov, I., Zon, L. I. Assaying hematopoiesis using zebrafish. Blood cells, molecule., & diseases. 51 (4), 271-276 (2013).
- Langenau, D. M., Traver, D., et al. Myc-induced T cell leukemia in transgenic zebrafish. Science. 299 (5608), 887-890 (2003).
- Yang, H. W., Kutok, J. L., et al. Targeted Expression of Human MYCN Selectively Causes Pancreatic Neuroendocrine Tumors in Transgenic Zebrafish Targeted Expression of Human MYCN Selectively Causes Pancreatic Neuroendocrine Tumors in Transgenic Zebrafish. Cancer Research. , 7256-7262 (2004).
- Patton, E. E., Widlund, H. R., et al. BRAF mutations are sufficient to promote nevi formation and cooperate with p53 in the genesis of melanoma. Current Biology. 15 (3), 249-254 (2005).
- Sabaawy, H. E., Azuma, M., Embree, L. J., Tsai, H. -J., Starost, M. F., Hickstein, D. D. TEL-AML1 transgenic zebrafish model of precursor B cell acute lymphoblastic leukemia. Proceedings of the National Academy of Sciences of the United States of America. 103 (41), 15166-15171 (2006).
- Langenau, D. M., Keefe, M. D., et al. Effects of RAS on the genesis of embryonal rhabdomyosarcoma. Gene. 21 (11), 1382-1395 (2007).
- Le, X., Langenau, D. M., Keefe, M. D., Kutok, J. L., Neuberg, D. S., Zon, L. I. Heat shock-inducible Cre/Lox approaches to induce diverse types of tumors and hyperplasia in transgenic zebrafish. Proceedings of the National Academy of Sciences of the United States of America. 104 (22), 9410-9415 (2007).
- Park, S. W., Davison, J. M., Rhee, J., Hruban, R. H., Maitra, A., Leach, S. D. Oncogenic KRAS induces progenitor cell expansion and malignant transformation in zebrafish exocrine pancreas. Gastroenterology. 134 (7), 2080-2090 (2008).
- Zhuravleva, J., Paggetti, J., et al. MOZ/TIF2-induced acute myeloid leukaemia in transgenic fish. British journal of haematology. 143 (3), 378-382 (2008).
- Ignatius, M. S., Chen, E. Y., et al. In vivo imaging of tumor-propagating cells, regional tumor heterogeneity, and dynamic cell movements in embryonal rhabdomyosarcoma. Suppl Data. Cancer cell. 21 (5), 680-693 (2012).
- Blackburn, J. S., Liu, S., et al. Clonal Evolution Enhances Leukemia-Propagating Cell Frequency. Cancer cell. 25 (3), 366-378 (2014).
- Blackburn, J. S., Langenau, D. M. Zebrafish as a model to assess cancer heterogeneity, progression and relapse. Disease model. 7 (7), 755-762 (2014).
- Zhao, C., Wang, X., et al. A novel xenograft model in zebrafish for high-resolution investigating dynamics of neovascularization in tumors. PloS one. 6 (7), e21768(2011).
- Chen, E. Y., DeRan, M. T., et al. Glycogen synthase kinase 3 inhibitors induce the canonical WNT/β-catenin pathway to suppress growth and self-renewal in embryonal rhabdomyosarcoma. Proceedings of the National Academy of Sciences of the United States of America. 111 (14), 5349-5354 (2014).
- Yang, X. -J., Cui, W., et al. A novel zebrafish xenotransplantation model for study of glioma stem cell invasion. PloS one. 8 (4), e61801(2013).
- Chapman, A., Fernandez del Ama, L., Ferguson, J., Kamarashev, J., Wellbrock, C., Hurlstone, A. Heterogeneous Tumor Subpopulations Cooperate to Drive Invasion. Cell Reports. 8 (8), 1-8 (2014).
- Smith, A. C. H., Raimondi, A. R., et al. High-throughput cell transplantation establishes that tumor-initiating cells are abundant in zebrafish T-cell acute lymphoblastic leukemia. Blood. 115 (16), 3296-3303 (2010).
- Iyengar, S., Houvras, Y., Ceol, C. J. Screening for melanoma modifiers using a zebrafish autochthonous tumor model. Journal of visualized experiments JoVE. (69), e50086(2012).
- Mizgireuv, I., Revskoy, S. Y. Transplantable tumor lines generated in clonal zebrafish. Cancer research. 66 (6), 3120-3125 (2006).
- Streisinger, G., Walker, C., Dower, N., Knauber, D., Singer, F. Production of clones of homozygous diploid zebra fish (Brachydanio rerio). Nature. 291, 293-296 (1981).
- Blackburn, J. S., Liu, S., Langenau, D. M. Quantifying the frequency of tumor-propagating cells using limiting dilution cell transplantation in syngeneic zebrafish. Journal of visualized experiments JoVE. (53), e2790(2011).
- Tang, Q., Abdelfattah, N. S., et al. Optimized cell transplantation using adult rag2 mutant zebrafish. Nature methods. 11, 821-824 (2014).
- Zhou, Q., Facciponte, J., Jin, M., Shen, Q., Lin, Q. Humanized NOD-SCID IL2rg–/– mice as a preclinical model for cancer research and its potential use for individualized cancer therapies. Cancer letters. 344 (1), 13-19 (2014).
- Higashijima, S., Okamoto, H., Ueno, N., Hotta, Y., Eguchi, G. High-frequency generation of transgenic zebrafish which reliably express GFP in whole muscles or the whole body by using promoters of zebrafish origin. Developmental biology. 192 (2), 289-299 (1997).
- Langenau, D. M., Keefe, M. D. D. D., et al. Co-injection strategies to modify radiation sensitivity and tumor initiation in transgenic Zebrafish. Oncogene. 27 (30), 4242-4248 (2008).
- Rosen, J. N., Sweeney, M. F., Mably, J. D. Microinjection of zebrafish embryos to analyze gene function. J Vis Exp. (25), 1-5 (2009).
- Westerfield, M. The zebrafish book. A guide for the laboratory use of zebrafish (Danio rerio). , University of Oregon PRess. Eugene, OR. (2000).
- Alexander, M. S., Kawahara, G., et al. Isolation and transcriptome analysis of adult zebrafish cells enriched for skeletal muscle progenitors). Muscl, & nerve. 43 (5), 741-750 (2011).
- Motohashi, N., Asakura, Y., Asakura, A. Isolation, culture, and transplantation of muscle satellite cells. Journal of visualized experiments JoVE. (86), 1-7 (2014).
- Gerli, M. F. M., Maffioletti, S. M., Millet, Q., Tedesco, F. S. Transplantation of induced pluripotent stem cell-derived mesoangioblast-like myogenic progenitors in mouse models of muscle regeneration. J Vis Exp. (83), e50532(2014).
- Siegel, A. L., Gurevich, D. B., Currie, P. D. A myogenic precursor cell that could contribute to regeneration in zebrafish and its similarity to the satellite cell. The FEBS journal. 280 (17), 4074-4088 (2013).
- Rowlerson, a, Radaelli, G., Mascarello, F., Veggetti, Regeneration of skeletal muscle in two teleost fish: Sparus aurata and Brachydanio rerio. Cell Tissue Res. 289 (2), 311-322 (1997).
- White, R. M., Sessa, A., et al. Transparent adult zebrafish as a tool for in vivo transplantation analysis. Cell stem cell. 2 (2), 183-189 (2008).
Reprints and Permissions
