We describe the fabrication and characterization of nano-biological systems interfacing nanostructured substrates with immobilized proteins and aptamers. The relevant experimental steps involving lithographic fabrication of nanostructured substrates, bio-functionalization, and surface-enhanced Raman spectroscopy (SERS) characterization, are reported. SERS detection of surface-immobilized proteins, and probing of protein-ligand and aptamer-ligand binding is demonstrated.
Method Article
Surface Enhanced Raman Spectroscopy Detection of Biomolecules Using EBL Fabricated Nanostructured Substrates
In This Article
Summary
Abstract
Fabrication and characterization of conjugate nano-biological systems interfacing metallic nanostructures on solid supports with immobilized biomolecules is reported. The entire sequence of relevant experimental steps is described, involving the fabrication of nanostructured substrates using electron beam lithography, immobilization of biomolecules on the substrates, and their characterization utilizing surface-enhanced Raman spectroscopy (SERS). Three different designs of nano-biological systems are employed, including protein A, glucose binding protein, and a dopamine binding DNA aptamer. In the latter two cases, the binding of respective ligands, D-glucose and dopamine, is also included. The three kinds of biomolecules are immobilized on nanostructured substrates by different methods, and the results of SERS imaging are reported. The capabilities of SERS to detect vibrational modes from surface-immobilized proteins, as well as to capture the protein-ligand and aptamer-ligand binding are demonstrated. The results also illustrate the influence of the surface nanostructure geometry, biomolecules immobilization strategy, Raman activity of the molecules and presence or absence of the ligand binding on the SERS spectra acquired.
Introduction
Capabilities to develop and characterize conjugate nano-biological systems interfacing solid nanostructures and biological polymers are becoming increasingly important to further advances in next-generation bio-sensing and bio-actuation technologies1,2. This involves multi-disciplinary studies across a number of research fields, such as the fabrication of pertinent solid-state components (micro-or nano- electrodes, nano-engineered coatings, nanowires, or nanoparticles)2,3,4; immobilization of biomolecules on the surfaces to create desired bioconjugates5,6,7; and monitoring nano-biological interfaces1. In most cases, the selection of optimal fabrication, bio-functionalization, and characterization methods is strongly inter-related. Clearly, the choice of nanofabrication techniques would be driven by the requirements of the solid state components of the system, being largely dependent on the detection method, which in turn is determined by the nature of the biopolymers involved and the purpose of monitoring the interface.
Out of a broad variety of techniques applied to characterize bioconjugate systems1,3, surface enhanced Raman spectroscopy (SERS) has emerged as a highly promising method for the detection of chemical and biological species on surfaces8,9,10,11. SERS employs inelastic scattering of monochromatic light by surface-immobilized biomolecules (Figure 1) allowing the capture of unique signatures corresponding to molecular vibrations. This capability to distinguish among different molecules without involving labels, complex chemistry, or time-consuming steps, makes SERS a potentially very efficient method of bio-detection. Another important advantage of SERS is its high sensitivity. The excitation of localized surface plasmons by light interacting with noble metal nanostructures (SERS substrates) increases dramatically the intensity of Raman scattering by the analyte, allowing the detection of very small amounts of molecules, from monolayers down to the single-molecule limit8,9,10,11. Finally, most biomolecules require aqueous solutions to be stable. Because water often has limited Raman activity, background signal from aqueous samples is minimized9. Applications of SERS have exhibited an exponential increase over the last decade10. However, a much discussed challenge of SERS is that the electromagnetic enhancement of Raman scattering depends critically on the size, shape, and spacing of metal nanostructures where plasmonic waves are induced11,12,13. In order to achieve efficient and reproducible SERS measurements, control over the substrate geometry is required at the nanoscale dimensions.
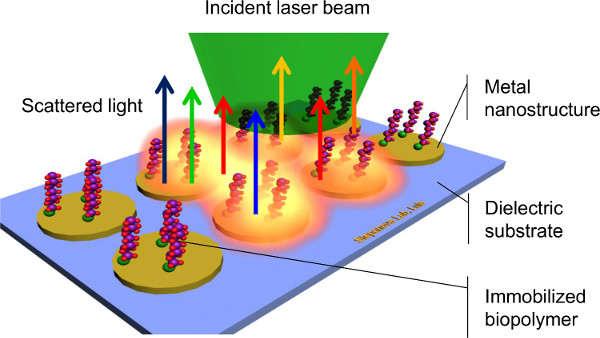
Figure 1. Scheme of surface-enhanced Raman spectroscopy.
Numerous methods employed to fabricate SERS substrates11,12,13 can be roughly classified into bottom-up and top-down methods. Methods of the first type employ various processes of self-assembly or directed chemical synthesis to produce nanostructures. Often addressed examples include immobilization of monodisperse nanoparticles on solid supports11,12,13, thermal, sputter, or electrochemical deposition of roughened metal films11,12, and various chemical synthesis methods13. Although such techniques tend to be relatively simple and inexpensive, most of them are challenged by a lack of control over the location of the structures, and limited sample-to-sample reproducibility.
In contrast, top-down lithography techniques employ manipulable instruments such as particle beams to create desired patterns on surfaces. One of the most often used nanolithography methods, electron beam lithography (EBL), offers superb control over features down to below 10 nm and also a flexibility to allow for different substrate designs on solid supports11,12. In EBL, a beam of electrons focused down to a spot of a few nanometers in diameter scans across a surface of an electron sensitive material (resist) causing a chemical change in exposed regions. For positive tone resists such as polymethylmethacrylate (PMMA), electron beam exposure results in scission of the polymer chains composing the resist, leading to an increased solubility in an appropriate solvent (developer). The process of electron-beam lithography includes spin-coating of a uniform layer of resist on a substrate; exposure of the targeted resist material in a vacuum chamber with an electron beam; and development of the sample to remove the soluble regions.
Dielectric supports underneath metallic nanostructures, such as fused silica, have been shown to significantly increase the intensities in SERS due to localization of plasmonic waves compared to other materials such as silicon14,15. However EBL patterning on dielectric substrates, especially at the nanoscale, involves significant challenges due to charge build-up during exposure. Previously, we have shown16,17 that these difficulties can be overcome by placing conductive polymer layers above the resist. Figure 2 shows a schematic of the overall fabrication process using EBL exposure and development followed by metal deposition and liftoff to produce metallic nanostructures on fused silica supports. Please click here to view a larger version of this figure.
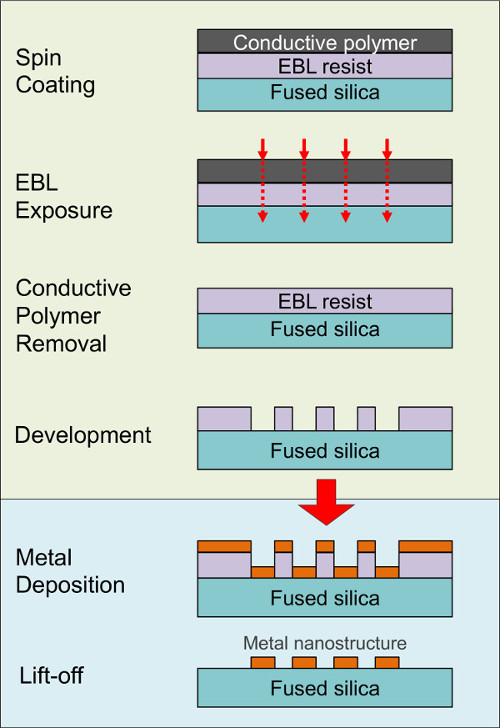
Figure 2. Scheme of electron beam lithography, metal deposition, and liftoff process steps employed to fabricate metallic nanostructures on dielectric substrates16-19. In this paper, we present the entire sequence of process steps involving SERS substrates fabrication by EBL, bio-functionalization of the substrates, and collection of the Raman spectra. Three designs explored in our recent works18,19, 20 are addressed (see Figures 3 and 4, and Table 1). In Design 1, recombinant protein A is immobilized on bio-functionalized Au nanostructures on a fused silica (FS) support18, and SERS detection of the protein is demonstrated. In Design 2, recombinant glucose-binding protein22,27,28 with and without the ligand (D-glucose) is immobilized by means of histidine tags in spaces between Ag nanostructures on Ni-coated FS, and the binding of glucose to the protein is detected. In Design 3, thiolated dopamine-binding DNA aptamer20,24 is immobilized on Au nanostructures on FS, and the binding of dopamine by immobilized aptamer is demonstrated. Inclusive of all relevant experimental steps from substrate preparation to Raman spectra acquisition, and representative of different biomolecules and strategies of immobilization, these examples are useful for a broad variety of applications, from exploration research interrogating nano-biological interfaces by SERS to the development of SERS biosensors of small molecules employing protein- or aptamer-ligand binding as a recognition method. Please click here to view a larger version of this figure.
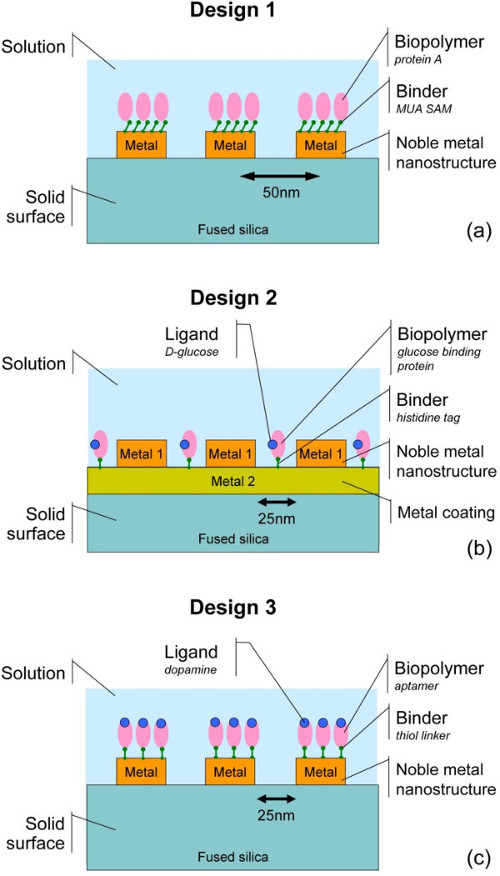
Figure 3. Schemes of three representative designs using different biomolecules, methods of immobilization, and substrate materials: (A) protein A immobilized on the noble metal nano-dots functionalized by a self-assembled monolayer (SAM) of 11-mercaptodecanoic acid (MUA) in DI water; (B) histidine-tagged glucose binding protein (GBP) complexed with D-glucose immobilized on the substrate surface between noble metal nano-dots; (C) thiol-terminated dopamine binding aptamer completed with dopamine (DBA) immobilized on noble metal nano-dots. See further details in Table 1. In Design 2 illustrated by panel (B), a sample without the corresponding ligand was also prepared for comparison. Please click here to view a larger version of this figure.
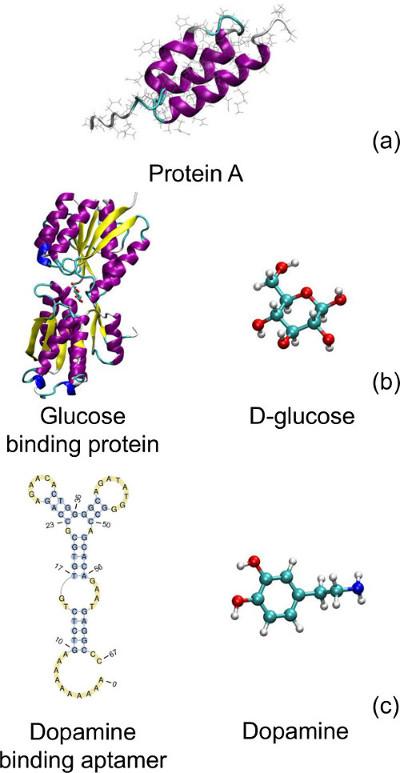
Figure 4. Biomolecules employed in three designs: (A) protein A; (B) glucose binding protein and D-glucose; (C) dopamine binding DNA aptamer and dopamine. The protein tertiary structures in (a) and (b) are taken from Protein Data Bank, PDB ID 1BDD21 and 2HPH22, respectively, and drawn with VMD for LINUXAMD64, version 1.9.123. The aptamer secondary structure in (c) is predicted from the sequence24 using ValFold25 software and drawn with PseudoViewer 3.026. The letters G, A, T, and C correspond to guanine, adenine, thymine, and cytosine nucleotides, respectively. Please click here to view a larger version of this figure.
| Design 1 | Design 2 | Design 3 | |
| Biopolymer | Protein A | Glucose binding protein (GBP) | Dopamine binding aptamer (DBA) |
| Binder | 11-Mercaptoundecanoic acid (MUA) self-assembled monolayer (SAM) | Histidine tags | Thiol linkers |
| Ligand | None | D-glucose | Dopamine |
| Solution | Deionized (DI) water | Potassium phosphate buffer | Tris(hydroxymethyl)aminomethane (TRIS) and ethylenediaminetetraacetic acid (EDTA) buffer; Phosphate buffered saline (PBS) |
| Substrate | Au structures on FS | Ag structures on Ni-coated FS | Au structures on FS |
| Patterned area | 4 μm x 10 μm | 4 μm x 8 μm | 4 μm x 10 μm |
| Pattern | Au dots, 50 nm pitch | Ag dots, 40 nm pitch | Au hexagons, 200 nm pitch |
| Ag hexagons, 200 nm pitch | Au unstructured pads | ||
| Ag unstructured pads | |||
| EBL exposure doses | Dots: | Dots: 105 μC/cm2 | Hexagons: 180 μC/cm2 |
| Array I 120 μC/cm2 | Hexagons: 170 μC/cm2 | ||
| Array II 96 μC/cm2 | |||
| Array III 72 μC/cm2 | |||
| Laser excitation wavelength | 532 nm | 532 nm | 780 nm |
Table 1. Three designs of nano-biological systems.
Protocol
1. Substrate Preparation
- Use a semiconductor dicing saw to cut a fused silica (FS) wafer into 1 cm × 1 cm or smaller dice.
- Clean samples in a piranha solution (H2SO4:H2O2, 3:1; CAUTION: strong oxidizer) bath29 for 15 min, then rinse the dice in deionized water and dry in nitrogen.
- Place the samples on a hotplate face up at 180 °C for 15 min. Cool the samples after removing from the hotplate to RT.
- For Designs 1 and 3, proceed to step 2.
- For Design 2, place the sample in an electron beam evaporation chamber and coat with a 10 nm layer of Ni.
2. Fabrication of Nano-patterned PMMA Masks Using Electron Beam Lithography (EBL)
- Spin-coat the PMMA resist and conductive layers on the substrates.
- Use a wafer spinner with a vacuum chuck and place samples individually in the center on the chuck. Place 1 drop of polymethylmethacrylate (PMMA) resist on the center of the samples using a glass pipette and spin at 3,500 rpm for 60 sec with a 2 sec ramp time.
- Bake the substrates at 180 °C for 3-5 min. After baking the substrates, cool the samples to RT.
- With the substrates cooled and returned to the spinner chuck, spread a drop of conductive polymer on the substrate. Spin the substrate for 40 sec at 3,000 rpm with a 2 sec ramp time. Bake samples at 80 °C for 1 min.
- Perform EBL exposure according to the standard procedure16,17,18,30.
- Using manufacturer’s instructions, prepare an exposure design employing feature doses from Table 1 with the smallest possible beam step size.
- Load the sample into the electron beam lithography chamber. If the EBL system does not have autofocusing, use a small scratch away from where the pattern is to be exposed and away from the bead edge for focusing.
- Using manufacturer’s instructions, perform the required focusing and astigmatism correction as well as write field alignment as appropriate, and expose the sample. To allow for proper exposure profile and best pattern quality, use a 30 keV electron beam energy and 7.5 µm aperture for the exposures.
- Remove the conductive polymer and develop exposed samples.
- Prepare a beaker with deionized (DI) water for removing the conductive polymer and a second beaker with a developer mixture (IPA:H2O, 7:3), and stir for 5 min at RT. Prepare isopropanol (high purity) in a third beaker as a rinse agent.
- Using tweezers, place the samples into the water for 3 sec to remove the conductive polymer film, then place the sample into the developer and move the tweezers slowly up and down for 20 sec. Immediately transfer the substrates to the isopropanol and rinse for 10 more seconds, then dry the sample with nitrogen.
3. Noble Metal Nanostructures Fabrication
- Load the samples upside down into the electron beam evaporator system to allow for the evaporated metal to be deposited on the front face of the samples. Deposit a 10 nm thick Au layer onto the samples for Designs 1 and 3, and a 10 nm thick Ag layer for Design 2 at a rate of approximately 0.1 nm/sec.
- Fill a sonication system to the recommended height with water and fill a separate beaker with acetone. Place a sample face up in the bottom of the beaker and allow the sample to soak for 10 min. Holding the beaker, place it into the water bath and allow the height of the acetone to match the height of the water and turn on the sonication system. Allow sonication to occur for up to 60 sec.
- Using the same procedure as detailed in step 3.1, prepare uniform Au and Ag pad substrates by deposition of 10 nm thick metal films on FS (Designs 1 and 3) and Ni-coated FS (Design 2) substrates skipping step 2.
4. Bio-functionalization of Substrates
- Prepare Design 1 samples:
- Prepare a 1 mM solution of 11-mercaptodecanoic acid (MUA) in ethanol at RT. Sonicate for 10 min.
- Immerse proper nanostructured substrate in the solution of MUA for 48 hr. Rinse the sample with ethanol three times and dry for 5 min at RT.
- Prepare a 75 mM solution of N-ethyl-N'-(3-(dimethylamino) propyl) carbodiimide (EDC) in DI water. Prepare a 15 mM solution of N-hydroxysuccinimide (NHS) in DI water.
- Using a micropipette deposit 100 µl of NHS on the Au on the substrate, and immediately add 100 µl of EDC on the same area. Incubate for 1 min to activate the self-assembled monolayer (SAM) of MUA.
- Place a 100 µl drop of protein A solution (47 µM) on the same area of the substrate and store the sample for 24 hr at 5 °C in a multi-compartment Petri dish with 1 ml of DI water in another compartment, and with a sealed cover.
- Rinse the sample in DI water 3 times by continuously stirring the samples in separate beakers for 20 sec in each beaker. Do not let the samples dry after rinsing or during the rinse.
- Proceed to step 5.
- Prepare Design 2 samples:
- Prepare a 0.9 mM solution of glucose binding protein (GBP) in potassium phosphate buffer (K2HPO4, 25 mM, pH 7.5). Prepare a 100 mM solution of D-glucose in the buffer.
- Mix 30 µl of 100 mM D-glucose solution and 30 µl of 0.9 mM GBP solution using a 1 ml plastic microtube container and a micropipette. Incubate for 30 min.
- Deposit 20 µl of the ligand-free GBP solution and of the ligand-bound GBP solution each on the prepared substrates using a micropipette. Store the samples at 5 °C for 24 hr in a Petri dish with a sealed cover.
- Rinse the samples 3 times in the potassium phosphate buffer solution at RT.
- Proceed to step 5.
- Prepare Design 3 samples:
- Dilute the dopamine binding aptamer (DBA) solution to a concentration of 1 µM using the TRIS EDTA buffer with a final pH of 7.4.
- Prepare a dopamine solution to a 5 µM concentration by measuring the dopamine powder on an analytical balance and mixing it in the phosphate buffered saline (PBS) with a stir bead for 5 min.
- Deposit a 20 µl drop of the DBA solution on the surface of each substrate and let the samples sit for 1 hr at RT with a cover over the Petri dish.
- Rinse the samples 3 times in a potassium phosphate buffer (K2HPO4, 25 mM, pH 7.5).
- Place the samples upright on top of a cleanroom grade wipe to dry the backside while maintaining a film on the front side of the substrate. Set a sample aside as a control.
- Place a 5 µl drop of the dopamine solution on the surface of the existing drop of the PBS buffer solution on the remaining samples with the desired dopamine concentrations. Incubate the sample for 10 min.
- Place a drop of the dopamine solution on the Au pad surface without aptamer. Incubate for 10 min.
- Rinse the samples in the potassium phosphate buffer solution 3 times.
5. Raman Spectroscopy
- Place each sample in a water-proof chamber to avoid evaporation by laser exposure.
- Fill a plastic syringe with chemically inert high vacuum grease, place samples on glass slides and dispense a few millimeters of grease surrounding the samples without touching the samples.
- Place a microscope coverslip on top of the substrates and gently press down to form a seal, creating a thin liquid interface between the substrates and the coverslips without allowing the buffer to come in contact with the vacuum grease.
- Using an optical Raman microscope system, obtain a focus on the surface of the metal nano-patterned region to be sampled without turning on the laser.
- Perform Raman sampling18,19 with a laser intensity between 2.4-3.1 mW with a total duration of less than 20 sec to prevent damage to the sample with an objective of 10X magnification. Acquire Raman spectra for samples from Designs 1, 2, and 3 using the excitation wavelengths as indicated in Table 1. Also acquire control Raman spectra for solutions of protein A, GBP, and D-glucose, and for dopamine powder employing glass slides without metal nanostructures as supports for comparison.
Results
Collecting control Raman spectra for the main components, including free proteins in solution and free ligands in solution or in powder form without using metal-containing substrates, is important to enable a proper comparison as well as for interpretation purposes. Figure 5A presents a typical Raman spectrum for free protein A in DI water on a glass slide without nanostructured substrates. Two bands with the highest Raman intensity, the band at 2,931 cm-1 and at 1,091 cm-1, correspond to vibrations involving C-H and C-S bonds, respectively. Other bands with a lower Raman intensity such as 563 cm-1, 1,450 cm-1, 1,653 cm-1 and 2,426 cm-1, can be attributed to a superposition of vibration modes18,33,34,35. Control Raman spectra for the ligand free GPB in buffer solution with three different concentrations, 0.3, 0.9 and 1.3 mM, are shown in Figure 5B. In the figure, the broad band around 3,400 cm-1 corresponds to the solvent36, whereas the band at 2,935 cm-1represents vibrations involving C-H bonds of the protein33,34. Figure 5C shows the high wavelength Raman spectrum for D-glucose in buffer solution for different concentrations: 1, 6, 100, 200, and 400 mM. When the concentration of glucose is increased, C-H bonds vibration bands arise at 2,890 cm-1 and 2,960 cm-1. Control Raman spectra of dopamine in crystal form obtained with both 532 nm and 780 nm excitation wavelengths are shown in Figure 5D. Much of the Raman spectrum comes from the benzene ring bending and C-H bond stretches of the molecule20,37. Some of the bands at around 3,000 cm-1 are only observed at the 532 nm but not 780 nm excitation wavelength.

Figure 5. Control Raman spectrum of protein A in DI water obtained at 532 nm excitation wavelength18 (A); Raman spectra of ligand-free glucose binding protein in buffer solution obtained at 532 nm excitation wavelength (B); Raman spectra of D-glucose in buffer solution obtained at 532 nm excitation wavelength (C); and spectra of dopamine powder obtained at 532 nm and 780 nm excitation wavelengths20(D). All the spectra are regular Raman spectra of solutions (a,b,c) and powder (d) on glass slides without nanostructured substrates. In (D), the assignment of Raman shift regimes to various molecular vibrations was done using General Atomic and Molecular Electronic Structure System (GAMESS)32 and MacMolPlt31 software as detailed elsewhere20. Reprinted panel (a) with permission from18 American Vacuum Society. Please click here to view a larger version of this figure.
In order to obtain SERS spectra for surface-immobilized biomolecules, substrates comprising metallic nanostructures on fused silica supports are fabricated as described in steps 1-3. The quality of fabricated substrates is monitored using scanning electron microscopy (SEM). The standard SEM procedures are described elsewhere16,17,18,19 and not included in the present protocol. Figure 6 shows representative SEM images of Au and Ag nano-dots and nano-hexagon like structures (panels a-d), as well as non-structured Au and Ag pads (panels e and f, respectively). The next steps involve immobilization of biological material on the nano-structured substrates employing three designs listed in Table 1, and acquisition of their SERS spectra. In order to maintain an aqueous environment during Raman imaging, each sample is placed in its corresponding solution (see Table 1), capped with a thin glass cover, and sealed as illustrated in Figure 7.
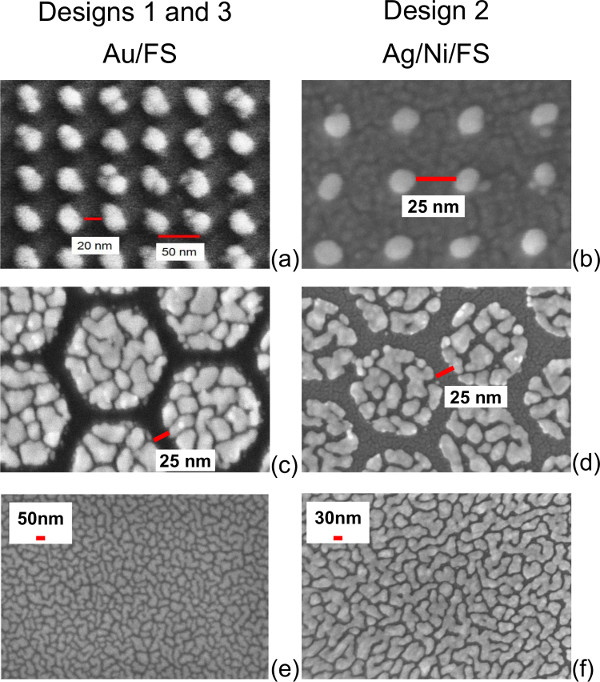
Figure 6. Scanning electron microscope (SEM) images of 10 nm thick Au and Ag surface nanostructures employed as SERS substrates: (A,B) arrays of nanodots; (C,D) arrays of nano-hexagons; (E,F) unstructured pads. Substrates with Au structures (left) employ FS supports, whereas substrates with Ag structures (right) use a 10 nm thick Ni coating on the FS. The images were obtained as described elsewhere16,17,18. Please click here to view a larger version of this figure.
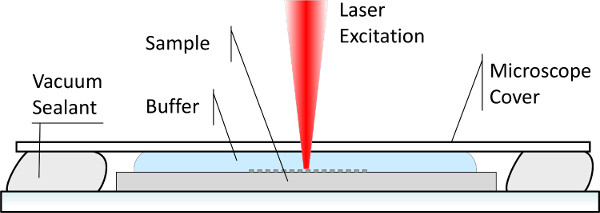
Figure 7. Scheme of water-proof chamber for Raman imaging of bio-functionalized samples in solution.
In Design 1, recombinant protein A is immobilized on the substrates functionalized by a self-assembled monolayer of 11-mercaptodecanoic acid (MUA) in DI water18. The substrates in this design comprise three arrays of Au dots with a 50 nm pitch and varying inter-dot distances on fused silica (see Figures 6A and 8). The process of protein immobilization starts with the formation of a SAM on the substrates. To obtain covalent binding between the SAM and the protein, the carboxylic acid groups of SAMs are transformed into amine reactive NHS-ester by treatment with a mixture of N-ethyl-N'-(3-(dimethylamino) propyl) carbodiimide (EDC) solution and N-hydroxysuccinimide (NHS) solution in DI water. Immobilization of protein A occurs by displacement of the NHS group by lysine residues of the protein38. An example of imaging samples for Design 1 with protein A immobilized on Au nanostructures is shown in Figure 9. Figure 9A presents an optical microscope image of the samples, which comprise three arrays of bio-functionalized Au nanodots with different inter-dot gaps (see also Figures 3Aa and 8), and Figure 9B shows the Raman spectral mapping over these arrays. It can be seen that the highest Raman intensities are found for Array I where the inter-dot gaps are the narrowest, whereas lower intensities are obtained for Array III with the widest inter-dot gaps. This can be explained by a stronger plasmon coupling effect produced by higher electric fields in the narrow spaces between the dots18. Figure 9C shows the strongest SERS spectra obtained for Arrays I and II. The spectra exhibit several bands (1,630 cm-1, 1,964 cm-1, 2,280 cm-1, 2,577 cm-1, and 2,916 cm-1) in proximity to the Raman modes of free protein A in solution seen in Figure 5A. Attributable to vibrations of various bonds found in proteins, these bands either appear at similar locations in both immobilized protein and in solution, or are slightly shifted to somewhat higher wavenumbers when immobilized. In contrast, SERS spectra of similar nanostructured substrates functionalized by MUA SAM without the protein show an entirely different pattern18, confirming that Figure 9 represents SERS mapping of surface-immobilized protein A. Please click here to view a larger version of this figure.
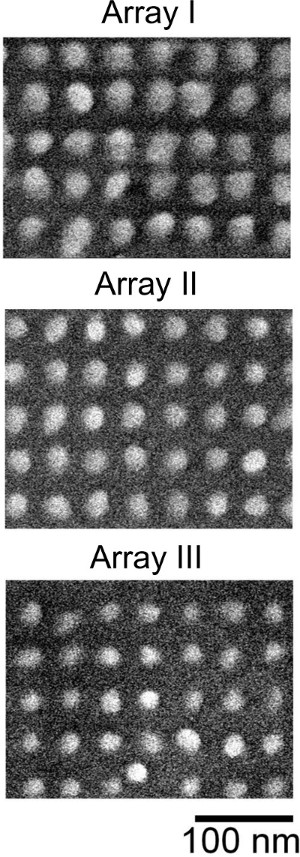
Figure 8. SEM images of three arrays of Au nanodots on FS substrate used in Design 118. The arrays have the same 50 nm pitch and slightly different dot radii resulting in different widths of inter-dot gaps. This is achieved by applying different EBL exposure doses to produce PMMA masks for the three arrays (see Table 1). Higher exposure doses result in wider holes in PMMA masks, allowing for larger Au dot sizes after metallization and liftoff. Reprinted with permission from18 American Vacuum Society. Please click here to view a larger version of this figure.

Figure 9. SERS imaging of substrate-immobilized protein A in Design 118. (A) Optical microscope image of the sample, comprising three arrays of Au nanodots with 50 nm pitch and different inter-dot gaps on a fused silica substrate (see also Figure 6), bio-functionalized as shown in Figure 3A. (B) Raman mapping of the sample. (C) SERS spectra from dot Array I and II. In panel (B), the vertical axis represents the distance across the substrate, the horizontal axis represents the Raman shift, and the legend bar indicates the Raman intensities. Vertical dashed lines in panels (B) and (C) represent benchmark Raman bands of free protein A in solution and (*) in panel (C) indicates SERS bands from Array I. The Raman spectra were obtained 532 nm excitation wavelength. Reprinted with permission from18 American Vacuum Society. Please click here to view a larger version of this figure.
In Design 2, recombinant glucose binding protein (GBP)22 complexed with D-glucose (ligand) is immobilized on the appropriate substrates in potassium phosphate buffer solution. Samples with immobilized ligand-free GBP are also prepared for comparison. In this design, glucose-binding protein is attached to surface by means of a histidine tag, which binds well to Ni but not to noble metals6. Since the substrates comprise arrays of Ag nano-dots, nano-hexagons, and unstructured Ag pads on Ni-coated FS (Figures 6B, 6D, and 6F, respectively), one can expect most of immobilized protein molecules to be located in gaps between Ag nanostructures where Ni coating is available. The Raman spectra obtained for immobilized glucose-free and glucose-bound GBP are shown in Figures 10A and 10B, respectively. All these spectra exhibit a broad band at approximately 3,300 cm-1, which corresponds to the buffer solution36. The spectra obtained with an unstructured Ag pad contain only this single band and do not show any protein vibration modes, confirming that immobilized protein is not found on the Ag surface as expected. In contrast, the spectra obtained with arrays of Ag nano-dots and nano-hexagons exhibit bands around 1,550 cm-1 and 2,900 cm-1, which represent the analyte33,34. In particular, the broad band around 1,550 cm-1, known as the amide II band, is attributable to peptide bonds vibrations in proteins34,35. In the case considered, this band represents a superposition of the vibration modes from GBP immobilized on Ni surface between Ag features, and is indicative of SERS enhancement of these modes in the vicinity of noble metal nanostructures when the substrates containing nano-dots or nano-hexagons are used. This band is very weak for the protein in solution in the absence of SERS enhancement (Figure 5B) and absent on Ag pads without Ni surface available for the protein binding, but it is well pronounced for nanostructured substrates with some Ni surface accessible for the protein to bind. However, even more important for the present study are the other, narrower bands around approximately 2,900 cm-1 that can be attributed to C-H bond wibrations33,34. The spectrum of glucose-free GBP shows a pronounced band at 2,933 cm-1 with the nano-dots substrate, and a weak but discernible band at a similar wavelength with the nano-hexagons substrate (Figure 10A). Distinct from the case of glucose free protein, the SERS spectra of glucose-bound GBP shown in Figure 10B exhibit two bands corresponding to C-H bonds vibrations regimes, at 2,850 cm-1 and 2,910 cm-1. The bands are well pronounced in the spectrum of glucose-bound GBP on nano-hexagons substrate, and they also can be seen in the spectrum of GBP on nano-dots substrate. The band at 2,850 cm-1 is reasonably close to the 2,890 cm-1 one in the control Raman spectrum from D-glucose in solution, and therefore it can be attributed to glucose bound to the protein, whereas the other band (at 2,910 cm-1) is attributable to C-H bond vibrations of both the protein and glucose. One can conclude that difference of SERS signatures from glucose-free and glucose-bound substrate-immobilized GBP is observable in this region, and C-H bond vibrations of protein-bound glucose are detectable employing the design described.
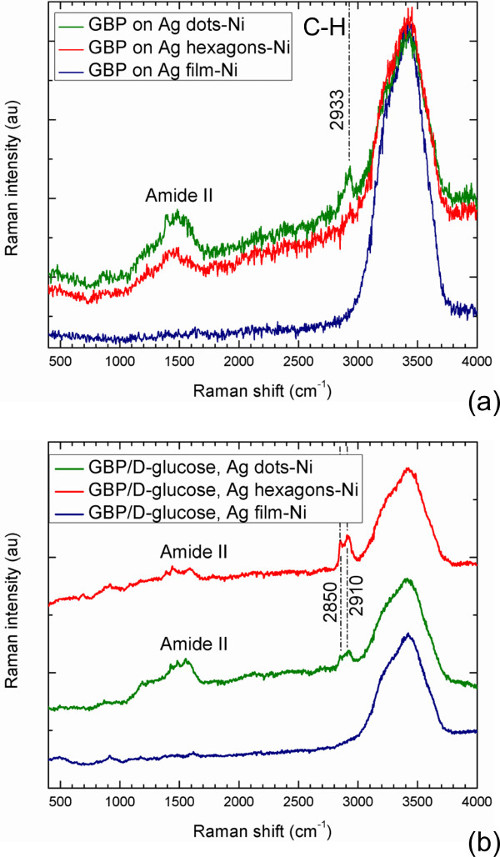
Figure 10. SERS spectra of ligand-free (A) and ligand-bound (B) glucose-binding protein immobilized on three different substrates in Design 2. The spectra were obtained with 532 nm excitation wavelength. Please click here to view a larger version of this figure.
In Design 3, the customized dopamine binding aptamer (DBA) with thiol termination24 is immobilized on the substrate in tris(hydroxymethyl)aminomethane (TRIS) ethylenediaminetetraacetic acid (EDTA) buffer solution, and the dopamine is then bound to the immobilized aptamer20. The substrates for this design contain arrays of Au nano-hexagons on FS (Figure 6C). Unstructured Au pads (Figure 6E) are also used for control purposes. Since DNA is intrinsically fluorescent39, 780 nm excitation wavelength is used in Design 3 to reduce this factor. In this design, the recognition element (aptamer) is not Raman active in the region of Raman shifts considered in Figure 11, whereas dopamine shows a significant Raman activity in this region. Since signal from samples exposed to only dopamine without immobilized aptamer shows no resultant dopamine bands20, the observed SERS bands are expected to originate from aptamer-bound dopamine. Figure 11 compares the SERS spectra of immobilized aptamer on gold nanostructures before and after the addition of dopamine. As expected, immobilized dopamine-free aptamer does not exhibit Raman bands. In contrast, a number of pronounced Raman bands are observed for dopamine-bound immobilized aptamer. The positions of most bands in Figure 11 are close to those in crystalline dopamine, albeit with differences in amplitudes.

Figure 11. SERS spectra of ligand-free (purple line) and ligand-bound (blue line) dopamine-binding aptamer immobilized on Au nano-hexagon substrates in Design 320. The red line shows a control SERS spectrum of dopamine powder. Please click here to view a larger version of this figure.
Discussion
SERS is gaining a recognition as an extremely powerful technique of bio-detection offering many unique advantages. The relation with molecular vibrations allows selectively identifying “fingerprints” of specific analytes from SERS spectra, whereas the extremely high sensitivity makes it possible detecting very small amounts of the analyte9,10,11,36. Furthermore, SERS is a nondestructive technique that is also relatively insensitive to water, and thereby it is very well suited for probing biological materials in their natural aqueous environment9. The results presented emphasize these advantages as well as further demonstrate strong potential of SERS as a very flexible label-free technique of bio-detection. In three designs employing monolayers of different substrate-immobilized biomolecules, Raman modes have been detected that could be confidently attributed to the particular analytes. That the detection of these biomolecules, or their respective ligands, have been demonstrated employing planar surfaces of fused silica as the support for SERS substrates, makes the designs compatible with current electronics and microfluidics settings, promising numerous applications in relation with emerging bio-electronic architectures interfacing biological materials with surfaces of electronic and electrochemical devices2,3. Importantly, in two of three designs SERS detection has been demonstrated for specific binding of small molecules, such as glucose and dopamine, employing monolayers of the surface-immobilized protein and aptamer, respectively, as the recognition elements.
However, several aspects should be taken care of in order to achieve an efficient SERS bio-detection in the “on-chip” setting. First of all, a well-known challenge that is common for most biomolecules is their propensity to degrade, particularly when exposed to non-natural conditions such as dry environment or intense laser light. Throughout the protocol, we have emphasized the importance of always keeping the bio-functionalized samples immersed in appropriate solutions during the entire experiment, from preparation of the samples to the acquisition of Raman spectra. For the latter, a custom water-proof chamber has been designed (Figure 7) to avoid evaporation of the liquid during laser exposures. The duration of exposure and laser intensity should also be limited as described in step 5.3 of the protocol to avoid damage of the samples.
The outcomes of the SERS detection are found sensitive to the geometry of the substrate employed, and particularly the inter-feature separation of the metallic nanostructures. As it follows from Figures 8 and 9, the SERS intensity of Design 1 samples depends strongly on the width of the gaps between Au nano-dots on fused silica. Out of three arrays of Au nanodots tested in this design (Figure 8), the highest Raman intensity is achieved with Array I, which has the narrowest gaps between the Au features and therefore it provides more efficient electromagnetic field enhancement. As Figure 9 illustrates, control of inter-feature separations at the level of 10-20 nm or less is required. Employing EBL for fabricating SERS substrates, as demonstrated here, provides an efficient resolution specifically for controlling the widths of inter-feature gaps. With a positive-tone EBL resist such as PMMA, the size of holes in PMMA masks can be varied by simply changing the exposure doses. After lift-off this results in different sizes of fabricated metal dots, and the width of gaps between the dots may be tuned as desired by selecting proper EBL exposure doses18.
The other challenge is optimization of SERS substrate geometry for specific bio-detection application. Although the enhancement effect increases with a decrease of the inter-feature gaps, the relatively large size of biological molecules imposes limitations on how narrow the gaps may be. This is evident from the results for Design 2, where the immobilization method is such that the protein efficiently binds only to the surface between noble metal dots, but not to the dots themselves (see Figure 3B). As it follows from Figure 10, the SERS spectra for unstructured Ag pads do not show any bands from the analyte. Although the pads exhibit a nano-crystalline structure with very thin inter-island gaps (see Figure 6F) these gaps are too narrow to accommodate a protein molecule. Yet another dimension of complexity is added when protein-ligand binding has to be detected. In Figure 10, the SERS C-H bands are more pronounced in the spectra from ligand-bound GBP than in the ligand-free one, which may be hypothetically explained by a change in the GBP conformation upon binding of D-glucose27,28, resulting in a more rigid structure with increased Raman activity. If one compares the two nanostructured substrates, the C-H band from ligand-free protein is stronger in SERS spectra obtained with the nano-dots substrate, whereas both the protein and glucose C-H bands from ligand-bound protein are more pronounced with the nano-hexagons substrate. Two factors are expected to result in these differences, the availability of space between Ag features where the GBP could bind to Ni, and the susceptibility of the ligand-bound and ligand free protein to the electromagnetic enhancement of the Raman scattering in “hot spots” between these features. On one hand, the nano-dots pattern offers a relatively larger inter-feature area where Ni coating is available for the protein to bind, which may explain a more pronounced C-H band observed for glucose-free GBP on Ag nano-dots substrate. On the other hand, due their non-uniform structure (see Figure 6D), Ag nano-hexagons might be prone to show a stronger electromagnetic enhancement in narrow gaps between Ag islands within nano-hexagons resulting in stronger C-H vibration bands from glucose-bound GBP on the nano-hexagons substrate. Some details of this interplay require further verification, and optimization of SERS substrates for complex analytes involving large proteins such as the GBP is still in the pipeline.
Clearly, SERS detection of ligand binding employing immobilized biomolecules as a recognition element is facilitated when only the ligand is Raman active in a selected region, whereas the other components are not. This is the case of Design 3, where pronounced SERS bands of aptamer-bound dopamine are obtained (Figure 11). The aptamer-dopamine pair exhibits excellent specificity and the SERS spectrum comprises pronounced bands without any significant background signal.
Future advance of the label-fee SERS technology would involve extensive tests of biomolecules’ SERS signal enhancement with a broad range of different surface nanostructure designs. The usage of direct-write electron beam lithography to fabricate various nanostructures with a superb level of control over size, shape, and inter-feature separation, combined with the sample preparation protocols presented here, would facilitate comparison and cross-validation of the results obtained by different research groups. This would address the major challenge of reproducibility when SERS substrates are fabricated employing alternative “bottom up” methods11,12,13, allowing for a better control of metal nanostructure’s size and position toward a reliable identification of optimal substrate design for a broad variety of applications. Scalability of these techniques may subsequently be improved by combining EBL with complementary nanolithography methods such as nanoimprint lithography20 toward future mass-production of nanoscale designs optimized employing the tunable EBL techniques.
Disclosures
The authors have nothing to disclose.
Acknowledgements
The authors would like to thank: David Wishart, Valentyna Semenchenko, Mark McDermott, Michael Woodside, and Albert Cao for their help in developing and preparing the protein conjugates as well as the DNA aptamer; T. M. Fahim Amin, Mosa Sharmin Aktar, and Trevor Olsen for their assistance in the sample preparation, Jonathan Mane for his assistance in generating images of the molecular structures; and the funding sources including the National Research Council of Canada – National Institute for Nanotechnology (NRC-NINT), Natural Sciences and Engineering Research Council of Canada (NSERC), and the University of Alberta for supporting the work.
Materials
| Name | Company | Catalog Number | Comments |
|---|---|---|---|
| 11-Mercaptoundecanoic acid (MUA) |  Sigma Aldrich Sigma Aldrich | 450561 ALDRICH | Used for surface functionalization in Design 1 |
| Conductive polymer | Mitsubishi Rayon | aquaSAVE-57xs | A 70 nm thick layer is used as anti-charging coating for EBL exposures |
| D-glucose | Collaborator Lab. | Ligand in Design 2 | |
| Dopamine | Collaborator Lab. | Ligand in Design 3 | |
| Dopamine binding aptamer (DBA) | Integrated DNA Technologies Inc. | 5'- /Thiol Modifier C6 S-S/ AAAAAAAAAA GTCTCTGTGT GCGCCAGAGA ACACTGGGGC AGATATGGGC CAGCACAGAA TGAGGCCC-3' | Biopolymer in Design 3 |
| Fused silica wafers | Mark Optics | ||
| Glucose binding protein (GBP) | Collaborator Lab. | PDB ID 2HPH | Biopolymer in Design 2 |
| High vacuum grease | Dow Corning | Used to seal water-proof chamber | |
| Hydrogen Peroxide 30%, H2O2 | J.T. Baker | Used for pirahna solution | |
| N-ethyl-N'-(3-(dimethylamino) propyl) carbodiimide (EDC) | Sigma Aldrich | 03450 FLUKA | Used for immobilization of biopolymer in Design 1 |
| N-Hydroxysuccinimide (NHS) | Sigma Aldrich | 130672 ALDRICH | Used for immobilization of biopolymer in Design 1 |
| Potassium phosphate buffer | Collaborator Lab. | Buffer used in Raman sampling | |
| Phosphate buffered saline (PBS) | Collaborator Lab. | Solvent in Design 3 | |
| Polymethylmethacrylate (PMMA) 950 A2 | MicroChem | A 90 nm thick layer is used as EBL positive tone resist | |
| Recombinant protein A | Protein Mods Inc | PDB ID 1BDD | Biopolymer in Design 1 |
| Sulfuric acid 96%, H2SO4 | J.T. Baker | Used for pirahna solution | |
| Tris(hydroxymethyl)aminomethane (TRIS) and ethylenediaminetetraacetic acid (EDTA) buffer | Sigma Aldrich | T9285 SIGMA | Buffer in Design 3
|
| | |||
| Equipment | |||
| Name | Company | Catalog Number | Comments |
| Dicing saw | Diamond Touch Technology Inc. (17301 W Colfax Ave # 152, Golden, CO) | Used to cut FS wafer | |
| Electron beam evaporator | Kurt J. Lesker | Used for Au and Ag evaporation | |
| Electron beam evaporator | Johnsen Ultravac (JUV) | JuV E-gun | Used for Ni evaporation |
| Microscope cover slips (25 mm) | Fisher Scientific | 12-545-102 | Used in water-proof chamber |
| Microscope slides (3×1 in.) | Fisher Scientific | Used in water-proof chamber | |
| Raith 150TWO EBL exposure system | Raith Inc. | Raith 150TWO system | Used for EBL exposures |
| Raman microscope | Thermo Scientific | Nicolet Almega XR | Used for Raman spectroscopy |
| Sonicator system | Branson | Used for liftoff and solutions mixing | |
| Spinner | Brewer Spinner and Hotplate | Cee 200X and Cee 1300X | Used to spin-coat PMMA and conductive polymer |
References
- Sapsford, K. E., Tyner, K. M., Dair, B. J., Deschamps, J. R., Medlintz, I. L. Analyzing Nanomaterial Bioconjugates: A Review of Current and Emerging Purification and Characterization Techniques. Anal. Chem. 83, 4453-4488 (2011).
- Walcarius, A., Minteer, S. hD., Wang, J., Yu, L., Merkoçi, A. Nanomaterials for Bio-Functionalized Electrodes: Recent Trends. J. Mater. Chem. B. 1, 4878-4908 (2013).
- Kim, J., et al. Applications, Techniques, and Microfluidic Interfacing for Nanoscale Biosensing. Microfluid. Nanofluid. 7, 149-167 (2009).
- Rassaei, L., Singh, P. S., Lemay, S. G. Lithography-Based Nanoelectrochemistry. Anal. Chem. 83, 3974-3980 (2011).
- Wong, L. S., Khan, F., Micklefield, J. Selective Covalent Protein Immobilization: Strategies and Applications. Chem. Rev. 109, 4025-4053 (2009).
- Ley, C., Holtmann, D., Mangold, K. -M., Schrader, J. Immobilization of Histidine-Tagged Proteins on Electrodes. Colloids and Surfaces B: Biointerfaces. 88, 539-551 (2011).
- Kim, D., Herr, A. E. Protein Immobilization Techniques for Microfluidic Assays. Biomicrofluidics. 7, 041501(2013).
- Anker, J. N., Hall, W. P., Lyandres, O., Shah, N. C., Xhao, J., Van Duyne, R. P. Biosensing with Plasmonic Nanosensors. Nature Materials. 7, 442-453 (2008).
- Bantz, K. C., et al. Recent Progress in SERS Biosensing. Phys.Chem. 13, 11551-11567 (2011).
- Sharma, B., Frontiera, R. R., Henry, A. -I., Ringe, E., Van Duyne, R. P. SERS: Materials, Applications, and the Future. Mater. Today. 15, 16-25 (2012).
- Kleinman, S. L., Frontiera, R. R., Henry, A. -I., Dieringer, J. A., Van Duyne, R. P. Creating, Characterizing, and Controlling Chemistry with SERS Hot Spots. Phys.Chem.Chem.Phys. 15, 21-36 (2013).
- Fan, M., Andrade, F. S., Brolo, A. G. A Review on the Fabrication of Substrates for Surface Enhanced Raman Spectroscopy and their Applications in Analytical Chemistry. Anal. Chim. Acta. 693, 7-25 (2011).
- Cao, Y., Li, D., Jiang, F., Yang, Y., Zh, H. Engineering Metal Nanostructure for SERS Application. J. Nanomater. 123812, 1-12 (2013).
- Glembocki, O., Rendell, R., Alexson, D., Prokes, S., Fu, A., Mastro, M. Dielectric-Substrate-Induced Surface-Enhanced Raman Scattering. Phys. Rev. B. 80, 085416(2009).
- Merlen, A., et al. Surface Enhanced Spectroscopy with Gold Nanostructures on Silicon and Glass Substrates. Surf. Sci. 605, 1214-1218 (2011).
- Muhammad, M., Buswell, S. C., Dew, S. K., Stepanova, M. Nanopatterning of PMMA on Insulating Surfaces with Various Anticharging Schemes Using 30 keV Electron Beam Lithography. J. Vac. Sci. Technol. B. 29, 06F304(2011).
- Peters, R., Fito, T., Gutierrez-Rivera, L., Dew, S. K., Stepanova, M. Study of Multilayer Systems in Electron Beam Lithography. J. Vac. Sci. Technol. B. 31, 06F407(2013).
- Gutierrez-Rivera, L., Peters, R., Dew, S., Stepanova, M. Application of EBL Fabricated Nanostrucutred Substrates for SERS Detection of Protein A in Aqueous Solution. J. Vac. Sci. Technol.B. 31, (2013).
- Gutierrez-Rivera, L., Peters, R., Dew, S., Stepanova, M. Surface-Enhanced Raman Spectroscopy Detection of Protein-Ligand Binding Using D-glucose and Glucose Binding Protein on Nanostructured Plasmonic Substrates. , (2014).
- Peters, R. Fabrication and Testing of Surface-Enhanced Raman Spectroscopy Substrates for the Detection of Biomolecules [MSc Thesis]. , University of Alberta. (2014).
- Gouda, H., Torigoe, H., Saito, A., Sato, M., Arata, Y., Shimada, I. Three-Dmensional Solution Structure of the B Domain of Staphylococcal Protein A: Comparisons of the Solution and Crystal Structures. Biochemistry. 31, 9665-9672 (1992).
- Cuneo, M. J., Johnson, S. J., Beese, L. S., Hellinga, H. W. High Resolution Structure of E. Coli Glucose/Galactose Binding Protein Bound with Glucose. Research Collaboratory for Structural Bioinformatics (RCSB) Protein Data Bank. , (2009).
- Humphrey, W., Dalke, A., Schulten, K. VMD - Visual Molecular Dynamics. J. Molec. Graphics. 14, 33-38 (1996).
- Walsh, R., DeRosa, M. C. Retention of Function in the DNA Homolog of the RNA Dopamine Aptamer. Biochem. Biophys. Res. Comm. 388, 732-735 (2009).
- Akitomi, J., Kato, S., Yoshida, Y., Horii, K., Furuich, M., Waga, I. ValFold: Program for the Aptamer Truncation Process. Biomed. Inf. 7, 38-40 (2011).
- Han, K., Lee, Y., Kim, W. PseudoViewer: Automatic Visualization of RNA Pseudoknots. Bioinformatics. 18, S321-S327 (2002).
- Dwyer, M. A., Hellinga, H. W. Periplasmic Binding Proteins: a Versatile Superfamily for Protein Engineering. Curr. Opin. Struct. Biol. 14, 495-504 (2004).
- Benson, D. E., Conrad, D. W. Design of Bioelectronic Interfaces by Exploiting Hinge-Bending Motions in Proteins. Science. 293, 1641-1644 (2001).
- Bozic, S., Chorzempa, J. Pirahna Cleaning. , University of Alberta. (2011).
- Mohammad, M. A. Raith 150TWO SOP. , University of Alberta. (2011).
- Schmidt, M. W., et al. General Atomic and Molecular Electronic Structure System. J. Comput. Chem. 14, 1347-1363 (1993).
- Bode, B. M., Gordon, M. S. MacMolPlt: a Graphical User Interface for GAMESS. J. of Mol. Graph. Mod. 16, 133-138 (1998).
- Bright, A., Devi, T. S. R., Gunasekaran, S. Spectroscopical Vibrational Band Assignment and Qualitative Analysis of Biomedical Compounds with Cardiovascular Activity. Int. J. Chem. Tech. Res. 2, 379-388 (2010).
- Bandekar, J. Amide Modes and Protein Conformation. Biochim. Biophys. Acta. 1120, 123-243 (1992).
- Barth, A., Zscherp, C. What Vibrations Tell About Proteins. Quarterly Reviews of Biophysics. 35, 369-340 (2002).
- Chrimes, A. F., Khoshmanesh, K. h, Stoddart, P. R. M. itchellA., Kalantar-Zadeh, K. Microfluidics and Raman Microscopy: Current Applications and Future Challenges. Chem. Soc. Rev. 42, 5880-5906 (2013).
- Park, S. -K., Lee, N. -S., Lee, S. -H. Vibrational Analysis of Dopamine Neutral Base based on Density Functional Force Field. Bull.-Korean Chem. Soc. 21, 959-968 (2000).
- Briand, E., Salmain, M., Compère, C., Pradier, C. M. Immobilization of Protein A on SAMs for the elaboration of immunosensors. Coll. Surf. B: Biointerfaces. 53, 215-224 (2006).
- Lakowicz, L. R., et al. Radiative decay engineering: 2. Effects of Silver Island Films on Fluorescence Intensity, Lifetimes, and Resonance Energy Transfer. Analytical biochemistry. 301, 261-277 (2002).
Reprints and Permissions
