A technique to isolate human hepatocytes and non-parenchymal liver cells from the same donor is described. The different liver cell types build the basis for functional liver models and tissue engineering. This new method aims to isolate liver cells in a high yield and viability.
Method Article
Protocol for Isolation of Primary Human Hepatocytes and Corresponding Major Populations of Non-parenchymal Liver Cells
* These authors contributed equally
In This Article
Summary
Abstract
Beside parenchymal hepatocytes, the liver consists of non-parenchymal cells (NPC) namely Kupffer cells (KC), liver endothelial cells (LEC) and hepatic Stellate cells (HSC). Two-dimensional (2D) culture of primary human hepatocyte (PHH) is still considered as the "gold standard" for in vitro testing of drug metabolism and hepatotoxicity. It is well-known that the 2D monoculture of PHH suffers from dedifferentiation and loss of function. Recently it was shown that hepatic NPC play a central role in liver (patho-) physiology and the maintenance of PHH functions. Current research focuses on the reconstruction of in vivo tissue architecture by 3D- and co-culture models to overcome the limitations of 2D monocultures. Previously we published a method to isolate human liver cells and investigated the suitability of these cells for their use in cell cultures in Experimental Biology and Medicine1. Based on the broad interest in this technique the aim of this article was to provide a more detailed protocol for the liver cell isolation process including a video, which will allow an easy reproduction of this technique.
Human liver cells were isolated from human liver tissue samples of surgical interventions by a two-step EGTA/collagenase P perfusion technique. PHH were separated from the NPC by an initial centrifugation at 50 x g. Density gradient centrifugation steps were used for removal of dead cells. Individual liver cell populations were isolated from the enriched NPC fraction using specific cell properties and cell sorting procedures. Beside the PHH isolation we were able to separate KC, LEC and HSC for further cultivation.
Taken together, the presented protocol allows the isolation of PHH and NPC in high quality and quantity from one donor tissue sample. The access to purified liver cell populations could allow the creation of in vivo like human liver models.
Introduction
Human liver tissue is highly complex and consists of two different cell entities, parenchymal cells and non-parenchymal cells (NPC). Parenchymal liver cells include hepatocytes and cholangiocytes. Hepatocytes represent 60 to 70% of total liver cells and account for most of the metabolic liver functions, e.g., bile acid and complement factor synthesis, biotransformation and energy metabolism2,3.
The smaller NPC fraction constitutes 30-40% of total liver cells. NPC include different cell populations, namely Kupffer cells (KC), liver endothelial cells (LEC) and the hepatic stellate cells (HSC). This heterogenic cell fraction plays a central role in physiological processes of the liver. Additionally, NPC participate in mediating acute liver damage, e.g., drug-induced liver injury (DILI) as well as in chronic liver injuries, such as cirrhosis4.
In recent years, human liver cells have become more and more essential in research and development of drug testing, drug development and identification of new biochemical pathways in liver diseases. For in vitro testing PHH monocultures are still considered as the "gold standard"5. The main limitation of current homotypic liver models is dedifferentiation and loss of function of the hepatocytes within a few days4. The establishment of 3-dimensional (3D) culture techniques has shown that these limitations can be compensated4,6. However, even modern 3D culture techniques are not able to display all hepatotoxic modes of actions7. Missing NPC populations in the existing in vitro models are discussed as a possible reason for this discrepancy to the in vivo situation. It has been shown that the cell-cell communication between the different liver cell populations plays a central role in physiological homeostasis but also in pathophysiologic processes8. Therefore the scientific attention focuses more and more on NPC and their cell-cell interactions. Their purposeful use in co-culture and tissue engineered systems could be a solution for the high demand of in vitro liver models8,9 which are as close to the in vivo situation as possible.
Currently the main challenge is the development of a standardized human liver co-culture model, which contains clearly defined portions of PHH and NPC. In consequence, isolation techniques for the very heterogenic liver cells are needed and those have to be optimized to gain pure cell populations. While standardized protocols for PHH isolation exist10, the standardized isolation of human NPC is still under development. Most published NPC isolation protocols are based on experiments with non-human cells11,12. Only a few publications describe the isolation process of human NPC and most cover only methods for the isolation of a single cell type11-16. The most important cell characteristics that have been harnessed for cell separation are size, density, attachment behavior, and the expression of surface proteins. On the basis of these characteristics we developed a simplified protocol to isolate PHH, KC, LEC and HSC, which was published previously in Experimental Biology and Medicine1. Because of the broad interest in this technique, the aim of this article was to provide a more detailed protocol for the liver cell isolation process including a video, which will allow reproducing the technique more easily. The protocol also includes quality control methods for evaluation of yield and viability as well as for identification and purity evaluation using specific immunostainings.
Protocol
Note: All cells were isolated from resected non-tumorous human liver tissue, which remained after partial liver resection with primary or secondary liver tumors. Informed consent of the patients was obtained according to the ethical guidelines of the Charité - Universitätsmedizin Berlin.
1. Preparation of Materials and Solutions
- Sterilize all instruments and the materials in advance to avoid bacterial contamination during the isolation process.
- Prepare the solutions required for the perfusion of the liver tissue sample, the isolation process of hepatocytes and non-parenchymal liver cells and the cultivation of primary human liver cells according to the Tables 1 and 2, with exception of Digestion-Solution which is prepared freshly prior to use. All solutions can be stored at 4 °C and it is recommended to use them within 4 weeks after preparation.
- Sterilize all solutions using a 0.22 µm bottle top filter.
2. Preparation of Perfusion Equipment
- Set up the equipment for the perfusion and digestion of the liver tissue sample as shown in Figure 1A.
- Adjust the water bath temperature to 39 °C to ensure optimal collagenase P activity during the perfusion and digestion.
3. Perfusion and Digestion of the Liver Tissue Sample (1.5 hr)
- Select a tissue sample with an intact Glisson's capsule from the resected liver tissue. When cutting the tissue sample, try to obtain a small cutting surface with good visible vessels. Avoid warm ischemia times by transporting and handling the liver tissue sample on ice until perfusion.
- Take the tissue weight under sterile conditions and place the liver tissue sample in a Petri dish in the laminar air flow. Clean the surface of the tissue sample with a sterile compress from remaining blood and flush the cannula set using 1x Perfusion-Solution I to ensure that all cannula were permeable.
- Use tissue glue to fix the olives of the cannulas in some larger blood vessels. Depending on the size of the liver tissue sample and the number of the vessels on the surface, use a cannula set with 3 to 8 cannulas. Test the perfusion and check for leakages. Close all blood vessels, which leak clear 1x Perfusion-Solution I, with tissue glue.
- Place the cannulated liver tissue sample into the Büchner funnel on its perforated filter disc (Figure 1A).
- Set the flow rate of the peristaltic pump between 7.5 ml/min and 14.6 ml/min depending on the number of cannulas used and on the resistance of the liver tissue. Adjust the flow rate each time to ensure that there is a current but slow perfusion. Perfuse the tissue until the whole blood is flushed out but at least 20 min. Observe the tissue become brighter in areas with good perfusion.
Note: In some cases, it may be necessary to clamp one of the cannulas with plastic clamps or to increase the inner pressure of an area by pushing softly with a spatula against the liver capsule, to optimize the perfusion. A complete color change to a light yellow to light brownish color indicates a good perfusion. - Change the perfusion fluid to Digestion-Solution containing collagenase P (Table 1).
- Rearrange the setup (Figure 1A) for the digestion step. Therefore perform a circular flow of Digestion-Solution according to Figure 1B for up to 15 min.
Note: It is critical to stop the perfusion immediately when the liver tissue sample is sufficiently digested. A good digestion can be observed, when the tissue shows no sign of elasticity as assessed by maintenance of capsule deformations, when it is pushed with a spatula.
4. Isolation of Hepatocytes (1 hr)
- Turn the peristaltic pump off and place the liver tissue sample in a glass dish. Rinse the outside of the tissue sample with ice cold Stop-Solution (Table 1). Remove the cannulas from the liver tissue sample. Use a scalpel to open the liver tissue sample, by incising in the middle of the area where the cannulas were attached. Keep care that the Glisson´s capsule stays intact.
- Rinse the inside of the tissue sample and then cover the whole tissue sample with ice cold Stop-Solution. Shake the tissue gently to release the cells out of the tissue.
- Collect the cell suspension and filter it through a gaze funnel (plastic funnel lined with gauze compress) into 50 ml plastic tubes. Add more Stop-Solution to the liver tissue sample until a final volume of 500 ml is consumed.
- Centrifuge the cell suspension at 50 x g, 5 min, 4 °C. Collect the supernatant for later non-parenchymal cell isolation. Wash the cell pellet with PBS (Figure 2A).
- Centrifuge the cell suspension again at 50 x g, 5 min, 4 °C. Collect the supernatant and re-suspend the pellet in Hepatocyte Incubation medium (Table 2, Figure 2B).
- Determine the cell number and viability in the resulting cell suspension using trypan blue staining. Count the living and dead cells in a Neubauer counting chamber. Calculate the cell number, viability and yield of PHH using the formulas below.
yield (counted cells) = counted cells x dilution factor x volume of cell suspension (ml) x 10,000
yield (hepatocytes/(g liver tissue sample)) = (yield (hepatocytes/(ml media)) x Volume of cell suspension (ml))/(weight of liver tissue sample (g))
viability (%) = 100% x (number of live cells)/(total cell number)
5. Purification of Hepatocytes (1 hr)
Note: This purification step is recommended, if the viability is lower than 70%.
- Perform all steps on ice. Prepare a 25% density gradient by mixing 5 ml density gradient solution and 15 ml PBS for density gradient centrifugation.
- Put a maximum of 50 Mio cells in total out of the hepatocyte rich cell suspension carefully and slowly on top of the 25% density gradient layer to ensure that a clear separation of both layers is achieved (Figure 2C). Put the tubes carefully into the centrifuge and centrifuge at 1,250 x g, 20 min, 4 °C without brake (Figure 2D).
- Aspirate the remaining cell suspension and the dead cells in the interphase. Depending on the fat content one might also aspirate the density gradient-solution.
Note: PHH with low lipid content form a dense pellet and the density gradient can be aspirated completely. PHH with high lipid content form a more diffuse pellet and a lot of viable cells may remain in the density gradient solution above the pellet. - Re-suspend the hepatocyte pellets with PBS and centrifuge again at 50 x g, 5 min, 4 °C. Pool the pellets, wash again with PBS and re-suspend purified PHH in Hepatocyte Incubation medium. Perform cell counting as described in step 4.6.
6. Cultivation of Hepatocytes
- Prepare the cell culture dishes for seeding of PHH by coating them with an extracellular matrix, for example rat tail collagen (collagen type I). Prepare the rat tail collagen according to the protocol established by Rajan et al.17
- Dilute the rat tail collagen stock solution 1:200 in PBS. Transfer 100 µl/cm2 rat tail collagen solution into the culture dishes, taking care that the whole surface is covered. Incubate the cell culture plastics for 20 min at room temperature. Aspirate the remaining rat tail collagen solution.
- Seed 15 x 104 hepatocytes/cm2 in Hepatocyte Incubation medium on culture dishes coated with rat tail collagen. Cultivate the cells in a humidified incubator at 37 °C, 5% CO2 for at least 4 hr. After 4 hr the hepatocytes have adhered and the medium can be changed.
- Perform investigations depending on the experimental setup. A culture time of 48 hr is recommended to allow the cells to recover from the isolation process.
7. Isolation of Non-parenchymal Liver cells (1.5-2 hr)
- Centrifuge the collected supernatant (step 4.5 and 4.6) at 72 x g, 5 min, 4 °C to eliminate the remaining erythrocytes and hepatocytes. Pool the supernatants and centrifuge them twice to gain two cell pellets: 300 x g, 5 min, 4 °C for the sedimentation of HSC, LEC and partly KC and 650 x g, 7 min, 4 °C for sedimentation of the remaining KC.
- Pool both pellets and re-suspend them in HBSS. Prepare a 25% and a 50% density gradients by mixing density gradient solution and PBS for density gradient centrifugation (25% density gradient solution: 5 ml density gradient solution and 15 ml PBS, 50% density gradient solution: 10 ml density gradient solution and 10 ml PBS, see Figure 2). Place the 25% density gradient solution carefully on top of the 50% density gradient solution layer.
- Put the NPC suspension carefully and slowly on top of the 25% density gradient solution layer in a way that a clear separation of both layers is achieved.
- Centrifuge the cell suspension on the density gradient at 1,800 x g, 20 min, 4 °C without brake (Figure 2.2).
- Aspirate dead cells and cell debris from the uppermost layer. The NPC are located in the interphase between the 25% and 50% density gradient layer (Figure 2). Collect NPC, wash them with HBSS and centrifuge the cell suspension applying the above described dual centrifugation step (step 7.2.).
8. Separation of Kupffer Cells (Adherence Separation Step) (1 hr)
- Perform a cell count for the KC in the NPC fraction as described in step 4.6. (For appearance of KC in suspension see Figure 3B). Centrifuge the NPC fraction with the above described dual centrifugation step (step 7.2) and re-suspend the NPC in Kupffer Cell seeding medium (Table 2).
- Seed the KC containing fraction on plastic cell culture vessels at a density of 5 x 10⁵ KC/cm2. Incubate the KC cultures for 20 min in a humidified incubator at 37 °C, 5% CO2. Primary KC adhere on cell culture plastics within a short period of time (Figure 2.3).
- Collect the supernatant containing not adhered NPC, consisting mainly of LEC and HSC. Pool the supernatants for later separation of LEC (see section 9) and HSC (see section 10). Wash the adherent KC with HBSS and cultivate them in Kupffer Cell culture medium (Table 2) at 37 °C, 5% CO2 in a humidified incubator.
9. Separation of Endothelial Cells (1.5 hr)
- Centrifuge the collected supernatant (step 8.5.) at 300 x g, 5 min, 4 °C. Wash the pellet with PBS. After centrifugation at 300 x g, 5 min, 4 °C re-suspend the cells in Stellate Cell/Endothelial Cell separation medium and perform a cell count for all remaining cells as described in step 4.6.
- Re-suspend 1 x 10⁷ Mio cells in 1 ml Stellate Cell/Endothelial Cell separation medium, add 20 µl Blocking Solution from the MACS-KIT and 20 µl of the CD31 Micro Beads for immunolabeling and incubate the resulting suspension for 15 min at 4 °C temperature (Figure 2.4).
- Separate LEC from HSC as described in the manufacturer´s protocol for the magnetically activated cell sorting system MACS (Figure 2.5). Elute magnetically retained CD31-positive LEC and suspend them in Stellate Cell/Endothelial Cell culture medium (Table 2).
- Perform cell counting for LEC as described in step 4.6. Seed LEC in a density of 1.25 x 10⁵ cells/cm2 in cell culture vessels coated with rat tail collagen (see step 6.1). Cultivate the cells at 37 °C, 5% CO2 in a humidified incubator.
10. Separation of Stellate Cells (0.5 hr)
- Unlabeled HSC pass the separation column during the MACS procedure. Collect the HSC fraction (see step 9.5, Figure 2.5). Perform cell counting as described in step 4.6.
- Seed HSC with a density of 5 x 10⁴ cells/cm2 in cell culture vessels coated with rat tail collagen (see step 6.1) in Stellate Cell/Endothelial Cell culture medium (Table 2) and cultivate them at 37 °C, 5% CO2 in a humidified incubator.
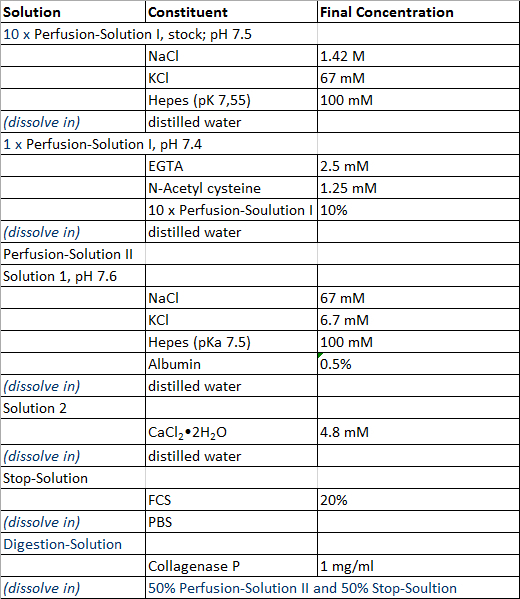
Table 1: Perfusion and isolation solution.
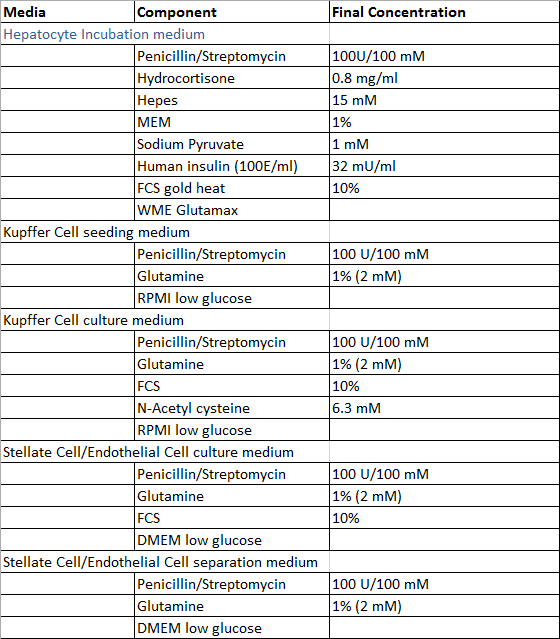
Table 2: Culture and isolation media.
Results
The separation into a parenchymal and non-parenchymal fraction, using density gradient centrifugation as a clean-up procedure combined with the use of adherence properties and MACS leads to successful PHH and NPC isolation. PHH and NPC can be isolated in high quality and quantity. Figure 1 shows the representative setup of the equipment for liver perfusion and digestion. 10% FCS was added to the collagenase P containing Perfusion - Solution II to reduce proteolytic activity of proteases and to stabilize collagenase P activity in return. In consequence longer digestion times required for NPC isolation can be applied without a negative impact on viability of PHH.
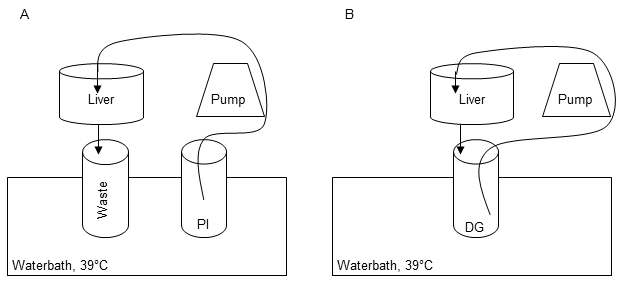
Figure 1: Perfusion and digestion setup. The first perfusion step is carried out in order to remove residual blood, warm up the tissue and remove Ca2+ to dissolve cell-cell-connections by using 1x Perfusions Solution I (PI) (A). Recirculation of Digestion-Solution (DG) is performed for digestion of the liver tissue during perfusion step II (B).
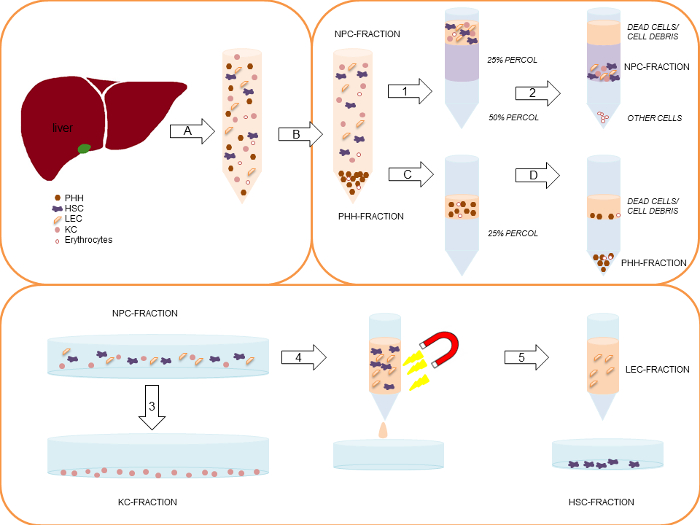
Figure 2: Simplified schematic representation of the complete PHH and NPC isolation process. Modified from Pfeiffer et al.1, 2014 with permission of Experimental Biology and Medicine. First, the liver tissue sample is perfused and digested by a two-step EGTA/collagenase P perfusion technique (A). The gained cell suspension is centrifuged initially at 50 x g, 5 min, 4 °C (B), to separate the larger PHH-fraction (pellet) from the smaller NPC-fraction (supernatant). In case of a PHH viability below 70%, the viable PHH fraction can be enriched by a density gradient centrifugation at 1,250 x g, 20 min, 4 °C (C) resulting in settling of the PHH at the bottom of the tube, while dead cells/ cell debris are located on top of the density gradient layer (D). Collected supernatants of the initial centrifugation (1) are centrifuged using two steps: 1) 300 x g, 5 min, 4 °C and 2) 650 x g, 7 min, 4 °C. After the first centrifugation KC are partly located in the supernatant. In this context the second isolation step is necessary. The gained cell pellets are pooled and re-suspended in HBSS. Subsequently, the cell suspension are carefully layered on top of a two-layer (25%/50%) density gradient. The layered density gradient tubes are centrifuged at 1,800 x g, 20 min, 4 °C (2). Dead cells on top of the 25% density gradient layer are discarded. NPC located between the interphase of the 25% and the 50% density gradient layer are collected and pooled. The NPC fraction is seeded on uncoated cell culture plastics. Using a 20 min incubation time (adherence separation step) KC are separated from other liver cell populations (3). LEC and HSC are separated by using the MACS-kit. Therefore the collected remaining liver cells in the supernatant are centrifuged at 300 x g, 5 min, 4 °C, and are labeled with CD31-conjugated MicroBeads (4). Only CD31-negative HSC pass the MACS separation column (5). CD31-positive LEC stick to the column. Finally the column is removed from the magnetic device and the CD31-positive LEC are eluted out of the column (5). Please click here to view a larger version of this figure.
The isolated PHH showed a yield of 14.2 x 10⁶ ± 6.6 x 10⁶ viable PHH/g liver tissue and a viability about 76.6 ± 4.2% (Table 31). Microscopically visible features were a typical large cytoplasmic volume in combination with lipid droplets and between one and four nuclei, (Figure 3A). The cell size varies between 20 to 30 µm in suspension.
KC were the most common cell type in the NPC fraction. We isolated approximately 1.9 x 10⁶ ± 0.2 x 10⁶ viable KC/g liver tissue with a viability of 92.8 ± 3.5% (Table 31). KC are very small cells (about 5 µm) with a low cytoplasm/nucleus ratio and typical microvilli on the surface (Figure 3B).
Finally we used the MACS separation technique to separate CD31-positive LEC from the remaining CD31-negative HSC. The yield of LEC was approximately 2.7 x 10⁵ ± 0.1 x 10⁵ viable LEC/g liver tissue and the achieved viability was 95.6 ± 2.8% (Table 31). Identification criteria are the multiple granulae and a size of about 10 µm in cell suspension (Figure 3C) as well as the characteristic spindle shape after a short cultivation time (Figure 3G).
The isolation process resulted in a HSC yield about 4.7 x 10⁵ ± 0.2 x 10⁵ viable HSC/g liver (N = 8) with a viability of 89.6 ± 3.8% (Table 31). Microscopically identifiable characteristics were a size of about 20 µm and a typical granulated appearance with a varying amount of lipid droplets (Figure 3D).

Table 3: Yields, viability and purity of isolated PHH and NPC. Three different donors were evaluated. Data are given as mean ± SD. This Table was published before in Pfeiffer et al.1, 2014 and is reprinted with permission from Experimental Biology and Medicine.
For the identification and determination of cell culture purity, every isolated cell fraction was treated with antibodies against cell type specific antigens. The cells were treated with fluorescent secondary antibodies and investigated by immunofluorescence microscopy. The purity was determined by counting positive fluorescent stained cells in relation to the total cell number visualized by Hoechst staining.
After 24 hr of cultivation PHH showed a characteristic polygonal shape and often polyploidy (Figure 3E). PHH were positive for CK 18 (Figure 3I) and showed a purity of 92.3 ± 3.2% (Table 31).
KC adhered within 20 min on cell culture plastic surfaces. After an incubation time of 24 hr small round cells with a prominent round cell nucleus were observed (Figure 3F). The surface protein CD68 was used to identify KC (Figure 3J). The purity of CD68 positive cells amounted to 81.0 ± 5.4% (Table 31).
Despite the MACS separation using CD31 labelling during the NPC separation it was still possible to stain isolated LEC with CD31. Therefore the isolated and cultivated LEC were stained with CD31 for identification and determination of purity. Additionally LEC showed immunoreactivity for the mesenchymal cell marker vimentin (Figure 3K). We observed approximately 81.0 ± 1.7% of positive stained cells (Table 31).
HSC with their typical prominent lipid droplets (Figure 3H) were marked by immunofluorescence staining for GFAP (Figure 3L). HSC purity was 93.0 ± 1.7% (Table 31).
Every cell fraction was counterstained with other NPC markers. All cell fractions contained a small number of other liver specific cell types, but were negative for the hepatocyte marker CK18 and the cholangiocyte marker CK19.

Figure 3: Morphology of human parenchymal and non-parenchymal liver cells in suspension and after adherence. The left column (A-D) shows the different isolated liver cell populations directly after the isolation process in phase contrast microscopy view: PHH (A), KC (B), LEC (C), and HSC (D). The middle column (E-H) presents images of isolated and cultivated PHH (E), KC (F), LEC (G) and HSC (H) after 24 hr of cultivation (phase contrast microscopy). Immunofluorescence-based characterization of the different cell fractions is shown in the last column: PHH showed positive signals for the hepatocyte marker CK18 (I, 24 hr after isolation), KC were positive for the marker CD68 (J, 24 hr after isolation), LEC showed positive signals for vimentin (K, 72 hr after isolation) and HSC were positive for GFAP (L, 72 hr after isolation). Cell nuclei were stained with Hoechst; magnification: 400X. Modified from Pfeiffer et al.1, 2014 with permission of Experimental Biology and Medicine. Please click here to view a larger version of this figure.
Discussion
The published protocol describes a technique to isolate pure PHH and NPC, namely KC, HSC and LEC, simultaneously in high quality and purity from the same sample of human liver tissue. The majority of publications dealing with liver cell isolations cover only one of those cell populations18-20 and isolation procedures performed with human tissue are rare (reviewed by Damm et al.)21. Adaption of methods established with animal tissue (e.g., rat liver) to human liver revealed several differences in cell properties between animal and human cell populations. The establishment of a liver cell isolation method covering the different liver cell populations revealed that combining the parenchymal and non-parenchymal cell isolation is a critical step due to the difference in digestion time required for optimized results. Facing this challenge we developed a liver cell isolation protocol combining different techniques and adapted these to our PHH isolation protocol10.
By addition of 10% FCS to the collagenase P containing Solution II we were able to reduce the proteolytic activity of proteases. This modification allowed longer digestion times, necessary for gaining high numbers of NPC. In consequence we were able to isolate PHH as well as NPC of good quality and in high quantity. Successful liver cell isolation depends strongly on the initial tissue quality. The donor data and anamnesis can influence the cell quality and quantity. From our experience there is no correlation with donor specific factors and also very experienced staff can be faced to unsuccessful cell isolation. Because the quality of the donor tissue is a critical point, all external sources, which may impair the tissue quality, have to be minimized.
Most critical factors are warm ischemia times after the surgical intervention and cold ischemia times during transport of the tissue to the laboratory. Additionally any sources for bacterial infections should be avoided. It has to be noted that sometimes the organ itself can contain bacterial contamination, e.g., in case of bile tract diseases. Critical steps within the isolation procedure cover the perfusion times and density gradient centrifugation steps. The first perfusion step should last 20-30 min. Shorter perfusion times may lead to incomplete detachment of cell-cell contacts resulting in the occurrence of cell clusters in the gained cell suspension. A prolonged first perfusion reduces cell viability and induces cell stress due to Ca2+ depletion.
The second perfusion step performed for enzymatic tissue digestion requires some experience to determine the optimal digestion degree for taking decision about stopping the proteolytic reaction at the right time point. Short digestion times lead to low yields and prolonged digestion times to cell stress and cell damage. From our experience the time frame between undigested tissue and damaged tissue during the digestion often lies within a window of 1-3 min. An incomplete perfusion can be countered by shifting the pressure within the tissue into another area using clamps for pinching off cannulas. Additionally soft pressure with a spatula towards the tissue sample leads to a change in tissue perfusion. The tissue is compressed and the inner pressure increases. Subsequently, the blood vessels are also compressed and their radius decreases. With a decrease in radius, the resistance increases (Hagen-Poiseuille law) and the perfusion solution prefers the way of least resistance and perfuses other areas. In accordance with Baccarani and co-workers we observed that fibrotic or cirrhotic tissue needs a longer digestion period leading to lower cell viabilities22. For this reason we recommend to avoid tissue of patients with liver fibrosis or cirrhosis.
The preparation and handling of the density gradients as well as harvesting cells out of the gradients (see step 5 and 7) also cover critical steps. The different density gradient layers and the cell suspension have to be transferred in a slow and careful way for creation of sharp interphases. Additionally there is always the risk to damage the gradient during the handling, especially while harvesting the cells. During the NPC separation the adherence separation step is crucial for later yields and purity of all NPC fractions. To increase the cell number of not adhered NPC and the purity of KC an additional washing step can be helpful. The washing solution of this step is pooled with the supernatants for further NPC separation. To avoid contamination by bacteria, fungi or virus strict aseptic conditions have to be ensured23.
In dependence of the required cell populations the protocol can be changed and adjusted by skipping specific steps. For example if only KC are required the dual centrifugation step for NPC sedimentation can be reduced to the second centrifugation step and the steps for HSC and LEC separation can be dropped. Perfusion times and g-force for the centrifugation may also be varied in dependence of tissue and cell quality. Fibrotic tissue requires prolonged digestion times, therefore there is a need to carefully control the tissue elasticity. Accumulation of lipid droplets in fatty hepatocytes decreases the cell density and therefore changes sedimentation properties. According to our observations it can be useful to adjust the g-force during PHH isolation depending on the lipid content of the PHH, when high PHH quantities are required. It has to be noted that any changes of the initial centrifugation step will negatively influence the NPC isolation in terms of quality and quantity. So far, we recommend g-forces between 50 x g (hepatocytes with low fat content) and 150 x g (hepatocytes with high fat content). Additionally fatty hepatocytes tend to form a less compact cell pellet after density gradient centrifugation and the further cell harvesting has to be changed as described in step 5.5.
To speed up the isolation procedure some steps can be done simultaneously. For example in parallel with the purification of the isolated hepatocytes a second person can begin with the NPC isolation. Additionally the density gradient solutions can be prepared in advance. If there are more than two persons even more steps can be performed at the same time.
In comparison to other human liver cell isolation protocols our results show similar or higher cell yields and viabilities as published previously in Experimental Biology and Medicine1. For KC isolation Alabraba and coworkers demonstrated isolation results with a yield of 2.3 x 10⁶ viable KC/g liver tissue combined with a viability of about 98%13, which are comparable to our KC results (cell number: 1.9 x 10⁶ viable KC/g liver tissue, viability about 93%). The majority of published LEC isolation data describe isolations from whole organs15,24. Gerlach and coworkers as well as Lalor and coworkers isolated cell numbers between 103 and 106 cells/ organ15,24. These data cannot be compared directly to cell isolations from tissue samples. However, using our protocol we showed yields for LEC of 2.7 x 10⁵ viable LEC/g liver tissues, which are by far larger when extrapolated on a whole organ. HSC were isolated with a yield of about 4.7 x 10⁵ viable HSC/g liver tissues and viability about 90%. Existing results published by Friedman and coworkers showed half lower cell yields (2.3 x 10⁵ HSC/g livers), but a similar purity (91%)14. Regarding our protocol, low cell yields can be caused by bad perfusion and digestion due to low or no circulation of 1x Perfusion-Solution I and Digestion-Solution within the tissue. Additionally gas bubbles in the tissue can disturb the intra-tissue circulation of 1x Perfusion-Solution I and Digestion-Solution. In these cases, the perfusion can be improved by increasing the perfusion pressure and elimination of gas bubbles by clamping single cannulas and/or using a spatula for pushing against the tissue sample. A bad viability is in most cases a consequence of cell stress. Prolonged ischemia times, damage by Ca2+ depletion and proteolysis of membrane proteins are linked to cell damage, visible by blebs of the cellular membrane. From our observations these cells a very sensitive to shear stress and in most cases die during the isolation procedure. In summary, successful isolation and separation of parenchymal and non-parenchymal liver cells requires that critical steps are performed in the right time frame, pipetting steps are performed carefully and in general the time for the cell isolation and separation should be kept as short as possible21. A disadvantage of the described protocol is that the isolation conditions (e.g., perfusion times) cannot be completely standardized, but have to be adapted individually to the tissue quality. In addition, the yield and purity of the gained cell populations can vary in dependence of the tissue quality and the digestion outcome.
We recently published a study demonstrating the influence of cultivation conditions combined with functional characterization of each NPC cell type isolated by this method1. The possibility to isolate and separate different cell populations of the liver allows creation of innovative human liver cell co-cultures and tissue-engineered in vitro liver models. It is well known that PHH cultivation in 2D mono-cultures leads to dedifferentiation and loss of typical cell functions7. For this reason it is necessary to mimic the in vivo tissue architecture within in vitro liver models. Kostadinova and coworkers (20138,9) as well as Messner and coworkers (20138,9) successfully established functional co-culture liver models for the detection of hepatotoxic effects. However, NPC were not characterized and specific functions were not investigated in these systems.
Therefore further research should focus on investigations on the long-term survival of NPC, their specific characteristics and interactions within co-cultures. For such studies, it could also be of interest to establish a protocol for isolation of cholangiocytes. Realization of functional in vitro co-cultures including all cell types contained in the native liver could be a further step into the direction of in vivo like human liver models.
Disclosures
The authors declare that they have no competing interests.
Acknowledgements
We would like to thank Jia Li Liu for their support in creation of Figure 1. This study was supported by the German Federal Ministry of Education and Research (BMBF) project Virtual Liver: 0315741.
Materials
| Name | Company | Catalog Number | Comments |
|---|---|---|---|
| General Equipment | |||
| PIPETBOY | Eppendorf | ||
| pipettes | Eppendorf | ||
| microscope | Carl Zeiss | ||
| microscope | Olympus | ||
| CO2-incubator | Binder | ||
| Lamin Air | Heraeus | ||
| Centrifuge Varifuge 3.0R | Heraeus | ||
| Urine Beaker | Sarstedt | 2041101 | |
| perfusor syringe 50 ml | B.Braun | 12F0482022 | |
| Bottle Top Filter | Nalgene | 1058787 | |
| Falcon 50 ml Polypropylene Conical Tube | BD Biosciences | 352070 | |
| Falcon 15 ml Polypropylene Conical Tube | BD Biosciences | 352096 | |
| Tissue Culture plate | BD Biosciences | 533047 | 24 well |
| serological pipettes | BD Biosciences | 357525, 357551, 357543 | 25 ml, 10 ml, 5 ml |
| pipette tips | SARSTEDT | 0220/2278014, 0005/2242011, 0817/2222011 | 100 µl, 200 µl, 1,000 µl |
| Name | Company | Catalog Number | Comments |
| Isolation Equipment | |||
| water bath | Lauda | ||
| peristaltic pump | Carl Roth | ||
| circulation thermostat | Lauda | ||
| pH meter | Schott | ||
| fine scales | Sartorius | ||
| stand | |||
| Büchner funnel | Haldenwanger | ||
| plastic funnel | |||
| silicone tube | |||
| cannulae with olive tips | |||
| glass dish | |||
| forceps | |||
| scalpel | Feather | 12068760 | |
| Neubauer counting chamber | Optic Labor | ||
| cell lifter | Costar | ||
| Surgical Drape | Charité Universitätsmedizin Berlin | A2013027 | |
| compress | Fuhrmann | 40013331 | |
| sterile surgical gloves | Gammex PF | 1203441104 | |
| Tissue glue | B. Braun | 1050052 | |
| glass bottle | VWR | ||
| Collagenase P | Roche | 13349524 | |
| Percoll Separating Solution | Biochrom | L6145 | Density 1.124 g/ml |
| Hank’s BSS | PAA | H00911-3938 | |
| Dulbecco’s PBS | PAA | H15 - 002 | without Mg/Ca |
| Ampuwa | Plastipur | 13CKP151 | |
| Albumin | Sigma-Aldrich | A7906 | |
| NaCl | Merck | 1,064,041,000 | |
| KCl | Merck | 49,361,000 | |
| Hepes Pufferan | Roth | 133196836 | |
| EDTA | Sigma | E-5134 | |
| Name | Company | Catalog Number | Comments |
| Media Equipment | |||
| DMEM | PAA | E15-005 | Low Glucose (1 g/L) (without L-Glutamine) |
| HEPES Buffer Solution 1 M | GIBCO | 1135546 | |
| L-Glutamine | GIBCO | 25030-024 | 200 mM |
| MEM NEAA | GIBCO | 11140-035 | |
| penicillin/streptomycin | GIBCO | 15140-122 | |
| RPMI 1640 | PAA | E15 - 039 | without L-Glutamine |
| Sodium Pyruvate | GIBCO | 1137663 | 100 mM |
| Trypan Blue Solution | Sigma-Aldrich | T8154 | 0.4% |
| William’s E | GIBCO | 32551-020 | |
| with GlutaMAX™ | |||
| EGTA | Sigma-Aldrich | 03780-50G | |
| Fortecortin | Merck | 49367 | 8 mg/2 ml |
| Human-Insulin | Lilly | HI0210 | 100 I.E./ml |
| N-Acetyl cysteine | Sigma-Aldrich | A9165-5G | |
| Fetal calf serum (FCS) | PAA | A15-101 | |
| Name | Company | Catalog Number | Comments |
| Equipment for Immunostainings | |||
| CD 68 | R&D Systems, USA | monoclonal | |
| CK 19 | Santa Cruz | D2309 | polyclonal |
| CK18 | Santa Cruz | K2105 | monoclonal |
| Vimentin | Santa Cruz | monoclonal | |
| GFAP | Sigma Aldrich | monoclonal | |
| Triton X-100 | Sigma Aldrich | 23.472-9 | |
| Goat anti-Mouse IgG1-PE | Santa Cruz | C0712 | |
| Goat anti-rabbit IgG-FITC | Santa Cruz | L0412 | |
| Methanol | J.T.Baker | 1104509006 | |
| Formaldehyde 4% | Herbeta Arzneimittel | 200-001-8 | |
| Bovine serum albumin (BSA) | Sigma Aldrich | A7906-100G |
References
- Pfeiffer, E., et al. Isolation, characterization, and cultivation of human hepatocytes and non-parenchymal liver cells. Exp Biol Med. , Maywood. (2014).
- Si-Tayeb, K., Lemaigre, F. P., Duncan, S. A. Organogenesis and development of the liver. Dev Cell. 18 (2), 175-189 (2010).
- Alpini, G., Phillips, J. O., Vroman, B., LaRusso, N. F. Recent advances in the isolation of liver cells. Hepatology. 20 (2), 494-514 (1994).
- Godoy, P., et al. Recent advances in 2D and 3D in vitro systems using primary hepatocytes, alternative hepatocyte sources and non-parenchymal liver cells and their use in investigating mechanisms of hepatotoxicity, cell signaling and ADME. Arch Toxicol. 87 (8), 1315-1530 (2013).
- Gómez-Lechón, M. J., Castell, J. V., Donato, M. T. Hepatocytes--the choice to investigate drug metabolism and toxicity in man: in vitro variability as a reflection of in vivo. Chem Biol Interact. 168 (1), 30-50 (2007).
- Ginai, M., et al. The use of bioreactors as in vitro models in pharmaceutical research. Drug Discov Today. 18 (19-20), 922-935 (2013).
- Schyschka, L., et al. Hepatic 3D cultures but not 2D cultures preserve specific transporter activity for acetaminophen-induced hepatotoxicity. Arch Toxicol. 87 (8), 1581-1593 (2013).
- Kostadinova, R., et al. A long-term three dimensional liver co-culture system for improved prediction of clinically relevant drug-induced hepatotoxicity. Toxicol Appl Pharmacol. 268 (1), 1-16 (2013).
- Messner, S., Agarkova, I., Moritz, W., Kelm, J. M. Multi-cell type human liver microtissues for hepatotoxicity testing. Arch Toxicol. 87 (1), 209-213 (2013).
- Nussler, A. K., Nussler, N. C., Merk, V., Brulport, M., Schormann, W., Yao, P., Hengstler, J. G. The Holy Grail of Hepatocyte Culturing and Therapeutic Use. Strategies in Regenerative Medicine. Santin, M. , Springer. New York. 1-38 (2009).
- Friedman, S. L., Roll, F. J. Isolation and culture of hepatic lipocytes, Kupffer cells, and sinusoidal endothelial cells by density gradient centrifugation with Stractan. Anal Biochem. 161 (1), 207-218 (1987).
- Knook, D. L., Blansjaar, N., Sleyster, E. C. Isolation and characterization of Kupffer and endothelial cells from the rat liver. Exp Cell Res. 109 (2), 317-329 (1977).
- Alabraba, E. B., et al. A new approach to isolation and culture of human Kupffer cells. J Immunol Methods. 326 (1-2), 139-144 (2007).
- Friedman, S. L., et al. Isolated hepatic lipocytes and Kupffer cells from normal human liver: morphological and functional characteristics in primary culture. Hepatology. 15 (2), 234-243 (1992).
- Lalor, P. F., Lai, W. K., Curbishley, S. M., Shetty, S., Adams, D. H. Human hepatic sinusoidal endothelial cells can be distinguished by expression of phenotypic markers related to their specialised functions in vivo. World J Gastroenterol. 12 (34), 5429-5439 (2006).
- Lee, S. M., Schelcher, C., Demmel, M., Hauner, M., Thasler, W. E. Isolation of human hepatocytes by a two-step collagenase perfusion procedure. J Vis Exp. (79), (2013).
- Rajan, N., Habermehl, J., Coté, M. F., Doillon, C. J., Mantovani, D. Preparation of ready-to-use, storable and reconstituted type I collagen from rat tail tendon for tissue engineering applications. Nat Protoc. 1 (6), 2753-2758 (2006).
- Chang, W., et al. Isolation and culture of hepatic stellate cells from mouse liver. Acta Biochim Biophys Sin (Shanghai). 46 (4), 291-298 (2014).
- Zeng, W. Q., et al. A new method to isolate and culture rat kupffer cells. PLoS One. 8 (8), e70832(2013).
- Tokairin, T., et al. A highly specific isolation of rat sinusoidal endothelial cells by the immunomagnetic bead method using SE-1 monoclonal antibody. J Hepatol. 36 (6), 725-733 (2002).
- Damm, G., et al. Human parenchymal and non-parenchymal liver cell isolation, culture and characterization. Hepatology International. 7, 915-958 (2013).
- Baccarani, U., et al. Isolation of human hepatocytes from livers rejected for liver transplantation on a national basis: results of a 2-year experience. Liver Transpl. 9 (5), 506-512 (2003).
- Shen, L., Hillebrand, A., Wang, D. Q., Liu, M. Isolation and primary culture of rat hepatic cells. J Vis Exp. (64), (2012).
- Gerlach, J. C., et al. Large-scale isolation of sinusoidal endothelial cells from pig and human liver. J Surg Res. 100 (1), 39-45 (2001).
Reprints and Permissions
