Several children with unilateral Cerebral Palsy seem to disregard the preserved capacity of their affected upper limb. This Developmental Disregard is extensively described in the literature but the involved cognitive processes have not been studied. To study underlying cognitive factors of upper limb control, an event-related potential protocol was developed.
Method Article
Event-related Potentials During Target-response Tasks to Study Cognitive Processes of Upper Limb Use in Children with Unilateral Cerebral Palsy
In This Article
Summary
Abstract
Unilateral Cerebral Palsy (CP) is a neurodevelopmental disorder that is a very common cause of disability in childhood. It is characterized by unilateral motor impairments that are frequently dominated in the upper limb. In addition to a reduced movement capacity of the affected upper limb, several children with unilateral CP show a reduced awareness of the remaining movement capacity of that limb. This phenomenon of disregarding the preserved capacity of the affected upper limb is regularly referred to as Developmental Disregard (DD). Different theories have been postulated to explain DD, each suggesting slightly different guidelines for therapy. Still, cognitive processes that might additionally contribute to DD in children with unilateral CP have never been directly studied. The current protocol was developed to study cognitive aspects involved in upper limb control in children with unilateral CP with and without DD. This was done by recording event-related potentials (ERPs) extracted from the ongoing EEG during target-response tasks asking for a hand-movement response. ERPs consist of several components, each of them associated with a well-defined cognitive process (e.g., the N1 with early attention processes, the N2 with cognitive control and the P3 with cognitive load and mental effort). Due to its excellent temporal resolution, the ERP technique enables to study several covert cognitive processes preceding overt motor responses and thus allows insight into the cognitive processes that might contribute to the phenomenon of DD. Using this protocol adds a new level of explanation to existing behavioral studies and opens new avenues to the broader implementation of research on cognitive aspects of developmental movement restrictions in children.
Introduction
Cerebral Palsy (CP) is defined as a group of neurodevelopmental disorders related to movement and posture impairments that are caused by disturbances to the developing foetal or infant brain1. Even though these impairments are non-progressive, they are associated with lifelong disabilities1,2. One of the most common subtypes of CP is unilateral CP, accounting for more than one third of all cases3. It is characterized by pronounced motor deficits on one side of the body that are frequently more prominent in the upper limb1,3. Next to the reduced movement capacity of the affected upper limb, several children with unilateral CP also seem to fail to spontaneously use the remaining capacity of their affected hand in daily life4-8. This disregard of the remaining capacity of the affected upper limb in unilateral CP has frequently been referred to as Developmental Disregard (DD) 4-11.
Apart from the traditional explanations of DD based on behavioral reinforcement theories 4, more recent studies have emphasized the importance of cognitive factors for understanding DD 5,9-11. These theories are based on the idea that certain motor deficits in children with unilateral CP are actually caused by dysfunctional cognitive processes that are necessary for successful goal-directed motor behavior, rather than by the movement restrictions itself. In this respect DD has been compared to the phenomenon of post-stroke motor neglect, suggesting visuo-spatial attention deficits9,11,12,. Alternatively, it has been proposed that the lack of use of the affected hand during crucial developmental periods does not only affect motor development, but is also associated with a delay of cognitive processes related to motor behavior 5,10.
Although DD has been extensively described in the literature and different theories have emphasized the possible contribution of altered cognitive processes 5,9-11, these cognitive processes related to goal-directed motor behavior have never been directly studied in unilateral CP. The current protocol was developed to assess cognitive aspects related to upper limb control in children with unilateral CP. The protocol describes the use of event-related brain potentials (ERPs) extracted from the ongoing EEG during manual target-response tasks.
ERPs offer the unique opportunity to measure neural responses that are time locked to distinct processing stages related to an overt response. That is, they allow to study different cognitive processes related to goal directed motor responses, such as response selection, response preparation, and response inhibition processes. Furthermore, ERPs consist of several components, each of them associated with different cognitive processes (e.g., the N1 with early attention processes, the N2 with cognitive control and the P3 with cognitive load and mental effort). Likewise, using ERPs during a simple manual target-response task enables us to directly study different cognitive processes related to different processing stages of upper limb control in children with unilateral CP with and without DD.
Protocol
Approval for different experiments using this experimental design was obtained from the local Ethical Committee of the Faculty of Social Sciences (ECSW) from the Radboud University Nijmegen as well as by the regional Medical Research Ethics Committee, the CMO Arnhem-Nijmegen (Registration number: 2012/049; NL nr.: 39607.091.12).
1. Participants
- Only include children that are diagnosed with unilateral CP as diagnosed by a medical specialist (i.e., neurologist, pediatrician).
NOTE: The ERP protocol to assess cognitive aspects underlying upper limb motor control has been developed for children with unilateral CP, but is not restricted to this group only. - Only include children older than 5 years old10,11.
NOTE: Younger children might not be able to pay attention to the task during the whole procedure. - Exclude children with severe visual and auditory impairments.
NOTE: It is recommended to include children who only have slight visual and auditory impairments if they are able to perform the task and show no differences with respect to response speed or accuracy compared to children participating without visual impairments. However, possible impairments need to be specified in a later report and possibly controlled for in the final analyses. - Finally, exclude children that are unable to comply to the task due to possible cognitive impairments and/or behavioral disorders.
- Prior to the EEG measurement, have a trained occupational therapist and/or physiotherapist assess the children with respect to the manual ability (MACS) of the affected hand 13 as well as the possible presence of DD.
- To assess DD, calculate an index comparing the typical amount of use of the affected hand and arm during spontaneous daily activities (performance) with the quality of hand/arm skill under ideal conditions (capacity) 14,15. To do so use valid and reliable tests for assessing hand capacity and hand performance 16. Recommendation: Use indices that have previously been used and preferably validated14,15. The use of the VOAA-DDD-R for determining DD is highly recommended, as the psychometrics of this task have been published 14.
- Since manual ability as well as DD may change over time (e.g., due to therapy results), schedule this assessment shortly before or after the EEG measurement (preferably within the same week).
- Furthermore, collect demographical data of the children (e.g., age, gender, medication and seizure history) to be able to take these variables into account (e.g., when matching groups or interpreting results).
2. Developing the Visual Target-response Task
- Write a script for the computerized visual target-response task. See Supplemental Code Files for an example script.
- To present the visual stimuli on a computer screen, use a stimulus delivery and experimental control program that is time accurate enough to send time-locked markers to the EEG signal whenever a stimulus is presented. For registering responses, use a device that registers time accurate (1 msec) button presses and delivers related stimulus markers to the EEG computer (see Table of Materials).
- For visual stimuli use clear shapes presented on a white background that are easy to recognize (examples are shapes or simple objects) and easy to distinguish (e.g., based on color, shape, size). Recommended are simple graphic designs instead of complex stimuli like photographs.
- Follow the recommendations below to design ERP experiments for children. Note: Designing ERP experiments for children is often challenging, because children may have a limited capacity to comply to long repetitive experiments.
- Present stimuli that are big enough to be easily recognized by the child (recommended size: 7 x 7 cm).
- Furthermore, preferably use stimuli that are attractive for the children to keep children's attention to the task (e.g., smiley's). Figure 1 displays an experimental protocol that can be used in young children to study different cognitive processes during simple hand movements.
- Make sure to include clearly different stimuli for right vs. left hand movement initiation. This allows comparing the distinct processing stages involved in movements of both the affected and the less affected hand in children with unilateral CP. This within-subject design allows participating children to serve as their own control participant (affected vs. less affected hand).
- Recommendation: Present stimuli to the left or the right side of the screen to respectively induce left or right hand movements. To control for stimulus lateralization, include a background-stimulus to the other side of the screen.
- Present the same amount of stimuli to the affected as to the less affected side. Use a minimum of 20 repetitions per stimulus-category to allow averaging of the event-related potentials 11. However, ensure that the length of the experiment does not exceed 10 min as children might not be able to attend to a longer task procedure. Earlier ERP studies in children with CP report protocols between 4.5 and 10 min 10,11,17,18. If a longer protocol is used, allow the child to take a break after 10 min and continue afterwards.
- For recording the responses to the presented stimuli, provide two big response buttons (recommended: diameter: 9.5 cm; height: 5.5 cm) with very low response force requirements to make sure that even children with substantial movement restrictions are easily able to respond.
- Adapt the study paradigm to measure cognitive processes of interest and rule out possible alternative explanations of the data.
- Example of experimental design: Cued Go/Nogo Task (Figure 1)
- For a cued go/nogo task to study response selection, response preparation as well as response inhibition, present four different types of visual stimuli: background-stimuli (implemented as a baseline measure of visual stimulus processing), cue-stimuli for the left and the right side (implemented to study stimulus selection processes), go/target-stimuli for the left and the right side (implemented to study response preparation processes) and nogo-stimuli for the left and the right side (implemented to study response inhibition processes).
- Recommendation: Present background- and cue-stimuli for 1,000 msec. Present target-stimuli until a response is made. Present nogo-stimuli for 1,500 msec. Keep the inter-stimulus interval (ISI) between cue- and target/nogo-stimuli fixed (recommended: 1,000 msec). Keep the ISI after each correct response following target or go stimuli random (recommended: between 1,000-1,500 msec).
- In order to avoid confounding oddball activity, present target- and nogo-stimuli in an equiprobable manner.
NOTE: Although this paradigm diminishes effects of inhibition on the nogo-stimuli 19, it allows a more direct comparison of the ERPs elicited by both the target- and nogo-stimuli. - After each correct response to a target-stimulus or a correct inhibited response to a nogo-stimulus, present some form of motivating feedback (e.g., a short laughing sound).
3. The Data Acquisition System
NOTE: For measurements with children a mobile EEG lab is highly recommended. A mobile lab allows conducting the study in an environment that is familiar to the child (e.g., school, rehabilitation centre, home). If a mobile EEG setup is not available, ensure that the child is comfortable with the testing environment. During EEG preparation it is recommended to have some distraction/ entertainment for the child (e.g., watching a film).
- Use two computers: one presenting the stimuli and a second computer to record and digitize the EEG. Connect the computers so that event codes can be sent to the EEG digitization computer whenever an event of some sort occurs (e.g., stimulus, response).
- When choosing the electrode-amplifier system use an active electrode system (highly recommended) to reduce the signal to noise ratio.
NOTE: Active electrodes improve the signal to noise ratio, because the first step of amplification is conducted at the site of the electrode, thus minimizing the impact of intervening noise signals. A great benefit of this active electrode system is that an electrically isolated chamber is not necessary during EEG recording allowing to measure in almost every environment.- Even with an active electrode system, be careful not to measure close to electrical or mechanical devices.
- Choose the number of the electrodes based on the research question and study population. A 32-channel electrode system (together with a 32-channel EEG amplifier) is sufficient for studying most cognitive processes related to different processing stages of upper limb control in children.
4. Electrophysiological Recordings
- Start with cleaning the skin at the position where the reference electrode is placed to reduce the impedance (recommendation: place the reference electrode on the left mastoid bone and another active electrode on the right mastoid bone for offline re-referencing to linked mastoids).
- Clean the skin at the reference electrode placement by gently applying scrub cream to remove dead skin cells and clean it with alcohol to remove oily substances.
- In addition, clean the forehead and the skin surrounding the eyes for the EOG (electro-oculogram) electrodes (more information on EOG recordings in step 4.6). Be careful when scrubbing the face, the skin here may be very sensitive.
- Before putting the cap on the participants head, measure the head circumference to determine the cap size. To determine the circumference, place a measuring tape around the widest part of the head, just above the ears.
- Apply the cap with the corresponding size and check whether it is in the right position.
- To do this, measure the distance between Inion (bulging part of the occipital bone at the back of the skull) and Nasion (point where the top of the nose meets the ridge of the forehead) and between the left and right inter-aural indentations. Place the Cz electrode at exactly 50% of these distances. Using a cap ensures that if Cz is correctly located over the central vertex, all the other electrodes are automatically positioned at the standard locations according to the international 10-20 system 20.
- Place the electrodes according to the International 10-20 system20 by using the numbers on the cap and electrodes.
- Locate electrodes at five midline sites (Fz, FCz, Cz, Pz and Oz) and 24 lateral sites (FP1/2, F7/8, F3/4, FC5/6, FC1/2, C3/4, CP5/6, CP1/2, P7/8, P3/4, T7/8, O1/2) to allow estimations of scalp distributions for finding spatial maxima of the ERP components of interest during the offline data processing (see Figure 2).
- If the reference electrode is placed on the left mastoid bone, place one more electrode on the right mastoid bone for linked-reference recording. Place the Ground electrode on AFz (see Figure 2 for schematic of electrode placement).
- Fill the electrodes with conductive gel by inserting a blunt needle through the electrodes. The gel maximizes skin contact and acts as a malleable extension of the electrodes. In order to lower the impedance, gently abrade the skin under the electrode. Be careful to not apply too much conductive gel as gel might get in contact with gel of an adjacent electrode, thus distorting the signal.
- Co-register an EOG to correct the EEG signal for eye movements during the offline data processing.
NOTE: Especially with children it is difficult to avoid eye movement artifacts through instruction only. Co-registering this EOG signal to subsequently correct for the electrical activity produced by the eyes, therefore is highly recommended for these participants.- For this purpose, place EOG electrodes around the eyes of the children.
- As children's skin is very sensitive, try to avoid the placement of four EOG electrodes. Instead, place only two EOG electrodes by using one of the active electrodes below the right eye and one on the outer canthus of the right eye. When applying an ocular correction during the offline data processing, use F7 and FP2 electrodes as reference electrodes for EOG recording.
- Keep the electrode impedance below 20 kΩ by using an impedance meter while attaching the electrodes.
NOTE: It is recommended to use an amplification system that has this as a built-in function. - Use digitization software to digitize and record the EEG signal according to the manufacturer's instructions. Use the following recommended settings for the recording: digitize at 1,000 samples/sec and online filter between 0.016 and 250 Hz.
5. Executing Target-response Task During EEG Recording
- Place the laptop or computer screen approximately 40 cm in front of the child. Locate the two red buttons next to the laptop keyboard, one at the right side and one at the left side. Keep the distance between the buttons at 30 cm to obviate the possibility that the wrong hand is used to press the button. Locate children's hands slightly above the two red buttons with elbows resting on the table.
- Instruct the child to respond as quickly as possible to the target-stimuli by pressing the red button on the side of the target-stimulus (right button for right stimulus presentation, left button for left stimulus presentation). If nogo-stimuli are included, instruct the child to inhibit their response whenever a nogo-stimulus is presented.
- Conduct a short trial session. Make sure that all stimuli that are used in the experiment appear at least once during this trial session. However, keep this trial session as short as possible (approximately 1 min without unnecessary repetitions) to prevent inducing fatigue later in the protocol.
6. Offline Data Processing
- Behavioral data processing
- Define behavioral variables (e.g., errors, reaction times) before processing the EEG data. It is important that ERP data correspond to the behavioral data (e.g., that only trials with correct responses are used for averaged ERPs).
- Recommendations: Define errors as false hits (e.g., response following cue- and nogo-stimuli within 2,000 msec), omissions following target-stimuli (recommended: no response within 2,000 msec) as well as erroneous responses (wrong button or both buttons pressed simultaneously). Depending on the research question, researchers may wish to exclude these errors in the RT and ERP data.
- Electrophysiological data processing for ERP analyses (recommended steps)
NOTE: Choose a data analysis system that is suitable for analyzing the data aiming at answering the specific research question. Different systems are better suitable for different analyses purposes (e.g., ERP analyses vs. frequency analyses). It is possible to independently program this software as well as using a commercial EEG analysis system. The instructions provided below are specific for BrainVision Analyzer. Using BrainVision Analyzer is only one out of many available options to analyze ERP data.- If a linked-reference recording was chosen (reference electrode placed on one of the mastoid bones and another active electrode placed on the other mastoid bone), re-reference the signal of every EEG electrode to linked mastoids. Select the channel placed on the right mastoid bone as a new reference channel and include the implicit reference into calculation of the new reference (Transformations--> Channel Preprocessing--> New Reference).
- Apply an ocular correction by using the signal recorded from the vertical and horizontal EOG channels (e.g., Gratton & Coles 21). If only two EOG channels were used, use F7 and Fp2 electrodes as reference electrodes for the EOG channels (Transformations--> Ocular Correction).
- Apply an appropriate filter (Transformations--> Data Filtering--> IIR Filters). For ERPs recorded in children it is recommended to use a high-pass filter with a cutoff of 0.5 Hz and a low-pass filter that does not exceed 40 Hz.
- Segment the signal related to the different stimuli into equal segment epochs based on the different marker positions (Transformations--> Segment Analysis Functions --> Segmentation--> Create new Segments based on a marker position). For ERPs following the presentation of visual stimuli use segments from 250 msec prior to the stimulus till at least 750 msec after the stimulus (recommended). Furthermore, exclude the epochs of incorrect trials (false hits & omissions) by means of Boolean selection.
- Detrend the signal to correct for drifts in the signal (Transformation--> Segment Analysis Functions--> DC Detrend).
- Apply an artifact rejection to screen each segment for motor and ocular artifacts such as high frequency muscle activity and remove segments containing artifacts exceeding ±150 µV. Recommendation: use the semiautomatic mode to have more insight into what data is removed (Transformations--> Artifact Rejection--> Semiautomatic Segment Selection).
- Apply an appropriate baseline correction (Transformations--> Segment Analysis Functions--> Baseline Correction). Recommendation: For ERPs following the presentation of visual stimuli use a baseline correction from -250 msec until the presentation of the stimulus.
- Average the segments per stimulus type and hand (affected vs. less affected) (Transformations--> Segment Analysis Functions --> Average).
- Finally, export mean amplitudes for various peaks of interest (Export --> Area Information). Recommendation: To allow blind scoring, define the averaged value within a fixed latency window. To determine the appropriate latency window for the studied group, find the maximum of the peak of interest in the grand-averaged ERPs of all children and define a window reaching 50% of this value before and after the peak. Use this window to export the averaged value of this component window for all individual participants 22.
- Recommendation: As the current research protocol is directed at studying differences in information processing and cognitive abilities, include data from midline electrodes. Endogenous components reflecting differences in information processing and cognitive abilities are clearly visible and identifiable over the vertex due to the widespread activity and smeared scalp topography of the signals.
NOTE: In prior studies using this protocol, data from Fz, FCz, and Cz electrodes were used for data analyses 10,11.
Results
The described protocol has been used in previously published research that studied the underlying cognitive factors contributing to the phenomenon of Developmental Disregard (DD) in children with unilateral Cerebral Palsy (CP) 10,11. Two slightly different protocols have been used in these publications to disentangle different cognitive processes involved in a goal-directed hand response towards a target. In both articles significant differences in cognitive processes between groups (DD and noDD) were found in reaction to target-stimulus presentation on midline electrodes (Fz, FCz, Cz). The representative results therefore show event-related brain potentials (ERPs) elicited by target-stimuli (elicited in a go/nogo-task as shown in Figure 1) in children with unilateral CP with and without DD. The figures presented are based on recordings of 24 children with unilateral CP between 5 and 11 years old.
Averaging across trials and participants produces an ERP waveform that consists of a series of positive and negative deflections: the ERP components. Figure 3 shows the grand-averaged ERPs of 24 children with unilateral CP in response to visual target-stimuli (as presented in Figure 1). Figure 3A shows the grand-averaged ERPs at FCz electrode position for a detailed view of the different potentials. It shows separate potentials for stimulus presentation to the affected side (AS) and to the less affected side (LAS). Figure 3B shows the representation of the potentialsacross the scalp. These grand-averaged ERPs show the mean reaction to stimuli presented to both sides, the affected (AS) and the less affected side (LAS). The grand-averages shown in Figures 3A and 3B contain a clear N1 and P2 component. Instead of a classic P3, a late latency negative component (Nc) is observed at fronto-central scalp position following target-stimuli. This fronto-central negative wave in children was reported earlier to be comparable to the classic P3 wave in adults 20 and has repeatedly been observed in target-response tasks in children with unilateral CP 10,11.
Figure 4 depicts group differences in ERPs between children with unilateral CP with and without DD. Figure 4A depicts the grand-averaged ERPs for both groups (DD and noDD) and each side (affected and less affected side) separately. For both groups the N1 and P2 components as well as the late latency negative component can be observed. However, the negative wave in the P3 domain is significantly larger in the DD group (p < .05). Furthermore, significant differences between the amplitude of the N1 component can be observed between groups. For statistical analyses the averaged values within fixed latency windows were analyzed. To depict significant differences, bar graphs are frequently used as shown in Figure 4B. To interpret the differences between the two groups, there is abundant literature that relates each ERP component to a specific cognitive operation. Whenever significant group differences are found existing literature should be used for appropriate interpretation of the meaning of these differences. How the findings of these representative results have been interpreted related to the research questions is documented in the corresponding publications 10,11.
In addition to the data derived from the ERP recordings, the different target-response tasks also generate behavioral data that can be used for additional analyses. Reaction times (time from target presentation to button press) and errors (e.g., omissions following target-stimuli) can be used as separate additional dependent variables. When studying children with unilateral CP, differences in reaction times between both hands (affected vs. less affected) can be expected 10,11 as shown in Figure 5. However, even if differences on ERPs are observed, it is possible that behavioral measurements show no differences between groups 10.
Another possibility to using reaction times and error scores as separate dimensions is to use a combined score by calculating the Inverse Efficiency Scores (IES). The IES are determined by the mean reaction time divided by the proportion of correct responses expressed in milliseconds 23. This method is considered to be especially useful in tasks with low (<10%) error rates 23. As the current protocol suggests very easy target-response procedures, a low error rate is anticipated and has been documented in prior published work 10,11.

Figure 1. Example of a target-response task experiment suitable for a broad age range. The example consists of visual stimuli of pairs of smiley figures presented against a white background. Two different types of trials are shown: target-trials for the right hand (left) and nogo-trials for the right hand (right). Both trials include background- and cue- stimuli. Please click here to view a larger version of this figure.

Figure 2. Schematic of electrode placement based on the international 10-20 system. The white electrodes represent the applied placement of the 32 active electrodes with linked mastoid reference placement and two active electrodes used for EOG measurement. The orange electrode represents the reference electrode. The gray electrode represents the ground electrode. Please click here to view a larger version of this figure.

Figure 3. Representative grand-averaged ERPs following target-stimuli. Grand-averaged ERP waveforms of 24 children with unilateral CP time locked to target-stimuli. (A) Grand-averaged ERPs at FCz electrode position. The continuous line represents the ERPs following target-stimulus presentation to the less affected side (LAS). The dashed line represents the ERPs following target-stimulus presentation to the affected side (AS). The time windows around the maxima of the different components of interest (N1, P2, and P3/Nc) are highlighted. (B) The representation of the grand-averaged ERPs across the scalp. Please click here to view a larger version of this figure.
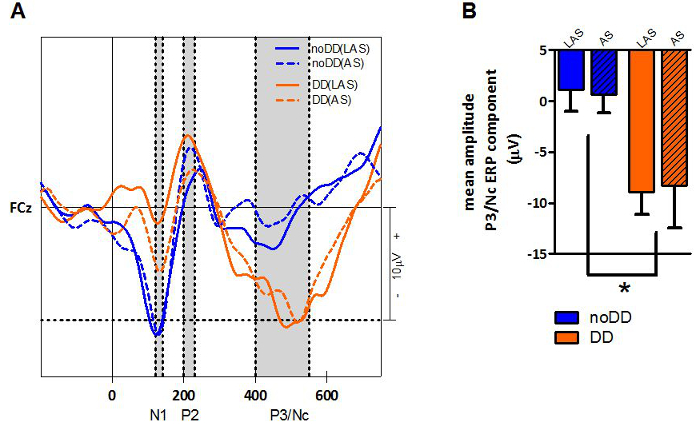
Figure 4. Representative grand-averaged ERPs following target-stimuli displaying differences between two groups. (A) Grand-averaged ERP waveforms of the same 24 children with unilateral CP as presented in Figure 3, time locked to target-stimuli. Twelve children were classified as having DD. The blue lines represent the ERPs of children with unilateral CP without DD (noDD; N = 12). The orange lines represent the ERPs for children with DD (DD; N = 12). The continuous lines represent the ERPs following target-stimulus presentation to the less affected side (LAS). The dashed lines represent the ERPs following target-stimulus presentation to the affected side (AS). The time windows around the maxima of the different components of interest (N1, P2, and P3/Nc) are highlighted. (B) P3/Nc amplitudes (mean ± SEM µV) to target-stimuli as depicted in Figure 3A. The blue bars represent the mean values of P3/Nc amplitude for children without DD. The orange bars represent the mean values of P3/Nc amplitude for children with DD. The clear bars represent the results of the less affected side (LAS). The striped bars represent the results of the affected side (AS). The asterisk indicates a significant (p< .05) difference between both groups concerning the P3/Nc amplitude. Please click here to view a larger version of this figure.
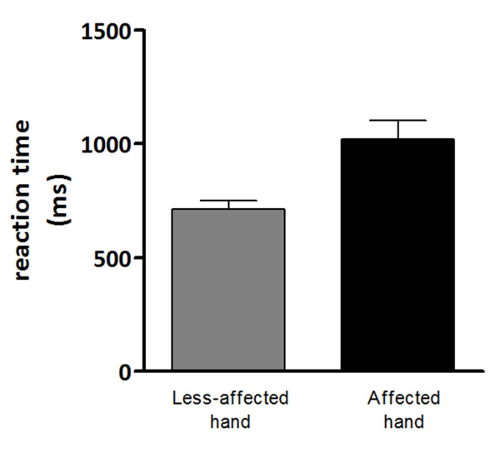
Figure 5. Representative reaction time data displaying differences between affected and less affected hand. Depicted are means ± SEMs. The gray bar shows the mean reaction time to target-stimuli of 24 children with unilateral CP with their less affected hand. The black bar shows the mean reaction time to target-stimuli of the same children with their affected hand. Please click here to view a larger version of this figure.
Discussion
This article presents a protocol developed to directly assess cognitive processes related to movement control during simple upper limb movements in children with unilateral Cerebral Palsy (CP) and Developmental Disregard (DD). Unilateral CP is a non-progressive neurodevelopmental disorder that is characterized by movement deficits on one side of the body, primarily affecting the upper limb 1,3. Children with DD show a disregard of the preserved capacity of their affected hand during spontaneous daily activities 5. The current protocol was developed to unravel the related cognitive mechanisms that might contribute to the phenomenon of DD with the goal of improving existing rehabilitation procedures for these children. By using this protocol valuable new insights were obtained about the underlying cognitive processes related to simple upper limb movements in children with DD 10,11.
Critical to this protocol is the use of event-related brain potentials (ERPs) during a very easy executable target-response task. The simplicity of conducting the task allows for the inclusion of young children with movement restrictions. Recording ERPs during the task is used as a powerful non-invasive neuroimaging technique that measures neural activity with a high temporal resolution. Using this protocol allows for the study of the cognitive aspects related to distinct processing stages of upper limb control in children with unilateral CP. As such, it extends behavioral examinations to the neurophysiological level. Furthermore, the protocol can be easily adapted by presenting different stimuli (e.g., cue-stimuli, nogo-stimuli) or adapting stimulus presentation time as well as inter-stimulus intervals. It is therefore possible to directly assess different cognitive processes involved in upper limb control (e.g., response preparations vs. response inhibition).
Next to the idea that certain motor deficits in children with unilateral CP are actually caused by dysfunctional cognitive processes, another important aspect that might contribute to the observed motor deficits in children with DD is a possible sensory deficit 18. Due to injury to specific thalamocortical and corticocortical pathways some children with unilateral CP do not receive accurate sensory feedback from their movements 24. This in turn has been proposed to lead to an underuse of the affected hand, i.e., DD. The current protocol does not directly assess this possible sensory deficit. For the detailed assessment of different sensory processing in children with movement disabilities, we refer to the work of Maitre and Key(2014)25.
To ensure accurate and valid results, there are a few critical points to keep in mind. Before starting an EEG experiment, it is first of all important to understand the associated limitations of this technique. The relatively poor spatial resolution as well as the difficulty of inferring subcortical activity are important issues to consider. If the research question is aimed at neuro-anatomically localizing specific processes during upper limb control, alternative neuroimaging methods should be considered (e.g., (f)MRI). However, it should be clearly stated that the non-invasiveness of EEG as well as the possibility of using a mobile lab to measure at locations that are familiar to the child offers a tremendous advantage over other techniques.
Next to the poor spatial resolution of EEG measurements, the noise introduced by blinks and muscle activity is also disadvantageous. Especially in children it is very difficult to give appropriate instructions to reduce these artifacts. It is therefore very important to use a protocol that keeps children's attention and does not take too long.
The current protocol offers new empirical insights into the underlying cognitive processes that contribute to the phenomenon of DD in children with unilateral CP 10,11. These insights might be of high value not only for further understanding of DD, but also for individualizing the current therapies. Furthermore, the capability of this protocol to directly assess underlying cognitive factors of upper limb control could give rise to a possible broader implementation for research on cognitive aspects related to movement development in children.
Disclosures
The authors declare that they have no competing financial interests.
Acknowledgements
This work is part of a doctoral dissertation that was supported by grants from (in alphabetical order): Hersenstichting Nederland, Johanna KinderFonds, Stichting Rotterdams Kinderrevalidatie Fonds Adraanstichting, Phelps Stichting voor Spastici, and Revalidatie fonds.
Materials
| Name | Company | Catalog Number | Comments |
|---|---|---|---|
| "Presentation" stimulus delivery and experimental control program for neuroscience | NeuoBehavioralSystems | company web address: http://www.neurobs.com/index_html Alternate stimulus presenation software can be used | |
| Button Box, for time accurate(1ms) button press registration | TSG, Radboud University Nijmegen | company web address: http://tsgdoc.socsci.ru.nl/ index.php?title=ButtonBoxes Alternate button press registration device can be used | |
| BrainAmp DC 32 channels EEG/EP system, with BUA 128 USB interface S/N: AMP13061963DC, BUA128-1302289, EIB13010349 | MedCaT B.V. | BP-01100 | company web address: http://www.medcat.nl/Research/acticap.htm For measurements with children a mobile EEG lab is highly recommended |
| Acticap 32 channel standard cap set S/N: aCAP11101664, aEB13032942 | MedCaT B.V. | BP-04200 | company web address: http://www.medcat.nl/Research/acticap.htm It is highly recommended to use an active electrode system |
| BrainVision Recorder Software license USB Dongel: UR11471 & BrainVision Analyzer Software license USB Dongel: U12512 | Brain products | BP00020 & BP00120 | company web address: http://www.brainproducts.com/ Alterante recording and analyzing software can be used |
| NuPrep | MedCatSupplies | 10-30 | company web address: http://www.medcat.nl/supplies/ Alternate skin preparation exfoliants can be used |
| Skin Conductance Electrode Paste | MedCatSupplies | TD-246 | company web address: http://www.medcat.nl/supplies/ Alternate EEG conductive electrode gel can be used |
| Blunt needle and syringe kit | MedCatSupplies | JG161.5 & 30xxxx | company web address: http://www.medcat.nl/supplies/ Needle and syringe kit is used to apply conductive gel to electrode embedded in the EEG cap |
| Acticap Holder for Active Electrodes and stickers | MedCatSupplies | BP-04244 & Z85-10x | company web address: http://www.medcat.nl/supplies/ Acticap Holders and stickers are used for fixating EOG electrodes |
References
- Rosenbaum, P., et al. A report: the definition and classification of cerebral palsy April 2006. Dev Med Child Neurol. Supplement. 109, 8-14 (2007).
- Aisen, M. L., et al. Cerebral palsy: clinical care and neurological rehabilitation. Lancet Neurol. 10, 844-852 (2011).
- Odding, E., Roebroeck, M. E., Stam, H. J. The epidemiology of cerebral palsy: incidence, impairments and risk factors. Disabil Rehabil. 28, 183-191 (2006).
- Taub, E., Ramey, S., DeLuca, S., Echols, K. Efficacy of constraint-induced movement therapy for children with cerebral palsy with asymmetric motor impairment. Pediatrics. 113, 305-312 (2004).
- Houwink, A., Aarts, P., Geurts, A., Steenbergen, B. A neurocognitive perspective on developmental disregard in children with hemiplegic cerebral palsy. Res Dev Disabil. 32, 2157-2163 (2011).
- Deluca, S., Echols, K., Law, C., Ramey, S. Intensive pediatric constraint-induced therapy for children with cerebral palsy: randomized, controlled, crossover trial. J Child Neurol. 21, 931-938 (2006).
- Hoare, B., Wasiak, J., Imms, C., Carey, L. Constraint-induced movement therapy in the treatment of the upper limb in children with hemiplegic cerebral palsy. Cochrane Database Syst Rev. (2), (2007).
- Boyd, R., et al. INCITE: A randomised trial comparing constraint induced movement therapy and bimanual training in children with congenital hemiplegia. BMC Neurol. 10, 4(2010).
- Sutcliffe, T., Logan, W., Fehlings, D. Pediatric constraint-induced movement therapy is associated with increased contralateral cortical activity on functional magnetic resonance imaging. J Child Neurol. 24, 1230-1235 (2009).
- Zielinski, I. M., Jongsma, M. L., Baas, C. M., Aarts, P. B., Steenbergen, B. Unravelling developmental disregard in children with unilateral cerebral palsy by measuring event related potentials during a simple and complex task. BMC Neurol. 14, 6(2014).
- Zielinski, I. M., Steenbergen, B., Baas, C., Aarts, P., Jongsma, M. Neglect-like characteristics of developmental disregard in children with cerebral palsy revealed by event related potentials. BMC Neurol. 14, 221(2014).
- Saevarsson, S. Motor Response Deficits of Unilateral Neglect: Assessment, Therapy, and Neuroanatomy . Appl Neuropsychol Adult. , (2013).
- Eliasson, A. C., et al. The Manual Ability Classification System (MACS) for children with cerebral palsy: scale development and evidence of validity and reliability. Dev Med Child Neurol. 48, 549-554 (2006).
- Houwink, A., Geerdink, Y., Steenbergen, B., Geurts, A., Aarts, P. Assessment of upper-limb capacity, performance, and developmental disregard in children with cerebral palsy: validity and reliability of the revised Video-Observation Aarts and Aarts module: Determine Developmental Disregard (VOAA-DDD-R). Dev Med Child Neurol. 55, 76-82 (2013).
- Sutcliffe, T., Logan, W., Fehlings, D. Pediatric constraint-induced movement therapy is associated with increased contralateral cortical activity on functional magnetic resonance imaging. J.Child Neurol. 24 (10), 1230-1235 (2009).
- Klingels, K., Jaspers, E., Van de Winkel, A. A systematic review of arm activity measures for children with hemiplegic cerebral palsy. Clin Rehabil. 24 (10), 887-900 (2010).
- Maitre, N. L., et al. Feasibility of event-related potential methodology to evaluate changes in cortical processing after rehabilitation in children with cerebral palsy: a pilot study.J Clin Exp Neuropsyc. 36 (7), 669-679 (2014).
- Maitre, N. L., Barnett, Z. P., Key, P. F. Novel Assessment of Cortical Response to Somatosensory Stimuli in Children With hemiparetic Cerebral Palsy. J Child Neurol. 27 (10), 1276-1283 (2012).
- Lavric, A., Pizzagalli, D. A., Forstmeier, S. When 'go' and 'nogo' are equally frequent: ERPcomponents and cortical tomography. Eur J Neurosci. 20, 2483-2488 (2004).
- Sharbrough, F., et al. American Encephalographic Society guidelines for standard electrode position nomenclature. J Clin Neurophysiol. 8, 200-202 (1991).
- Gratton, G., Coles, M., Donchin, E. A new method for off-line removal of ocular artifact. Electroen Clin Neuro. 55 (4), 468-484 (1983).
- Picton, T. W. The P300 wave of the human event-related potential. J Clin Neurophysiol. 9, 456-479 (1992).
- Bruyer, R., Brysbaert, M. Combining Speed and Accuracy in Cognitive Psychology: Is the Inverse Efficiency Score (Ies) a Better Dependent Variable Than the Mean Reaction Time (Rt) and the Percentage of Errors (Pe)? Psychol Belg. 51, 5-13 (2011).
- Auld, M. L., Ware, R. S., Boyd, R. N., Moseley, G. L., Johnston, L. M. Reproducibility of tactile assessments for children with unilateral cerebral palsy. Phys Occup Ther Pediatr. 32 (2), 151-166 (2012).
- Maitre, N. L., Key, A. P. Quantitative assessment of cortical auditory-tactile processing in children with disabilities. J Vis Exp. 29 (83), (2014).
Reprints and Permissions
